Synopsis
The extracellular region of a group of cell surface receptors known as the polycystic kidney disease 1 family, comprising amongst others polycystin-1, has been controversially described as containing four fibronectin type III (FNIII) domains or one REJ module in the same portion of polypeptide. Stimulated by recent atomic force microscopy work we re-examined the similarity of these four domains with a FNIII sequence profile showing the evolutionary relationship. Two of the predicted domains could be expressed in bacteria and refolded to give protein suitable for biophysical study and one of these expressed solubly. Circular dichroism spectroscopy showed that both domains contain a significant amount of β-sheet, in good agreement with theoretical predictions. Confirmation of independent folding as a domain is obtained from highly cooperative thermal and urea unfolding curves. Excellent dispersion of peaks in the high field region of one dimensional NMR spectra confirms the presence of a hydrophobic core. Analytical ultracentrifugation and analytical gel filtration agree very well with the narrow linewidths in the NMR spectra that at least one of the domains is monomeric. Based on this combined theoretical and experimental analysis we show that the extracellular portion of polycystin-1 does indeed contain β-sheet domains, very likely fibronectin type III, and that consequently the REJ module is not a single domain.
Introduction
A continuous segment of protein sequence that shows a high degree of sequence similarity in a range of different proteins is usually called a module [1,2]. This definition does not carry an explicit link to the structure into which the module might fold. Yet it is usually assumed that a module is a domain, i.e. that it is able to fold autonomously into a well defined structure and that it cannot be cut down any further without losing its ability to fold properly [3,4]. For most modules this is the case, therefore the increased availability of newly sequenced proteins and the analysis of their module organization has given a significant boost to structural biology. The ability to cut large proteins down to their constituent modules greatly facilitated their structural and functional characterisation. The automatic annotation of protein genes makes extensive use of established consensus sequences of modules even in cases where no experimental data has confirmed the relationship of modules and domains. Such information is extensively used as the base for numerous experimental studies of proteins where modules are mutated, added, swapped or deleted in the assumption that they are folded autonomously and make a defined contribution to the overall function of the protein.
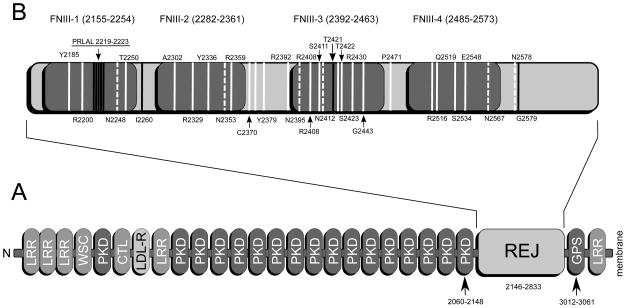
In most cases the assumptions made in the annotations of protein sequences turn out to be true. In others, however, even where structures are known, as in the case of the C2 domain fold [5], annotations may give a wrong estimate of the true size of the domain, resulting in a range of inconclusive experimental results. On the other hand, in the absence of any detailed information, large stretches of highly similar sequence are assigned as a module and thus classified as domain simply because they occur in a number of different proteins. One of such examples is the REJ module, which comprises a large portion of the extracellular region of a number of vertebrate cell surface proteins. Its name derives from the protein in which this module was described for the first time, the receptor of egg jelly protein [6]. This module has a size of ~900 amino acids with no obvious homologues in sequence databases. It is found in the sperm receptor for egg jelly (suREJ), the polycystic kidney disease and receptor for egg jelly related protein (PKDREJ), a number of uncharacterised proteins from genomic sequencing projects [7,8] and polycystin-1 (PC1). The latter is of specific medical interest because mutations in its gene, PKD1, are the main cause for autosomal dominant polycystic kidney disease (ADPKD) for which there is currently no cure [9]. ADPKD1 related mutations are spread evenly throughout the entire PKD1 gene. At present, the only disease caused by mutations in PKD1 is ADPKD through the loss of function of PC1. REJ modules usually occur in the vicinity of the GPS domain which contains an autoproteolytic motif [7,10]. Autoproteolysis is essential for full functionality of polycystin-1 [11] and takes place after N-glycosylation of the protein [12–14]. Several mutations in the REJ module that cause ADPKD interfere with autoproteolysis [15,16] (see Fig. 1) suggesting an important function for the REJ module. Interestingly, in the first description of the gene for PC1 (PKD1) [17] there was no mentioning of the REJ module. Instead, it was proposed that the corresponding region should contain four FNIII domains. This suggestion was subsequently dismissed after an unsuccessful bioinformatics screen of canonical FNIII domains [6] and the region was instead classified as a new type of module called REJ, named after the first gene in which it was identified. All the subsequent literature on PC1 followed this definition and the FNIII domains were virtually forgotten about until recent AFM work on fragments of the extracellular portion of PC1 suggested the existence of smaller domains within the REJ module [18] with an unfolding pattern expected for FNIII domains. This led to a re-examination of the sequence of the REJ module by more advanced computational methods which confirmed the earliest suggestion of the presence of FNIII domains in PC1. To probe the combined evidence of sequence analysis and AFM data we set out to perform an experimental analysis of the properties of the predicted FNIII domains. A reliable blueprint for the REJ module containing proteins is essential to an understanding of their function, especially in the case of polycystic-1 where this region of the protein harbours numerous point mutations involved in ADPKD (Fig. 1).
Figure 1.
A: Cartoon representation of the entire extracellular region of human polycystin-1 from the N-terminus on the left to the start of the first transmembrane helix at residue 3075 on the right. All established domains are labelled: leucine rich repeats (LRR), carbohydrate binding domain present in WSC proteins (WSC), repeats in polycystic kidney disease 1 (PKD), C-type lectin domain (CTL), G-protein coupled receptor proteolytic site domain (GPS), low density lipoprotein receptor domain (LDL). Boxes representing modules are only approximately drawn to scale. Positions in the sequence are only shown for the REJ module and its adjacent domains. B: the REJ module is shown in more detail (not to scale) with the four predicted FNIII domains in grey together with ADPKD related point mutations in the region in white, ADPKD related deletions in blue dark gray and predicted glycosylation sites in white dashed. The PRLAL deletion in domain 1 (underlined) is interfering with autoproteolysis of the GPS domain.
Materials and Methods
Sequence analysis
Four putative Fibronectin type III (abbreviated as FNIII) domains were tentatively identified in the REJ module of human protein PKD1 (SWISSPROT[19] entry: P98161, REJ module : residues 2146-2833; putative FNIII domains: 2155-2254, 2282-2361, 2392-2463, 2485-2573). Forty PDB structure fragments were selected from SCOP FNIII domain family, with each sub-family with at least one representative structure. The structures with two or more consecutive FNIII domains were preferred in the selection. These forty FNIII domain structures were superposed with the MAMMOTH-mult webserver [20] to build structural alignments of their sequences. Similarly, forty PDB structure structure fragments were selected from the SCOP Immunoglobin I-set domain family, and superposed with MAMMOTH-mult. Hidden Markov Models (HMMs) [21] were constructed from these two MAMMOTH structural alignments by HMMER2.3. The four potential REJ module FNIII sequences were then aligned to the forty SCOP FNIII structure sequences and Ig I-set structure sequences based on their HMM by HMMER2.3, respectively.
Cloning and protein expression
All constructs for the FNIII domains were cloned using the In-Fusion method (Clontech) [22] into pLEICS-03 (protein expression laboratory, University of Leicester). The constructs are expressed as fusion protein with the sequence MHHHHHHSSGVDLGTENLYFQSM, containing a his-tag and a TEV site, N-terminally attached which adds 23 residues and 2.7 kD to each domain. After TEV digestion the last two residues, SM, remain. For protein expression in inclusion bodies constructs were transformed into BL21* cells (Invitrogen). Cells were grown at 37 °C and expression was induced with 0.5 mM IPTG (Melford Labs.) at an OD of 0.8 for 4h. Harvested cells were resuspended in wash buffer (20 mM PO4 pH 7.5, 500 mM NaCl, 1 mM β-mercaptoethanol, 0.02% NaN3) and opened using 3 cycles of french press at 1000 psi. Cell debris was centrifuged at 5000rpm in a Beckman Ja 30.50 rotor for 20 mins. At this speed essentially only inclusion bodies are pelleted. The inclusion body pellet is separated and resuspended two times in wash buffer followed by centrifugation each time as before. A third wash of the pellet is performed with wash buffer with additional 1 M urea. In this way, the amount of contaminating proteins is significantly reduced. The protein is then extracted from the inclusion bodies using wash buffer with 8M urea for 2h at room temperature. Remaining insoluble debris is removed by centrifugation in a Beckman Ja 30.50 rotor at 15000 rpm for 1h. The supernatant is loaded on a gravity flow column (empty PD10, GE Healthcare) filled with 2mL fast flow 6 his binding resin (FF6, GE Healthcare). The column is washed with 30 mL wash buffer with 8M urea after which the bound protein is eluted with elution buffer (wash buffer + 500 mM Imidazole + 8M urea). Purity of protein samples was checked on SDS-PAGE gradient gels (Nupage/Invitrogen). Protein concentration was measured by absorption at 280 nm in a dual beam UVIS photometer with the respective buffer as blank. For refolding protein concentration was adjusted to 5 mg/mL. 250 uL of protein solution in elution buffer were then mixed with 4.5 of refolding buffer (50 mM Tris, pH 8.0) to which a volume of 250 uL of Nvoy (Expedeon) stock at a concentration of 25 mg/mL was added. The refolding reaction was left over night at room temperature. The following day an aliquot is taken before the reaction mixture is centrifuged for 30′ in a cooled Beckman bench top centrifuge at 4000g to remove precipitated protein. Another aliquot is taken of the supernatant afterwards. Both aliquots are analysed on SDS-PAGE gradient gels (Nupage/Invitrogen). Nvoy polymer was removed as per manufacturers instructions for some samples. For expression of soluble protein the constructs are transformed into ArcticExpress RIL cells (Stratagene) which contain the chaperonin system Cpn60/10 from O. antarctica [23] for efficient protein folding at low temperature. After growth to an OD of ~0.8 at 37 °C the temperature is lowered to 13 °C and expression induced with 0.25 mM IPTG over night. Cells are opened by french press followed by centrifugation for 90′ at 18000 rpm in a Beckmann JA30.50 rotor. The supernatant is then applied to a FF6 column and purified as above, just without urea. To remove the his-tag 20 units of TEV protease are added per 1mg of protein to the soluble fraction which is then dialysed extensively against wash buffer to remove Imidazole, usually 10–20 mL of solution 3x against 1L of buffer. The solution is applied to the FF6 column as before to remove the cleaved tag, TEV protease and remaining uncleaved protein. The flow through and wash fraction (10 mL) are checked on SDS page, pooled and dialysed as described above against measurement buffer (20 mM sodium phosphate pH 7.5, 50 mM NaCl, 2 mM DTT and 0.02 % NaN3). If required the protein is polished on a preparative gelfiltration column (HiLoad 16/60 Sephardex 75, GE Healthcare). After checking the concentration the protein is concentrated in PES VivaSpin20 concentrators with 3 kD molecular weight cutoff.
Analytical ultracentrifugation
All analytical ultracentrifuge experiments were carried out on a Beckman XL-A analytical ultracentrifuge (Beckman-Coulter, USA). Sedimentation equilibrium was attained at 18000 and 25000 rpm in standard steel AUC cell using quartz windows and a 6 channel centrepiece. Monomer molecular weights and partial specific volumes were calculated from the amino acid sequence using the program SEDNTERP [24]: these were determined to be 15721 Da and 0.7261 g/ml, respectively. Data was processed using the programs SEDFIT and SEDPHAT [25,26] and fitted to single species.
CD spectroscopy
CD spectra were recorded on a Jasco J700 spectropolarimeter fitted with a Peltier temperature control system. Spectra were recorded in rectangular quartz cuvettes (Starna) with 0.1 or 1 mm pathlength. A total of 20 scans were accumulated for one spectrum with a bandwith of 2 nm, a slit width of 1nm, one point per nm and 2 s averaging at each point. Samples of domains 1 and 2 were measured at protein concentrations from 20 uM to 100μM in measurement buffer. Post acquisition spectra were calibrated to molar ellipticity. Secondary structure content was extracted using a home written Mathematica macro by fitting the experimental spectrum to a synthetic spectrum made up of standard spectra for random coil, α-helix and β-sheet using a conjugate gradient minimiser. Thermal denaturation of the domains was monitored at a single wavelength of 214nm using a temperature gradient of 1 °C per minute from 5 °C to 90 °C. Data were recorded at one point per 1 °C. At each point the CD signal was averaged for 1 s. The unfolding curve was fitted to a two state unfolding equation in a home written Mathematica macro which optimised the melting temperature and the slope at unfolding while the initial and final slopes of the curve were optimised manually.
NMR spectroscopy
Spectra were recorded on a Bruker Avance 800 MHz spectrometer fitted with a cryoprobe at sample concentrations from 10–200 uM in 20 mM Tris or phosphate buffers, at pH values from 7.0–8.0, 50 mM NaCl, 2 mM DTT, 0.02% NaN3 at temperatures of 25 °C and 30 °C. Water suppression in all spectra was achieved by Watergate with the offset on the water. The 1D experiments were recorded with 256 scans and the 2D HSQC with 128 scans. All spectra were recorded and processed with Topspin, version 2.1 (Bruker). 1D spectra were apodized by exponential multiplication with a 4 Hz linewidth and zero filled from 8192 to 16384 points prior to Fourier Transformation followed by a standard baseline correction to remove offset effects. The HSQC experiment was processed by zero filling F2 from 2048 to 4096 and F1 from 256 to 2048 points followed by apodisation using a squared sine function shifted by π/2 in both dimensions prior to Fourier Transformation that included an attenuation of the water signal by convolution. Points 2049–4096 in F2 were removed followed by an automatic polynomial baseline correction in F1 and F2. The HSQC spectrum was imported into CCPN analysis for peak picking which was done using the default parameters after manually optimising the peak picking threshold.
Results
Sequence analysis
The original description of the sequence of PC1 suggested the presence of four FNIII domains [17]. However, the sequence analysis was not complete, because additional domains such as the WSC domain, close to the N-terminus and the membrane proximal GPS domain and PLAT/LH2 domain [27,28], were additionally identified later. The assignment of domains was then significantly revised [6] leading to the introduction of the REJ module in place of the originally suggested FNIII domains (figure 1). We followed up the original domain analysis with the aim of using newer methodology to ascertain not only the presence of FNIII domains in the REJ module but also to allow us to distinguish these from other potential β-strand rich domains such as the very closely related immunoglobulin (Ig) fold.
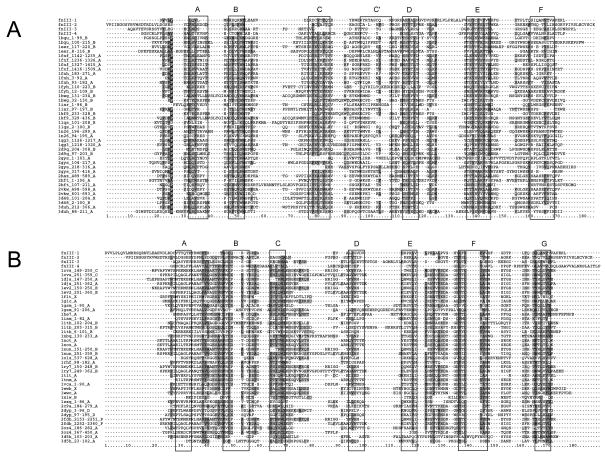
FNIII and Immunoglobin domains are structurally similar topologies composed by 7-strand β-sandwiches arranged in two sheets [29,30]. Structural alignments of forty SCOP FNIII and Ig domain structures separately provide two sets of sequence conservation patterns to help in the classification of the four domain sequences from the REJ module as FNIII or Ig domains. These conservation patterns roughly correspond to the regions of the seven β-strands, which are labelled on FNIII and Ig modules in their alignments with the four PC1 sequences (Fig. 2). These boundary regions were based on the assignments for the FNIII domains [30] (F8 in figure 3 by [30] equal to 1fnf_1236-1326_A in our alignment Fig. 2), and of [31] for the Ig domains (1nct_A and 1ncu_A in our alignment equal to TNM in figure 3 by [31]).
Figure 2.
Sequence alignment of the predicted domains in the REJ module to a set of sequences representative of the FNIII fold (A) and the Ig fold (B). The four putative domains from PC1 are labelled FNIII1-4. All other sequences are taken from structures available from the PDB. All of these are labelled by their PDB accession number, beginning and end of the domain in case of multidomain proteins and the molecule from which the sequence was taken. Expected β-strands for both folds are indicated by black boxes around the alignment which are labelled above. Sequence conservation is indicated by shading of residues (dark gray: hydrophobic; light gray: hydrophilic; Black with white character: proline).
Figure 3.
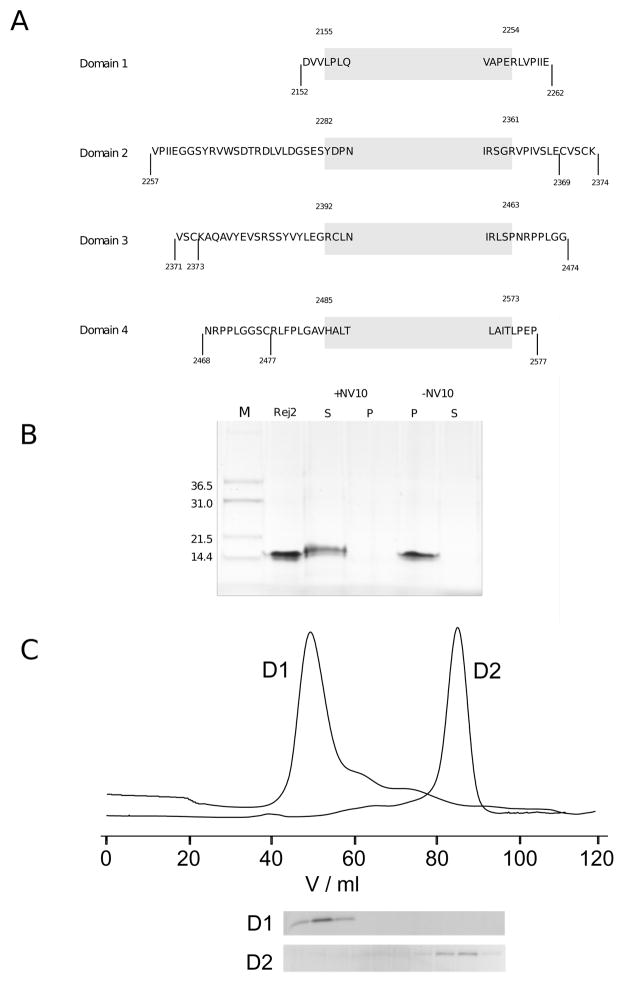
A: Overview of expression constructs. Shown are for all domains the various constructs that were created for expression trials in bacteria. The shaded box indicates the extent of the domain definition which we here take to start two amino acids before the first residue of the first β-strand and to end two residues after the last amino acid of the last β-strand as shown in Fig. 2. A few amino acids are shown at the start and the end of the box to help orientation. Expression was tested for each domain with two constructs: one as indicated by the shaded box, the other indicated by the markers at the end points. The only variation exists for domain 2 where the new, intermediate length construct is indicated that is expressed solubly. B: Refolding of domain 2. Shown is the purified protein before and after refolding in refolding buffer with and withouth NV10 polymer. Soluble (S) and insoluble (P) fractions are shown separated. C: Preparative gel filtration purification of domains 1 and 2 expressed soluble. Elution fractions of nickel affinity purifications of both domains were loaded on a Superdex 75 16/60 preparative column. Domain 2 emerges roughly in agreement with being a monomer while domain 1 appears close to the exclusion volume suggesting a heavily aggregated yet well soluble state.
The sequence conservation patterns in the strand regions are well kept in the four PC1 sequences for strands A, E and F of FNIII modules, and are not completely matching the other strands of FNIII modules. By contrast, the conservation patterns presented in the Ig structure alignments can only be incompletely observed in the regions of strand B, E and F and hardly observed in the region of other strands for the Ig module. As firstly observed [30] we notice the conservation of a tryptophan residue in strand B; in addition, a tyrosine residue strongly conserved in strand E of the FNIII modules and in strand F of the Ig modules is well aligned between the four PC1 sequences and the FNIII modules of strand E. The alignment of this region of the PC1 sequences and the Ig modules in strand F is more fuzzy (Figure 2A). On the basis of all these observations, we can conclude that the four sequences from the REJ module are closer in evolution to FNIII modules rather than to Ig modules.
Protein Expression
A range of Expression constructs were designed for the four predicted FNIII domains (Fig. 1) as shown in Fig. 2 to cover the core domains plus parts of the linker sequences because of uncertainty about the precise location of N- and C-terminus. A Selection of constructs and expression results is summarised in Table 1. Essentially, all constructs expressed in inclusion bodies at 37 °C in BL21* which could not be improved by reducing the IPTG concentration at induction from 0.75 mM to 0.1 mM and lowering the induction temperature to 20 and 15 °C. Soluble protein for domains 1 and 2 was obtained by expression of the constructs in ArcticExpress cells (Stratagene) [23] at 13 °C, albeit with a low yield so that refolding of purified inclusion bodies was attempted to increase the yield. Initial efforts using classical stepwise dialysis or rapid and slow dilution protocols were unsuccessful. A modified protocol was then evaluated based on the use of an amphiphilic polymer called Nvoy (Expedeon). Successful refolding of domains 1 and 2 was achieved using a rapid refolding protocol in the presence of 5 mg/mL Nvoy polymer per 1 mg/mL of protein as shown in Fig. 3B. Soluble protein samples generated in this way could be concentrated in Vivaspin concentrators and dialysed against measurement buffer without precipitation or any other loss of protein. The only problem arose when treatment with TEV protease caused the precipitation of the protein.
Table 1.
FNIII domain constructs used in this work as shown in Fig. 3A and the results of their bacterial expression. Note that for constructs that did not express as soluble protein the protein yield refers to soluble protein obtained after Nvoy assisted refolding. Column headings: D: Domain; Start/End: position of first and last residue in full length human polycystin 1; Size: number of amino acids of polycystin 1 in the construct; MW: molecular weight in kD; ε: molar extinction coefficient in M−1 cm−1; Host: bacterial expression host ArcticExpress (AE) or BL21* (Star); Soluble: is the protein expressed soluble?; Yield: amount of purified, soluble protein in mg from 1L LB culture; Solubility: rough qualitative estimate of protein solubility after purification.
| D | Start | End | Size | MW | ε | Host | Soluble | Yield | Solubility | Comments |
|---|---|---|---|---|---|---|---|---|---|---|
| D1 | 2152 | 2262 | 111 | 12.6 | 12950 | Star | NO | 50 | Modest | - |
| D1 | 2152 | 2262 | 111 | 12.6 | 12950 | AE | YES | 1 | Modest | soluble aggregates |
| D1 | 2155 | 2254 | 100 | 11.4 | 12950 | Star | NO | 15 | Poor | - |
| D1 | 2155 | 2254 | 100 | 11.4 | 12950 | AE | NO | - | - | - |
| D2 | 2257 | 2369 | 113 | 12.3 | 20970 | Star | NO | 50 | Good | - |
| D2 | 2257 | 2369 | 113 | 12.3 | 20970 | AE | YES | 2 | Good | - |
| D2 | 2257 | 2374 | 118 | 12.9 | 20970 | Star | NO | 45 | Modest | - |
| D2 | 2257 | 2374 | 118 | 12.9 | 20970 | AE | YES | 1 | Modest | precipitated after short time |
| D2 | 2282 | 2361 | 80 | 8.8 | 13980 | Star | NO | ~2 | Very poor | - |
| D2 | 2282 | 2361 | 80 | 8.8 | 13980 | AE | NO | - | - | - |
| D3 | 2371 | 2474 | 104 | 11.2 | 11460 | Star | NO | 20 | Modest | degradation |
| D3 | 2374 | 2474 | 101 | 10.9 | 11460 | Star | NO | 30 | Modest | degradation |
| D3 | 2374 | 2474 | 101 | 10.9 | 11460 | AE | NO | - | - | - |
| D3 | 2392 | 2463 | 76 | 8.2 | 6990 | Star | NO | 10 | Poor | degradation |
| D4 | 2468 | 2577 | 110 | 11.8 | 9970 | Star | NO | - | - | Very poor expression |
| D4 | 2477 | 2577 | 101 | 10.9 | 9970 | Star | NO | - | - | Very poor expression |
| D4 | 2477 | 2577 | 101 | 10.9 | 9970 | AE | NO | - | - | Very poor expression |
| D4 | 2485 | 2573 | 93 | 10 | 9970 | Star | NO | - | - | Very poor expression |
For comparison soluble domains 1 and 2 were produced. Treatment with TEV protease did not cause any problems and purification, including polishing on a preparative S75 gel filtration column was successful for domain 2. Domain 1, however, could not be further purified using gelfiltration (Fig. 3C). Whereas domain 2 appears at an elution volume of the preparative column corresponding to a protein with a molecular weight between 10–20 kD domain 1 appears close to the exclusion volume. This suggests an apparent molecular weight greater than 75 kD corresponding to a soluble aggregate of at least six molecules. As a result, we used refolded domain 1 and 2 as well as solubly expressed domain 2 for all the biophysical experiments.
CD spectroscopy
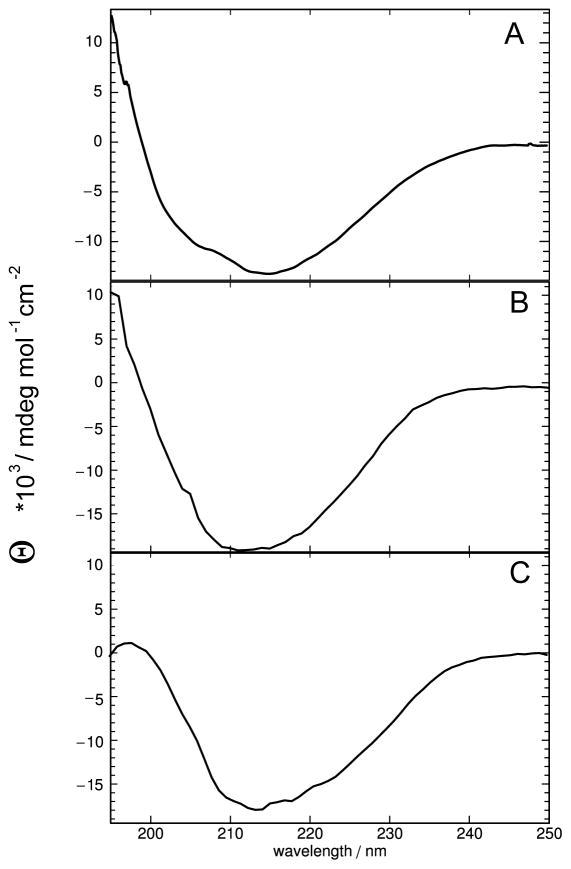
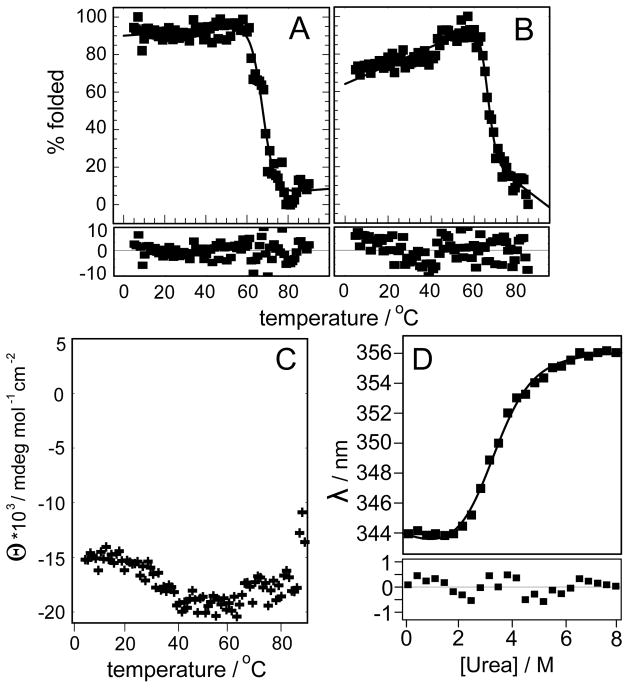
CD spectra for domains D1 and D2 show the typical appearance of β-sheet proteins with a broad minimum between 210 and 220nm (Fig. 4) regardless of the method of production. Using a home written Mathematica macro the secondary structure content of the domains according to these spectra was estimated to be around 62% β-sheet, 7% α-helix and 31%, virtually identical for refolded and natively expressed domains. Both domains are thus assembled predominantly of β-sheet structure. CD spectroscopy was also used to measure the melting temperature by monitoring the CD signal at 214 nm over a range of temperatures from 5 to 90 °C. The melting curves of both refolded domains show little change from 5 to about 55 °C from where the percentage of folded protein dropped within a short temperature interval from ~80–90% to less than 20%. The measured data were fitted to a two state unfolding equilibrium using Mathematica leading to melting temperatures of around 66 °C for both without any indication of significant deviation from the simple two state model (see error panels, bottom part of Fig. 5). Interestingly, the natively expressed domain 2 showed hardly any sign of unfolding up to 90 °C. On the contrary, the intensity of the CD signal even increased from 20 to 40 °C. As a result a fit was not possible (Fig. 5C). As an alternative chemical denaturation with urea was performed using tryptophan fluorescence as a readout. Ablueshift of about 12 nm from the lowest to the highest urea concentration was observed. This allowed the determination of the free energy of unfolding as 3.2 kcal/mol and the half maximum urea concentration as 4.4 M.
Figure 4.
CD spectroscopy of predicted FNIII domains. A: domain REJ-1 (residues 2152–2262), refolded in NV10. B: domain REJ-2 (residues 2257–2374), refolded in NV10. C: domain REJ-2 (2257–2369) expressed as soluble protein. All spectra were recorded at 5 °C.
Figure 5.
Stability of refolded and natively expressed FNIII domains. A: thermal denaturation from 5 to 90 °C monitored by measuring the CD signal at 215nm of domain 1, refolded in NV10. B: same as A for domain 2, refolded in NV10. C: same as for B but with domain 2 expressed as soluble protein. Note that in this case fitting was not possible because the curve did not have the expected shape for a denaturation. As a result, the y-axis is shown as molar ellipticity, not % folded. D: urea denaturation curve of natively expressed domain 2. Experimental data are shown in the top panel as black filled squares. A curve calculated using the fitting parameters is shown as a continuous line in the upper panel where fitting was possible. Fitting errors for each experimental point are shown in the lower panel.
Oligomeric state of domain 2
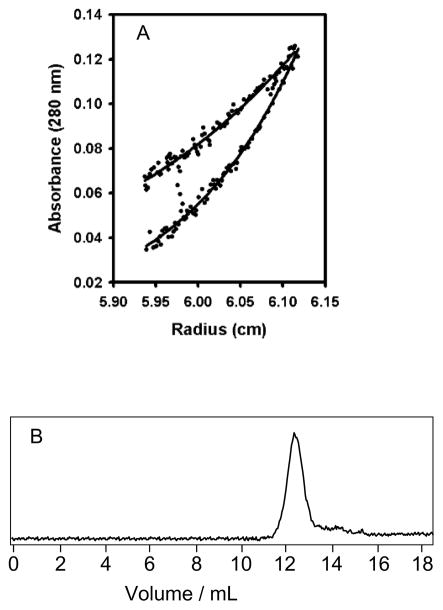
Sedimentation equilibrium measurements at two velocities (Fig. 6A) determined the molecular weight of refolded domain D2 in solution to be 15.2 kDa with a 68 % confidence limit of 11.8–17.2 kDa. This is close to the calculated value of 15.7 kD for a monomer with the his-tag attached. Other more complex models such as monomer/dimer equilibrium did not improve the fit, and therefore D2 was judged to be monomeric under the conditions of the standard measurement buffer. AUC analysis of domain D1 under identical conditions did not lead to interpretable results suggesting the presence of several species, presumably because of aggregation. The monomeric state of domain 2 was further supported by analytical gel filtration of natively expressed protein after removal of the his-tag (Fig. 6B). An elution at 12.6 mL corresponds to an apparent molecular weight of 14 kD.
Figure 6.
Oligomeric state of REJ domain 2. A: Sedimentation equilibrium AUC results at 18 000 rpm (upper trace) and 25 000 rpm (lower trace) of refolded protein in NV10. For clarity only one loading concentration has been shown. The determined molecular weight was 15.2 KDa, close to the expected monomeric weight of 15.7 KDa. Fits were determined globally using 6 data sets using the program SEDPHAT [26]. B: Analytical gel filtration of domain 2 expressed in the soluble showing one peak at 12.6 mL which corresponds to a molecular weight of 15 kD.
NMR spectroscopy
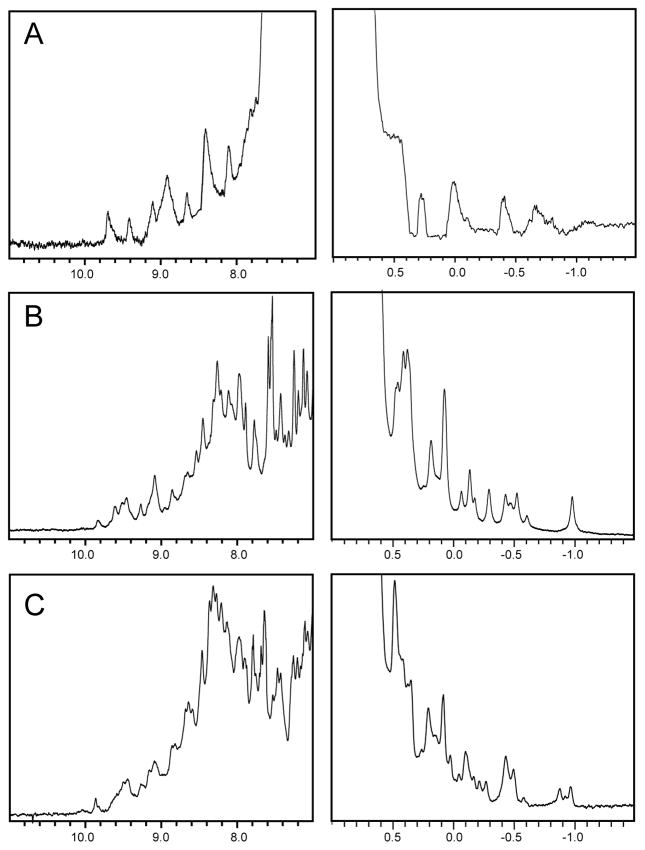
1D spectra were recorded at room temperature for refolded domains D1 (Fig. 7A) and D2 (Fig. 7B) and solubly expressed domain D2 (Fig. 7C). Only the extreme high field and low field shifted regions are shown. The spectrum of domain D1 shows a few peaks around 0 ppm in the high field region and a good spread of peaks in the low field region. The peaks are relatively broad for a protein with a molecular weight under 20 kD and suggests that the protein is folded but might aggregate. The spectra of both versions of domain D2 are of excellent quality. In the high field region the peaks are very sharp and very widely spread out up to −1.0 ppm. Similarly in the low field region a large number of well dispersed sharp peaks is seen. The large number of amide peaks is especially interesting given that the spectrum was recorded at a relatively high pH value of 7.5.
Figure 7.
1D NMR spectra of domains 1 and 2. A: 1D 1H spectrum of refolded domain 1. B: 1D 1H spectrum of refolded domain 2. C: 1D 1H spectrum of soluble expressed domain 2. For all three only the low- and highfield portions of the spectra are shown. Spectra were recorded with samples at a concentration of 100 μM at 800 MHz in measurement buffer at 25 °C.
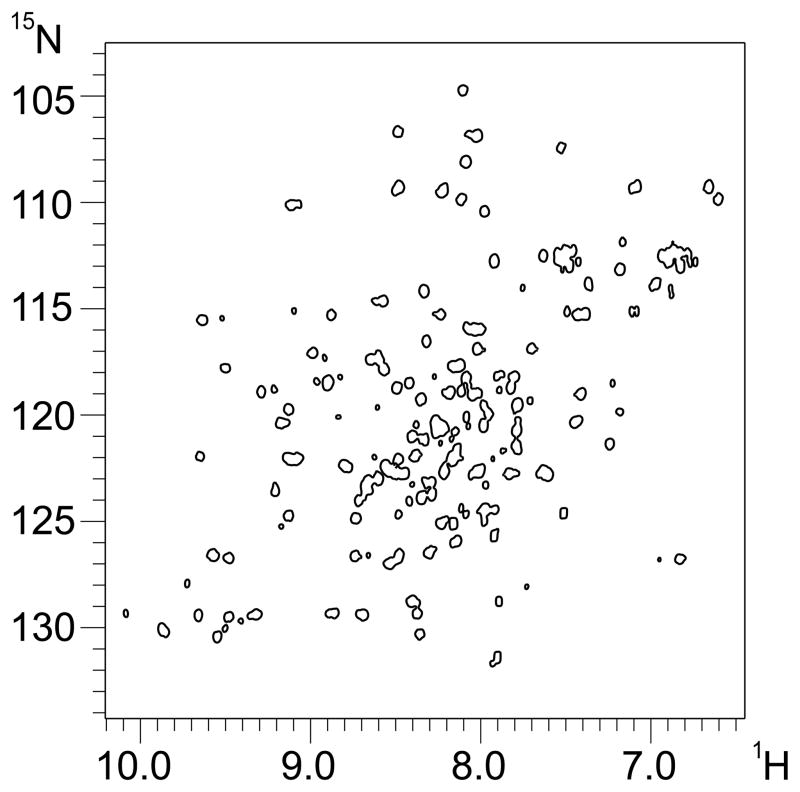
The excellent quality of the 1D spectrum of domain 2 suggested that this domain might be best suited for the determination of the 3D structure. To explore this further a 15N labelled sample was produced to record a 2D 1H-15N HSQC experiment (Fig. 8). This 2D spectrum is of equally excellent quality in line with the 1D spectra. Its appearance shows the extensive dispersion of cross peaks spreading them across most of the available space which is typical of proteins consisting mainly of β-sheet secondary structure. Automatic peak picking in CCPN analysis [32] gives a total of 116 peaks, excluding side chains, which is very close to the 121 peaks expected for domain D2 after removing the his-tag.
Figure 8.
2D 1H-15N HSQC experiment of soluble domain 2 recorded under conditions identical to those for the 1D spectra.
Discussion
The presence of FNIII type domains in the extracellular part of PC1 was predicted when the sequence of the protein was presented for the first time [17]. Soon after, however, this interpretation was discounted because no strong signal evidence of a typical FNIII-related pattern was found in their analysis, and others opted in favour of classifying the entire region as the REJ-module [6]. Since then, all analysis of functional features of PC1 has been based on this blueprint of PC1 (see Fig. 1). A re-examination of the concept of the REJ module was prompted to us by the observation that AFM unfolding of extracellular fragments of PC1 comprising the REJ-domain produced a number of unfolding peaks which disagrees with the idea that the REJ module is a single, cooperatively folded domain [18]. This result strongly suggested the presence of smaller domains such as the originally predicted FNIII domains.
A significant number of new FNIII structures have been added to the database since the earliest analysis, so that it was decided to first repeat the sequence analysis using a new sequence profile of the FNIII fold (Fig. 2A). This was then compared to an alignment of the putative FNIII domains in PC1 against a profile for the Ig fold (Fig. 2B). The β-strands in the FNIII profile are matched very well by the sequences of the putative FNIII domains in PC1. The only difference is seen for domain 3 in strand C. However, in two domains of the profile the C-strand is also absent in the alignment, suggesting that this is probably not contributing as a strong signature for the FNIII fold. In contrast, in the alignment with the Ig profile (Fig. 2B), domain 1 completely misses the C-strand, which is a core feature of the Ig fold, constantly present in all sequences in the profile. It is also notable that the normally fairly uniform and conserved EF-loop is completely absent in domain 4 and significantly shortened in domains 2 and 3. As a result, the sequences of the putative domains agree better with the sequence profile of the FNIII than with the Ig fold.
Constructs of at least domains 1 and 2 expressed in high yields (> 50 mg / 1L LB) in bacteria, albeit in inclusion bodies. Significantly lower yields were obtained for some of these constructs by expression at low temperature in specialised bacterial cells (1–2 mg / 1L LB) Because of the high yields in the inclusion body expression refolding was performed, apparently successfully, using a new dilution protocol incorporating a synthetic amphiphilic polymer, Nvoy. For domains 1 and 2 the refolding procedure worked extremely well and soluble protein samples could be produced. Promising biophysical data was obtained that clearly showed the refolded domains to adopt a cooperatively folded structure with a high degree of β-sheet (~60%) (Fig. 4), and a good level of stability as evidenced by the CD melting curves (Fig. 5) in good agreement with expectations for fnIII domains [33,34]. At least domain 2 showed a well defined monomeric state by AUC (Fig. 6A) and very promising NMR spectra (Fig. 7). However, the inability to remove the his-tag without severely compromising the solubility of the domain suggested that the refolded domains were possibly not quite correctly folded. This is supported by the very different melting curve of natively expressed domain 2 (Fig. 4). The CD melting curve is very different and unfolding appears to start only around 90 °C. This is more than 20 °C higher than observed for the refolded domain. Denaturation by urea clearly shows that this protein can be unfolded, that it happens in a cooperative manner and that it is indeed very stable, in good agreement with the failure to melt below 90 °C (Fig. 5). Also a comparison of the NMR spectra suggests small but potentially significant differences in the way the protein folds when it is refolded or when it folds in cells. The overall peak pattern is very similar but a close inspection reveals numerous variations such as the area around −1 ppm where the native protein has two peaks while the refolded protein has only one. These differences cannot be explained by the different lengths of the constructs or by the absence or presence of the his-tag. The low- and highfield ends of the 1D NMR spectrum are dominated by resonances deeply buried in the hydrophobic core which is normally unaffected by changes at the N- or C-terminus. Combining these observations it has to be concluded that even though refolding appears to occur it is not sufficient to produce a correctly folded protein. It is therefore necessary to use the low yield, low temperature expression route to obtain a protein that has the correct structure.
The results for the natively expressed domain 2 are in good agreement with the predicted presence of FNIII domains: it is monomeric as evidenced by analytical gel filtration as well as the good quality of the NMR spectra. The construct has a high β-sheet content, unfolds in a cooperative manner, is highly stable and produces an excellent 2D 15N HSQC spectrum. The large number of high-field shifted peaks is slightly unusual for such a small domain but can nevertheless be explained by the number of aromatic residues above the average (four Phe, four Tyr, three Trp; seven of these align with conserved hydrophobic positions of the FNIII fold in Fig. 2).
It is quite intriguing to note that the other three predicted domains that “misbehaved” appeared to do so independently of the way in which they were produced. In the case of domain 1 the refolded protein showed AUC data difficult to interpret and broad lines in the 1D NMR spectrum suggesting at least partial aggregation, a tendency which was observed also for solubly expressed protein on the gelfiltration column (Fig. 3). Domain D3 expressed reasonably well in inclusion bodies but was extremely unstable after refolding. The expression of domain D4 was so poor, even in inclusion bodies, that no effort was made to refold and investigate it further. The behaviour of these two domains does not appear to be caused by expression in bacteria because exactly the same pattern was observed in insect cells/baculovirus: domain D3 degraded quickly and domain D4 was hardly expressed at all (A. Oberhauser & F. Qian, personal communication). These properties are thus inherent to these domains, so that further investigation would prove very challenging. The difficulty in producing these domains is not unusual for extracellular proteins and has been observed for a number of other domains and proteins [30,35].
In conclusion, we have provided extensive experimental evidence for the existence of at least two of the four predicted FNIII domains within the REJ-module of PC1, suggesting that in this case it is not a single domain. We suggest avoiding the use of domain in this context and strictly refer to the REJ segment as a module. Further analysis of the remainder of the ~600 amino acids in this part of PC1 might yield yet further domains, therefore this work should only be seen as the start of a re-evaluation of the domain architecture of PC1. Given the high sequence similarity that led to the creation of the term REJ-domain it is entirely conceivable that the domain organisation of this region in PC1 might indeed be very similar in all REJ-module containing proteins. The combination of the domains making up the REJ-module is thus expected to be the same for all the proteins in the REJ family. A precise understanding of the nature of the domains and their three-dimensional structure will facilitate the further investigation of these proteins to find out, e.g. why part of this module is required for autoproteolysis in the GPS domain and how point mutations in the REJ-module (Fig. 1) related to ADPKD interfere with this activity [15]. With the intent of improving our fundamental understanding of the relationship of sequence and structure in proteins, work like this will also significantly contribute to the understanding of molecular mechanisms of inherited diseases.
Acknowledgments
This work was supported by a project grant to MP and FF from Kidney Research UK (RP2/2/2006), NIH grant DK 062199 to FQ and by the John Hopkins Polycystic Kidney Disease (PKD) Research and Clinical Core Center, NIH P30 DK090868. The authors wish to thank X. Yang and K. Hackmann for help with high throughput cloning, Jennifer Moss for experiments with early constructs, F. Muskett for help with NMR experiments and K. Sidhu for computer support.
Abbreviations
- CD
circular dichroism spectroscopy
- NMR
nuclear magnetic resonance spectroscopy
- HSQC
heteronuclear single quantum coherence
- ADPKD
autosomal dominant polycystic kidney disease
- FNIII
fibronectin type III
- Ig
immunoglobulin
References
- 1.Bork P, Bairoch A. Extracellular protein modules: A proposed nomenclature. Trends Biochem Sci. 1995;20:02. [Google Scholar]
- 2.Bork P, Downing KA, Kieffer B, Campbell ID. Structure and distribution of modules in extracellular proteins. Q Rev Biophys. 1996;29:119–167. doi: 10.1017/s0033583500005783. [DOI] [PubMed] [Google Scholar]
- 3.Pfuhl M, Improta S, Politou AS, Pastore A. When a module is also a domain: The importance of the N-terminus in the dynamics and the stability of immunoglobulin domains from titin. J Mol Biol. 1997;265:242–256. doi: 10.1006/jmbi.1996.0725. [DOI] [PubMed] [Google Scholar]
- 4.Castiglione Morelli MA, Stier G, Gibson T, Joseph C, Musco G, Pastore A, Travé G. The KH module has an alpha beta fold. FEBS Lett. 1995;358:193–198. doi: 10.1016/0014-5793(94)01422-w. [DOI] [PubMed] [Google Scholar]
- 5.Shin OH, Lu J, Rhee JS, Tomchick DR, Pang ZP, Wojcik SM, Camacho-Perez M, Brose N, Machius M, Rizo J, Rosenmund C, Sudhof TC. Munc13 C(2)B domain is an activity-dependent ca(2+) regulator of synaptic exocytosis. Nat Struct Mol Biol. 2010;17:280–288. doi: 10.1038/nsmb.1758. [DOI] [PMC free article] [PubMed] [Google Scholar]
- 6.Moy GW, Mendoza LM, Schulz JR, Swanson WJ, Glabe CG, Vacquier VD. The sea urchin sperm receptor for egg jelly is a modular protein with extensive homology to the human polycystic kidney disease protein, PKD1. J Cell Biol. 1996;133:809–817. doi: 10.1083/jcb.133.4.809. [DOI] [PMC free article] [PubMed] [Google Scholar]
- 7.Gunaratne HJ, Moy GW, Kinukawa M, Miyata S, Mah SA, Vacquier VD. The 10 sea urchin receptor for egg jelly proteins (SpREJ) are members of the polycystic kidney disease-1 (PKD1) family. BMC Genomics. 2007;8:235. doi: 10.1186/1471-2164-8-235. [DOI] [PMC free article] [PubMed] [Google Scholar]
- 8.Putnam NH, Butts T, Ferrier DE, Furlong RF, Hellsten U, Kawashima T, Robinson-Rechavi M, Shoguchi E, Terry A, Yu JK, Benito-Gutierrez EL, Dubchak I, Garcia-Fernandez J, Gibson-Brown JJ, Grigoriev IV, Horton AC, de Jong PJ, Jurka J, Kapitonov VV, Kohara Y, Kuroki Y, Lindquist E, Lucas S, Osoegawa K, Pennacchio LA, Salamov AA, Satou Y, Sauka-Spengler T, Schmutz J, Shin-I T, Toyoda A, Bronner-Fraser M, Fujiyama A, Holland LZ, Holland PW, Satoh N, Rokhsar DS. The amphioxus genome and the evolution of the chordate karyotype. Nature. 2008;453:1064–1071. doi: 10.1038/nature06967. [DOI] [PubMed] [Google Scholar]
- 9.Grantham JJ. Clinical practice, autosomal dominant polycystic kidney disease. N Engl J Med. 2008;359:1477–1485. doi: 10.1056/NEJMcp0804458. [DOI] [PubMed] [Google Scholar]
- 10.Li A, Tian X, Sung SW, Somlo S. Identification of two novel polycystic kidney disease-1-like genes in human and mouse genomes. Genomics. 2003;81:596–608. doi: 10.1016/s0888-7543(03)00048-x. [DOI] [PubMed] [Google Scholar]
- 11.Yu S, Hackmann K, Gao J, He X, Piontek K, Gonzalez MA, Menezes LF, Xu H, Germino GG, Zuo J, Qian F. Essential role of cleavage of polycystin-1 at G protein-coupled receptor proteolytic site for kidney tubular structure. Proc Natl Acad Sci U S A. 2007 doi: 10.1073/pnas.0708217104. [DOI] [PMC free article] [PubMed] [Google Scholar]
- 12.Boletta A, Qian F, Onuchic LF, Bragonzi A, Cortese M, Deen PM, Courtoy PJ, Soria MR, Devuyst O, Monaco L, Germino GG. Biochemical characterization of bona fide polycystin-1 in vitro and in vivo. Am J Kidney Dis. 2001;38:1421–1429. doi: 10.1053/ajkd.2001.29282. [DOI] [PubMed] [Google Scholar]
- 13.Newby LJ, Streets AJ, Zhao Y, Harris PC, Ward CJ, Ong AC. Identification, characterization, and localization of a novel kidney polycystin-1-polycystin-2 complex. J Biol Chem. 2002;277:20763–20773. doi: 10.1074/jbc.M107788200. [DOI] [PubMed] [Google Scholar]
- 14.Wei W, Hackmann K, Xu H, Germino G, Qian F. Characterization of cis-autoproteolysis of polycystin-1, the product of human polycystic kidney disease 1 gene. J Biol Chem. 2007;282:21729–21737. doi: 10.1074/jbc.M703218200. [DOI] [PubMed] [Google Scholar]
- 15.Qian F, Boletta A, Bhunia AK, Xu H, Liu L, Ahrabi AK, Watnick TJ, Zhou F, Germino GG. Cleavage of polycystin-1 requires the receptor for egg jelly domain and is disrupted by human autosomal dominant polycystic kidney disease 1 associated mutations. Proc Nat Acad Sci USA. 2002;99:16981–16986. doi: 10.1073/pnas.252484899. [DOI] [PMC free article] [PubMed] [Google Scholar]
- 16.Garcia-Gonzalez MA, Jones JG, Allen SK, Palatucci CM, Batish SD, Seltzer WK, Lan Z, Allen E, Qian F, Lens XM, Pei Y, Germino GG, Watnick TJ. Evaluating the clinical utility of a molecular genetic test for polycystic kidney disease. Mol Genet Metab. 2007;92:160–167. doi: 10.1016/j.ymgme.2007.05.004. [DOI] [PMC free article] [PubMed] [Google Scholar]
- 17.Hughes J, Ward CJ, Peral B, Aspinwall R, Clark K, San Millan JL, Gamble V, Harris PC. The polycystic kidney disease 1 (PKD1) gene encodes a novel protein with multiple cell recognition domains. Nat Genet. 1995;10:151–160. doi: 10.1038/ng0695-151. [DOI] [PubMed] [Google Scholar]
- 18.Qian F, Wei W, Germino G, Oberhauser A. The nanomechanics of polycystin-1 extracellular region. J Biol Chem. 2005;280:40723–40730. doi: 10.1074/jbc.M509650200. [DOI] [PMC free article] [PubMed] [Google Scholar]
- 19.Bairoch A, Boeckmann B, Ferro S, Gasteiger E. Swiss-prot: Juggling between evolution and stability. Brief Bioinform. 2004;5:39–55. doi: 10.1093/bib/5.1.39. [DOI] [PubMed] [Google Scholar]
- 20.Lupyan D, Leo-Macias A, Ortiz AR. A new progressive-iterative algorithm for multiple structure alignment. Bioinformatics. 2005;21:3255–3263. doi: 10.1093/bioinformatics/bti527. [DOI] [PubMed] [Google Scholar]
- 21.Eddy SR. Profile hidden markov models. Bioinformatics. 1998;14:755–763. doi: 10.1093/bioinformatics/14.9.755. [DOI] [PubMed] [Google Scholar]
- 22.Haun RS, Serventi IM, Moss J. Rapid, reliable ligation-independent cloning of PCR products using modified plasmid vectors. BioTechniques. 1992;13:515–518. [PubMed] [Google Scholar]
- 23.Hartinger D, Heinl S, Schwartz HE, Grabherr R, Schatzmayr G, Haltrich D, Moll WD. Enhancement of solubility in escherichia coli and purification of an aminotransferase from sphingopyxis sp. MTA144 for deamination of hydrolyzed fumonisin B(1) Microb Cell Fact. 2010;9:62. doi: 10.1186/1475-2859-9-62. [DOI] [PMC free article] [PubMed] [Google Scholar]
- 24.Laue TM, Shah BD, Ridgeway TM, Pelletier SL. Computer-aided interpretation of analytical sedimentation data for proteins. In: Harding SE, Rowe AJ, Horton JC, editors. Ultracentrifugation in Biochemistry and Polymer Science. Royal Society of Chemistry; Cambridge: 1992. pp. 90–125. [Google Scholar]
- 25.Schuck P. Size-distribution analysis of macromolecules by sedimentation velocity ultracentrifugation and lamm equation modeling. Biophys J. 2000;78:1606–1619. doi: 10.1016/S0006-3495(00)76713-0. [DOI] [PMC free article] [PubMed] [Google Scholar]
- 26.Brown PH, Schuck P. Macromolecular size-and-shape distributions by sedimentation velocity analytical ultracentrifugation. Biophys J. 2006;90:4651–4661. doi: 10.1529/biophysj.106.081372. [DOI] [PMC free article] [PubMed] [Google Scholar]
- 27.Bateman A, Sandford R. The PLAT domain: A new piece in the PKD1 puzzle. Curr Biol. 1999;9:R588–90. doi: 10.1016/s0960-9822(99)80380-7. [DOI] [PubMed] [Google Scholar]
- 28.Ponting CP, Hofmann K, Bork P. A latrophilin/CL-1-like GPS domain in polycystin-1. Curr Biol. 1999;9:R585–8. doi: 10.1016/s0960-9822(99)80379-0. [DOI] [PubMed] [Google Scholar]
- 29.Bork P, Holm L, Sander C. The immunoglobulin fold: Structural classification, sequence patterns and common core. J Mol Biol. 1994;242:309–320. doi: 10.1006/jmbi.1994.1582. [DOI] [PubMed] [Google Scholar]
- 30.Main AL, Harvey TS, Baron M, Boyd J, Campbell ID. The three-dimensional structure of the tenth type III module of fibronectin: An insight into RGD-mediated interactions. Cell. 1992;71:671–678. doi: 10.1016/0092-8674(92)90600-h. [DOI] [PubMed] [Google Scholar]
- 31.Halaby DM, Poupon A, Mornon J. The immunoglobulin fold family: Sequence analysis of 3D structure comparison. Protein Eng. 1999;12:563–571. doi: 10.1093/protein/12.7.563. [DOI] [PubMed] [Google Scholar]
- 32.Vranken WF, Boucher W, Stevens TJ, Fogh RH, Pajon A, Llinas M, Ulrich EL, Markley JL, Ionides J, Laue ED. The CCPN data model for NMR spectroscopy: Development of a software pipeline. Proteins. 2005;59:687–696. doi: 10.1002/prot.20449. [DOI] [PubMed] [Google Scholar]
- 33.Hamill SJ, Meekhof AE, Clarke J. The effect of boundary selection on the stability and folding of the third fibronectin type III domain from human tenascin. Biochemistry. 1998;37:8071–8079. doi: 10.1021/bi9801659. [DOI] [PubMed] [Google Scholar]
- 34.Oberhauser AF, Badilla-Fernandez C, Carrion-Vazquez M, Fernandez JM. The mechanical hierarchies of fibronectin observed with single-molecule AFM. J Mol Biol. 2002;319:433–447. doi: 10.1016/S0022-2836(02)00306-6. [DOI] [PubMed] [Google Scholar]
- 35.Penkett CJ, Dobson CM, Smith LJ, Bright JR, Pickford AR, Campbell ID, Potts JR. Identification of residues involved in the interaction of staphylococcus aureus fibronectin-binding protein with the (4)F1(5)F1 module pair of human fibronectin using heteronuclear NMR spectroscopy. Biochemistry. 2000;39:2887–2893. doi: 10.1021/bi992267k. [DOI] [PubMed] [Google Scholar]


