Abstract
Osteopontin (OPN) expression is increased in kidneys of rats with ethylene glycol (EG) induced hyperoxaluria and calcium oxalate (CaOx) nephrolithiasis. The aim of this study is to clarify the effect of OPN knockdown by in vivo transfection of OPN siRNA on deposition of CaOx crystals in the kidneys. Hyperoxaluria was induced in 6-week-old male Sprague–Dawley rats by administering 1.5 % EG in drinking water for 2 weeks. Four groups of six rats each were studied: Group A, untreated animals (tap water); Group B, administering 1.5 % EG; Group C, 1.5 % EG with in vivo transfection of OPN siRNA; Group D, 1.5 % EG with in vivo transfection of negative control siRNA. OPN siRNA transfections were performed on day 1 and 8 by renal sub-capsular injection. Rats were killed at day 15 and kidneys were removed. Extent of crystal deposition was determined by measuring renal calcium concentrations and counting renal crystal deposits. OPN siRNA transfection resulted in significant reduction in expression of OPN mRNA as well as protein in group C compared to group B. Reduction in OPN expression was associated with significant decrease in crystal deposition in group C compared to group B. Specific suppression of OPN mRNA expression in kidneys of hyperoxaluric rats leads to a decrease in OPN production and simultaneously inhibits renal crystal deposition.
Keywords: Osteopontin, Calcium oxalate, Nephrolithiasis, siRNA, Transfection, Knockdown
Introduction
Osteopontin (OPN) is widely expressed in vivo and has multiple biological functions based upon structural modifications and the local environments in which it is expressed [1]. OPN is a major matrix constituent of calcium-containing renal calculi as well as Randall’s plaques [2, 3]. It is involved in the modulation of nucleation, growth, aggregation of calcium oxalate (CaOx) crystals and is implicated in crystal retention within the kidneys by affecting the adherence of CaOx crystals to renal epithelial cell [4, 5]. OPN is a specific monocyte chemoattactant for renal interstitium and its production is increased prior to monocyte infiltration [6] and development of inflammation. Many crystallization modulators, whose production is increased by the exposure to CaOx crystals, are also participants in the inflammatory and repair process [7].
Experimental induction of hyperoxaluria by the administration of ethylene glycol or hydroxyl-l-proline to male rats leads to calcium oxalate (CaOx) crystal formation and deposition in their kidneys [8, 9]. The expression of OPN, which in normal kidneys is restricted to small number of cells in the thin limbs of the loop of Henle and papillary surface epithelium, is significantly increased and seen in the renal epithelial cells and interstitium [10, 11]. Urinary excretion of OPN is also increased. Based on cDNA microarray carrying 4,224 cDNA clones derived from a rat kidney normalized cDNA library, large-scale analyses of gene expression in kidneys of hyperoxaluric rats, 173 differentially regulated genes were identified. The expression of genes participating in inflammatory responses was markedly enhanced with OPN being the most upregulated gene [11]. In this study, we investigated the effect of OPN knockdown by transfection of siRNA on CaOx crystal deposition in the kidneys of hyperoxaluric rats.
Materials and methods
Cell culture
A normal rat kidney epithelial cell line, NRK52E, was obtained from American Type Culture Collection (CTL-1571; Manassas, VA, USA). They were maintained as continuously growing monolayers (confluent condition) in 75 cm2 Falcon T-flask (Fisher, Atlanta, GA, USA) in culture in 1:1 ratio Dulbecco’s modified essential medium nutrient mixture and F-12 (DMEM/F-12, Gibco BRL, Grand Island, NY, USA) containing 4 % fetal calf serum, 15 mmol/L HEPES, 20 mmol/L sodium bicarbonate, 0.5 mmol/L sodium pyruvate, 17.5 mmol/L glucose, streptomycin and penicillin at 37 °C in a 5 % CO2 air atmosphere incubator. Under these conditions, cells achieved confluence, they were washed with serum and sodium pyruvate-free DMEM/F-12 media and incubated for 24 h, and then exposed to potassium oxalate (Sigma, St. Louis, USA) at a final concentration of 500 µmol/L or CaOx monohydrate (COM; 66.7 µg/cm2) Control cultures were untreated cells. The duration of cell exposure and concentration of COM crystals to which they were exposed was selected based on the results of our earlier studies [12].
The sequence of OPN siRNA and transfection to NRK52E cells
The expression of OPN mRNA was preliminarily silenced with several designed siRNA at confluent culture of NRK52E cells exposed to calcium oxalate monohydrate (COM) crystals and are increased OPN mRNA expression.
The sequence of the OPN siRNA was designed sense-5′-GUAAGGAAGA UGAUAGG UA-3′ and antisense-5′-UACCUAUCAUCUUCCUUAC-3′. A siPORT™ NeoFX™ Transfection Agent (#AM4510, Ambion) was used as a transfection reagent, according to the manufacturer’s protocol. 2.5 µL NeoFX was added to diluted siRNA and siRNA was reacted to culture cells as each 5 nM, for 48 h. Labeled siRNA can be used to analyze siRNA subcellular localization, stability, and transfection efficiency. NRK52E cells were treated with calcium oxalate monohydrate crystals (COM, 66.7 µg/cm2) for 12 h and OPN mRNA expression was made to be increased. And we investigated if the expression of OPN mRNA was actually knocked down by OPN siRNA transfection. Fluorescence of OPN levels was determined by confocal microscope images (LSM 5 Pascal, Carl Zeiss). Chemiluminescence intensities were calculated by Luzex® detection system (Nireco).
Primers for PCR and quantitative RT-PCR
Primers were designed using Primer Express software (PE Applied Biosystems, Foster City, CA) as following primer pairs: β-actin (accession no. Rn00667869_ml), 5′-TGCCAAGTATGATGACATCAAGAA-3′ and 5′-AGCCCAGGATGCCCTTTAGT-3′; OPN (accession no. Rn00563571_ml). The TaqMan MicroRNA® Cells-to-CT™ Kit (#AM1728, Ambion) was used in case of RT-PCR. PCR product was directly monitored by measuring the increase in fluorescence of dye (Silencer® siRNA Labeling kit, #4400242, Ambion) bound to the amplified double-stranded DNA. The parameter of threshold cycle (CT) was defined as the fractional cycle number at which fluorescence exceeds a threshold level. The comparative CT method quantifies the amount of mRNA relative to that of a reference sample, termed the calibrator, for comparison of the expression level of every unknown sample. For normalizing the relative amount of β-actin mRNA was chosen as an internal reference. The changes in expression are given by unknown samples of interest.
Fluorescence imaging
The delivery of OPN siRNA was investigated in advance between renal cortex injection and sub-capsular injection. The differences in siRNA delivery were observed by fluorescence imaging after 24 h. Atelocollagen (AteroGene™) is an in vivo siRNA transfection kit and used for local administration (#1390, Koken, Japan). Alexa 633-labeled atelocollagen was visualized in fresh kidneys by fluorescence imaging using a custom made macro-imaging station, BioView 1000 (consisting of SBIG cooled CCD camera model ST-7 XME; Santa Barbara Imaging Group Inc., Santa Barbara, CA) mounted onto a dark box and using 530/610 nm excitation/emission filters.
Image analysis
A method for fluorescence signal quantification by computer assisted image analysis has been described elsewhere (De Velasco, 2008 [11]). In brief, image analysis was performed with Image J public domain software available through the National Institutes of Health (Bethesda, MD; available at http://rsb.info.nih.gov/ij/). All images were spatially calibrated for area measurements. Signal strength was recorded as electrons emitted per second of exposure. The area under the curve (AUC) was determined from plot profiles based on fluorescent signal strength and distribution in each individual kidney.
Experimental rat model
All experiments proceeded with the approval of the Animal Care Committee of the Faculty of Medicine, Kinki University School of Medicine. Approved number is KAME-21-001. Hyperoxaluria was induced in 6-week-old male Sprague–Dawley (SD) rats by administering 1.5 % ethylene glycol in drinking water for 2 weeks. Four groups of six rats each were studied: Group A, untreated control animals; Group B, hyperoxaluria induced by EG administration; Group C, hyperoxaluria plus renal sub-capsular injection of OPN siRNA using atelocollagen; Group D, transfected negative control siRNA as Group C. 50 µL (5 nM) OPN siRNA and negative control genes (Silencer Select negative control; #4390843) solutions with AteroGene™ were injected in two additions at sub-capsule of rat kidneys under general anesthesia. After these treatments, oxalate loading was started. OPN siRNA transfections were performed Day 1 and 8. These rats were killed at day 15 and all the kidneys were resected. Experimental details on kidney removal and processing have been previously described [10].
Paraffin-embedded sections (4 µm thick) were stained with hematoxylin. Sections were stained with VEC-TASTAIN ABC kit (Vector Laboratories, Burlingame, CA) according to the manufacturer’s instructions for immunohistochemistry of OPN (×1000 primary antibody: rabbit anti-human OPN polyclonal antibody; IBL, Gunma, Japan). The grade of OPN staining was divided into three steps. We measured all tubular cell stain intensities using image-analyzing software, imageJ for at least three independent fields and evaluated OPN expression levels. The mean value was defined as OPN stain index.
Two different methods were used to determine the extent of crystal deposition in the kidneys. The numbers of crystal deposits were counted in 15 randomly selected fields/kidney at a magnification of 200 and renal calcium concentrations were measured in the whole kidney (mg/g dry kidney tissue) using an atomic absorption spectrophotometer according to manufacturer’s directions.
Reverse transcriptase for real-time PCR
The mRNA levels of β-actin and OPN mRNA in whole kidney were determined using real-time PCR. Total RNA was isolated from kidney using TRIZOL Reagent (Life Technologies BRL, Grand Island, NY) according to the manufacturer’s protocol. Two micrograms of total RNA was reverse-transcribed to cDNA. In brief, 50-µL reactions contained 3 µL of 100 mM MgCl, 1.25 µL of RNase inhibitor, 5 µL of 10× PCR buffer, 10 µL of 10 mM dNTP mix, 1.3 µL of Oligo d(T), and 1.5 µL of reverse transcriptase (all from Life Technologies BRL). This mixture was incubated 60 min at 37 °C, and then reaction mixture was heated to 94 °C for 5 min to stop the reaction.
All PCR reactions were performed using an ABI Prism 7700 Sequence Detection System (PE Applied Biosystems). For each PCR run, a master mix was prepared: 1× SYBR PCR buffer; 3 mM MgCl2; 200 µM dATP, dCTP, and dGTP; 400 µM dUTP; 300 µM primer set for β-actin (accession No. Rn00667869_ml); and 1.25 units of AmpliTaq Gold DNA polymerase. Five milliliters of diluted (1:20) cDNA was added to 45 µL of the PCR master mix. After an initial 10-min denaturation at 95 °C, the thermal cycling comprised 40 cycles of denaturation at 95 °C for 15 s and annealing and extension at 60 °C for 1 min.
Statistical analyses
The data are presented as mean ± SE, and differences between data sets were analyzed by ANOVA test. Pair-X2 test was used to assess OPN expression among the four experimental groups. P values <0.05 were considered statistically significant.
Results
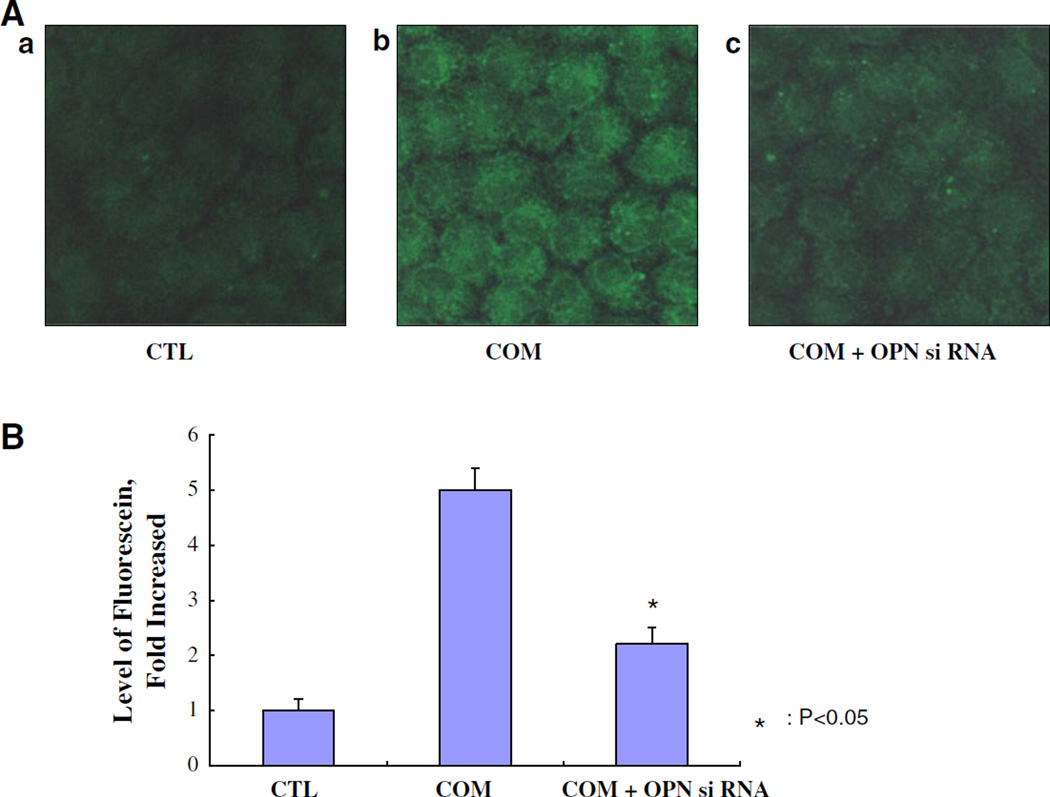
It was confirmed that OPN siRNA was transfected to NRK52E cells using A siPORT™ NeoFX™ Transfection Agent (#AM4510, Ambion) and Silencer siRNA labeling kit (Fig. 1A). This lipid-based formulation of transfection agent can be used to efficiently transfect adherent cells without increased cytotoxicity, as they are sub-cultured. Exposure to COM crystals increased the expression of OPN mRNA by many folds in the renal epithelial cells in culture (Fig. 1B). This increased expression was reduced by approximately 60 % in cells transfected with the OPN siRNA.
Fig. 1.
The transfection of OPN siRNA into NRK52E cells examined using siPORT™ NeoFX™ Transfection Agent. A a Control cells (CTL), b cells treated with calcium oxalate monohydrate (COM) crystals (66.7 µg/cm2) for 48 h, c cells with transfection of OPN siRNA treated with COM crystals. B Fluorescence of OPN levels was determined by confocal microscope images (LSM 5 Pascal, Carl Zeiss). Chemiluminescence intensities were calculated by Luzex® detection system (Nireco). The expression of OPN mRNA was significantly knocked down by OPN siRNA transfection (P < 0.05)
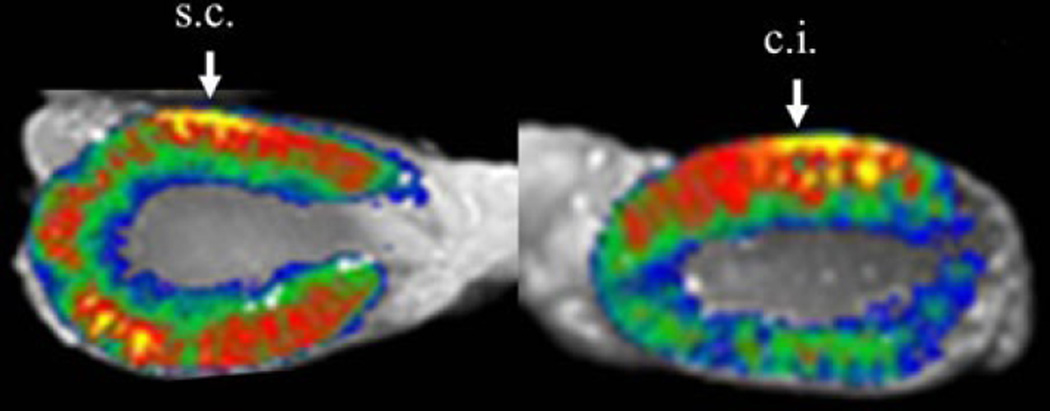
Preliminary studies were performed to investigate the delivery of OPN siRNA via renal cortex injection and sub-capsular injection. Fluorescence imaging of Alexa633-labeled AteroGene™ showed that siRNA injected in the renal cortex remained at the injection site after 24 h of the treatment. Compared to this, atelocollagen injected at the sub-capsular site was visualized in the renal parenchyma far from the injection site (needle; #326666, Becton–Dickinson) (Fig. 2). Based on these results, we transfected OPN siRNA in the sub-capsular region of the kidneys.
Fig. 2.
Fluorescence imaging; Alexa633-labeled atelocollagen (AteroGene™) was revealed between renal cortical injection (c.j.) and renal sub-capsular injection (s.c.) of atelocallagen. Atelocollagen injected in the renal cortex remained at the injection site after 24 h of the treatment, whereas atelocollagen injected at the sub-capsular site was visualized in the renal parenchyma far from the injection site. Image analysis was performed by macro-imaging station, BioView 1000 mounted onto a dark box and using 530/610 nm excitation/emission filters
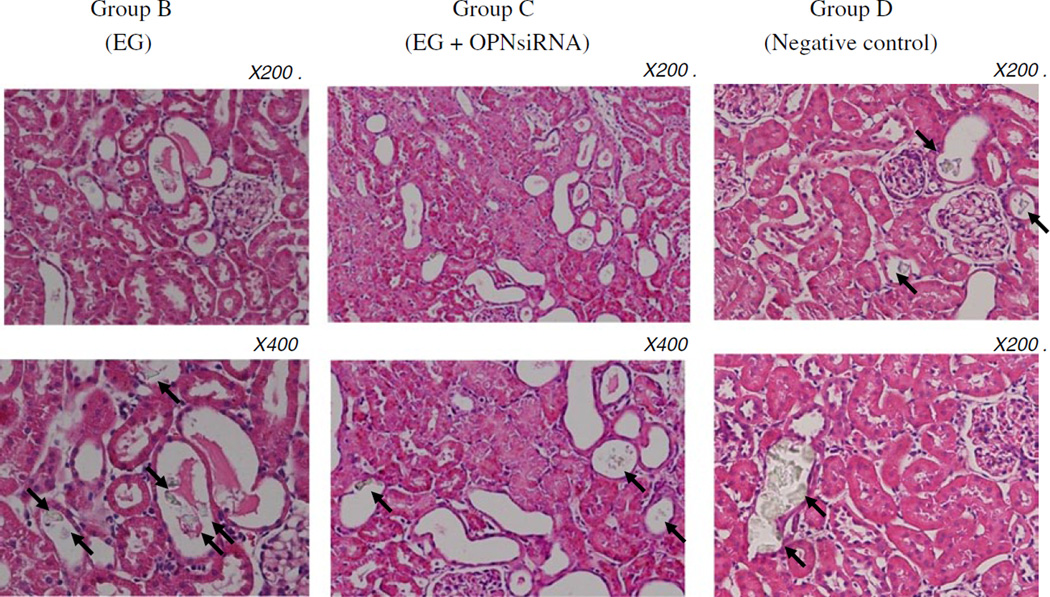
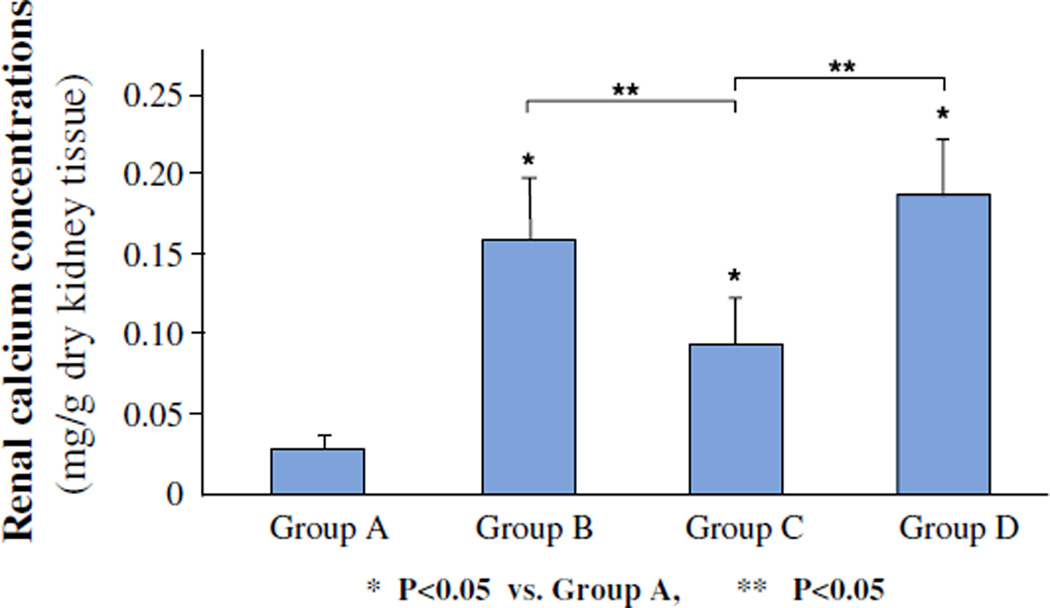
As expected an administration of ethylene glycol led to the deposition of CaOx crystals in the kidneys of rats that received ethylene glycol (Fig. 3). The number of crystal deposits decreased significantly (P < 0.05), from 7.7 ± 2.6 in hyperoxaluric rat kidneys to 4.4 ± 2.7 in kidneys of hyperoxaluric rats that were treated with OPN siRNA. Moreover, the crystal deposits seen in the OPN siRNA treated rats were relatively smaller in size. There was no significant difference in renal crystal deposition between the hyperoxaluric rats of group B and rats of negative control of group D, which had 8.6 ± 3.1 crystal deposits/field. Renal calcium concentration (Fig. 4) was also significantly high in kidneys of rats of group B compared to those of group C. There was no difference in calcium concentration in kidneys of rats belonging to groups B and D.
Fig. 3.
Hematoxylin stained section of kidneys from hyperoxaluric rats. Calcium oxalate crystals are seen in the lumens of the renal tubules indicated by arrows. The number of crystal deposits in hyperoxaluric rat kidneys was decreased compared with in hyperoxaluric rats that were treated with OPN siRNA (P < 0.05)
Fig. 4.
Concentration of calcium in kidneys as measured by atomic absorption spectrophotometry. A Control, B ethylene glycol, C ethylene glycol plus OPN siRNA, D negative control. Renal calcium concentration was high in kidneys of rats of group B compared to those of group C (P < 0.05). There was no difference in calcium concentration in kidneys of rats belonging to groups B and D
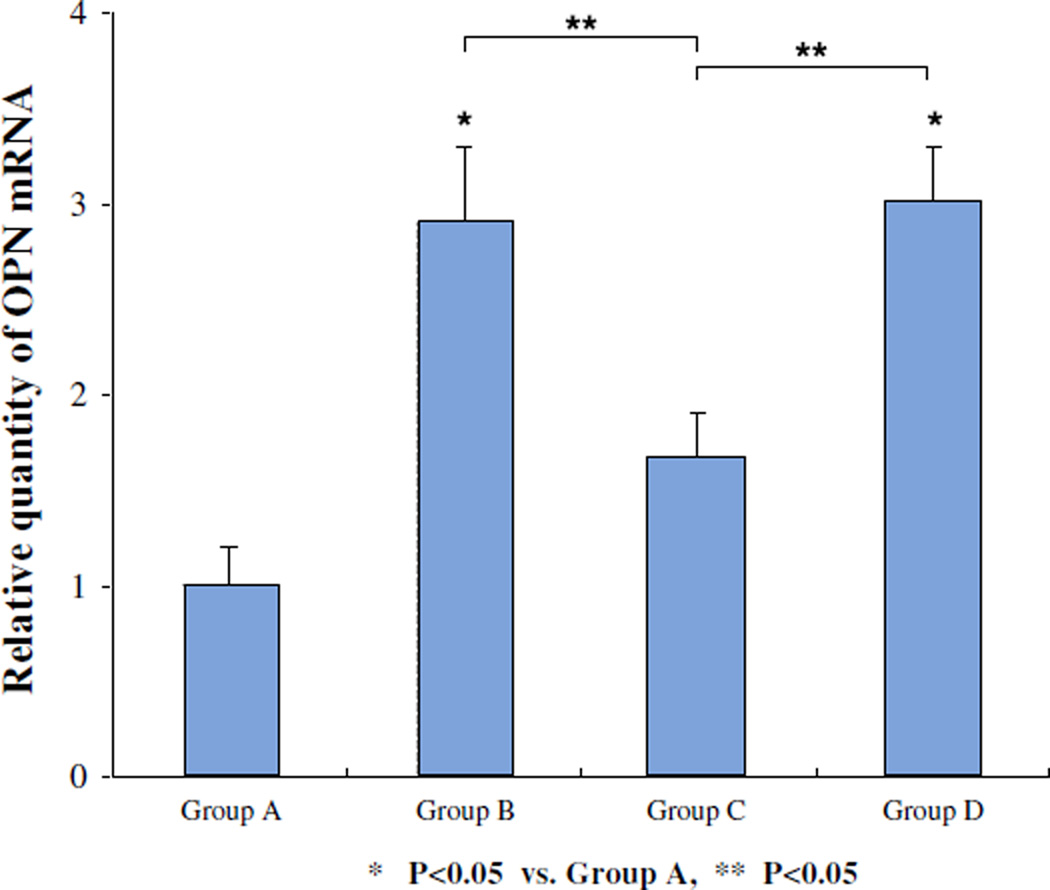
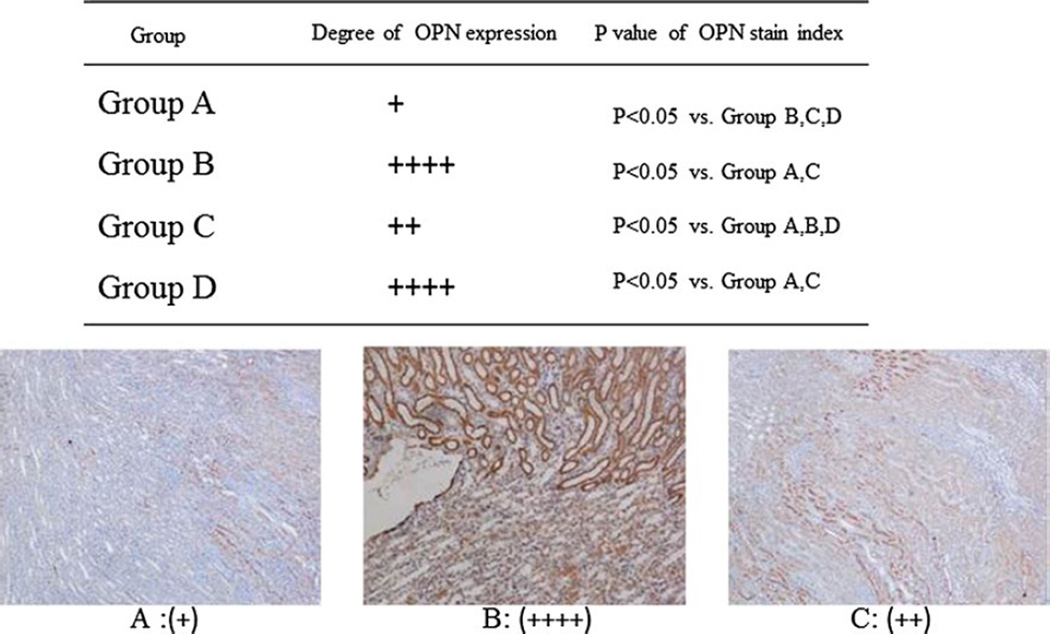
Renal OPN mRNA was significantly increased in the hyperoxaluric rats. The transfection of OPN siRNA led to significant reduction in the expression of OPN mRNA as seen in rats of group C (Fig. 5). There were no significant differences in relative quantity of OPN mRNA in kidneys between hyperoxaluric rats of group B that received ethylene glycol only and rats of group D the negative controls. Immunohistochemical analyses showed increased renal OPN expression in hyperoxaluric rats of group B (Fig. 6) with significant reduction after OPN siRNA treatment as seen in rats of group C. There was no difference in OPN expression in kidneys of rats in group D, the negative control group. OPN stain index is 48.12 ± 4.9, 59.68 ± 5.8, 54.33 ± 2.9, 58.45 ± 4.8 in group A, B, C and D, respectively. P values were revealed in Fig. 6 (paired t test).
Fig. 5.
Relative quantity of OPN mRNA in kidneys of rats. A Control, B ethylene glycol, C ethylene glycol plus OPN siRNA, D negative control. The transfection of OPN siRNA led to significant reduction in the expression of OPN mRNA as seen in rats of group C (P < 0.05, group C vs. B and D). There were no significant differences in relative quantity of OPN mRNA in kidneys between hyperoxaluric rats of group B that received ethylene glycol only and rats of group D the negative controls
Fig. 6.
Histochemical analyses of osteopontin expression in the kidneys of rats of various groups. + Represents arbitrary amount of OPN expression in as visualized using double-blind method. A Control, B ethylene glycol, C ethylene glycol plus OPN siRNA, D negative control. All tubular cell stain intensities were measured using image-analyzing software and OPN expression levels were evaluated. The mean value was defined as OPN stain index. OPN expression was decreased in OPN siRNA transfection group C; compared to group B, hyperoxaluria without the treatment (P < 0.05)
Rats in all four groups stayed healthy. There were no significant differences between rats of the four groups in body weight on day 1 and day 15. Rats weighed 204.3 ± 12.8, 198.9 ± 15.8, 202.4 ± 13.1, 208.1 ± 14.1 in group A, B, C and D, respectively, on day 1 of the experiment and 274.2 ± 15.8, 265.6 ± 15.1, 268.1 ± 13.7, 271.8 ± 16.9 g, respectively, on day 15 before they were killed.
Discussion
The formation of kidney stones, majority being made of CaOx crystals, is a common human disorder and complex process. It involves a number of activities such as nucleation, growth and aggregation of the crystals in the kidneys and their retention therein. These processes are controlled by various factors including urinary proteins, which are also the major constituents of the matrices of kidney stones. OPN, Tamm–Horsfall protein (THP), bikunin, prothrombin fragment-1, α1-microglobulin, inter-α-inhibitor, and matrix-gla protein are some of the major crystallization modulators [13]. OPN is considered as one of the most important macromolecules affecting mineralization and kidney stone formation. To understand the involvement of OPN in CaOx crystallization in the kidneys a number of in vivo studies have been performed using both rats and mice [10, 11, 14–17] in which production of OPN has been manipulated by various techniques.
All such studies involve induction of hyperoxaluria by the administration of oxalate precursors such as ethylene glycol, hydroxyl-l-proline, or glyoxylate. Administration of ethylene glycol to male Sprague–Dawley rats leads to hyperoxaluria and CaOx crystal deposition in the kidneys [9]. Exposure to high oxalate and CaOx crystals also induces the production of reactive oxygen species (ROS) by the renal epithelial cells [7]. A number of studies have demonstrated a link between OPN production and ROS and the renin angiotensin system (RAS), in particular angiotensin II. Angiotensin II infusion stimulates expression of OPN, macrophage infiltration, and tubulointerstitial injury [18]. Angiotensin II is implicated in causing oxidative stress by stimulating membrane bound NA DPH oxidase leading to increased generation of superoxide [19, 20]. Angiotensin II mediates OPN synthesis which is involved in both macrophage recruitment and calcium oxalate crystallization. Significant reduction in OPN expression was found after transfection with angiotensinogen or angiotensin II receptor type 1 (AT1) antisense oligonucleotide [21].
Rat model studies show that OPN expression is significantly increased with the development of hyperoxaluria and additional increase is seen after the CaOx crystal deposition in the kidneys [10, 11]. As a result it has been suggested that OPN expression and production plays an important role in crystal deposition in the kidneys. To validate this hypothesis a number of studies have been carried out to reduce OPN production in hyperoxaluric rats by manipulating RAS and ROS production. Reduction in renal expression and urinary excretion of osteopontin by treatment with candesartan, an angiotensin II receptor 1 blocker was associated with decreased CaOx crystal deposition in the kidneys [17]. Administration of losartan, another angiotensin II receptor 1 blocker, also resulted in reduction of CaOx crystal deposits [22] in EG induced hyperoxaluria. Inhibition of angiotensin converting enzyme by enalapril, similarly reduced CaOx crystal deposition in kidneys of rats administered ethylene glycol [23]. Inhibition of NA DPH oxidase by apocynin treatment resulted in the reduction in ROS production, osteopontin production and urinary excretion, as well as CaOx crystal build up in the kidneys of rats made hyperoxaluric by administration of hydroxyl-l-proline [24]. Utilizing global transcriptome analyses, we determined that hyperoxaluria triggered strong up-regulation of NA DPH oxidase system and OPN gene, via angiotensin II pathway [25]. These effects were reversed by apocynin treatment.
Reduction of OPN production in mice by knocking out OPN gene has led to two different conclusions, one suggesting an inhibitory role while the other as a promoter of crystal retention. Results of one study showed that OPN knock out led to increased CaOx crystal deposition in the kidneys of mice made hyperoxaluric by the administration of ethylene glycol [15]. Another study showed that knocking out the OPN gene led to decreased CaOx crystal deposition in kidneys of mice made hyperoxaluric by the intra-peritoneal administration of glyoxylate [16]. These differences are most likely a result of dissimilarities in urinary excretion of calcium. Hyperoxaluria alone is not sufficient to produce CaOx crystal deposits in mice kidneys [26]. However, rats respond differently to hyperoxaluric challenges. Induction of hyperoxaluria is almost always associated with CaOx crystal deposition in kidneys of male Sprague–Dawley rats as shown here [8, 27].
Our studies demonstrate that a reduction in OPN production by the hyperoxaluric rats was associated with reduction in the deposition of CaOx crystals in the kidneys. OPN siRNA was delivered to the opposite side from injection by atelocollagen and crystal distribution between closed and distal segments of siRNA injection was not provided clearly. The results are similar to those obtained through reduction of OPN by various therapeutic treatments as discussed above. It is already established that OPN expression, production and urinary excretion is increased during experimental CaOx nephrolithiasis. It is also recognized that OPN is an inhibitor of calcification and biomineralization. OPN activity depends upon a number of factors including structure, posttranslational modifications, and fixation [4, 28]. Soluble OPN as used in various in vitro studies, is shown to be an inhibitor of crystal nucleation, growth, aggregation as well as attachment to renal epithelial cells. However, OPN in the hyperoxaluric rats is seen coating the epithelial cell surfaces which may promote crystal attachment [29]. Crystallization modulators present in the normal urine are different from those present in the urine of stone forming individuals in their capacity to inhibit crystal attachment to renal epithelial cells after coating the crystal surfaces [30].
According to the current concepts calcific stones form attached to either the Randall’s plaques or Randall’s plugs [31, 32]. Plaques are subepithelial deposits of basic calcium phosphate on renal papillary surfaces [33] while deposits of calcium phosphate or CaOx blocking the ostia of ducts of Bellini at the renal papillary tip are called Randall’s plugs [32]. Idiopathic stones form by the deposition of CaOx crystals on the exposed plaques or plugs. The interface between the matrix of CaOx crystals of the developing stone and calcium phosphate of the plaque contains OPN [34]. The matrix of CaOx crystals also comprises OPN [2]. Apparently OPN buildup on crystal surfaces stimulates further crystal deposition, advances mineralization front and promotes stone formation.
Acknowledgments
This work was supported in part by research grants “kidney disease” from the Osaka Kidney Bank. Dr. Khan’s research is supported by National Institute of Health grant # RO1-DK 078602.
Footnotes
Conflict of interest None.
Contributor Information
Hidenori Tsuji, Email: tsujihidenori@hotmail.com, Department of Urology, Kinki University Faculty of Medicine, 377-2 Ohnohigashi, Osakasayama, Osaka 589-8511, Japan.
Nobutaka Shimizu, Department of Urology, Kinki University Faculty of Medicine, 377-2 Ohnohigashi, Osakasayama, Osaka 589-8511, Japan.
Masahiro Nozawa, Department of Urology, Kinki University Faculty of Medicine, 377-2 Ohnohigashi, Osakasayama, Osaka 589-8511, Japan.
Tohru Umekawa, Department of Urology, Kinki University Faculty of Medicine, 377-2 Ohnohigashi, Osakasayama, Osaka 589-8511, Japan.
Kazuhiro Yoshimura, Department of Urology, Kinki University Faculty of Medicine, 377-2 Ohnohigashi, Osakasayama, Osaka 589-8511, Japan.
Marco A. De Velasco, Department of Urology, Kinki University Faculty of Medicine, 377-2 Ohnohigashi, Osakasayama, Osaka 589-8511, Japan
Hirotsugu Uemura, Department of Urology, Kinki University Faculty of Medicine, 377-2 Ohnohigashi, Osakasayama, Osaka 589-8511, Japan.
Saeed R. Khan, Department of Pathology and Laboratory Medicine, College of Medicine, University of Florida, Gainesville, FL, USA
References
- 1.Mazzali M, Kipari T, Ophascharoensuk V, Wesson JA, Johnson R, Hughes J. Osteopontin—a molecule for all seasons. QJM. 2002;95:3–13. doi: 10.1093/qjmed/95.1.3. [DOI] [PubMed] [Google Scholar]
- 2.McKee MD, Nanci A, Khan SR. Ultrastructural immunodetection of osteopontin and osteocalcin as major matrix components of renal calculi. J Bone Miner Res. 1995;10:1913–1929. doi: 10.1002/jbmr.5650101211. [DOI] [PubMed] [Google Scholar]
- 3.Evan AP, Bledsoe SB, Smith SB, Bushinsky DA. Calcium oxalate crystal localization and osteopontin immunostaining in genetic hypercalciuric stone-forming rats. Kidney Int. 2004;65:154–161. doi: 10.1111/j.1523-1755.2004.00396.x. [DOI] [PubMed] [Google Scholar]
- 4.Kohri K, Yasui T, Okada A, Hirose M, Hamamoto S, Fujii Y, Niimi K, Taguchi K. Biomolecular mechanism of urinary stone formation involving osteopontin. Urol Res. 2012;40:623–637. doi: 10.1007/s00240-012-0514-y. [DOI] [PubMed] [Google Scholar]
- 5.Wesson JA, Ward MD. Role of crystal surface adhesion in kidney stone disease. Curr Opin Nephrol Hypertens. 2006;15:386–393. doi: 10.1097/01.mnh.0000232879.50716.6f. [DOI] [PubMed] [Google Scholar]
- 6.Khan SR. Role of renal epithelial cells in the initiation of calcium oxalate stones. Nephron Exp Nephrol. 2004;98:e55–e60. doi: 10.1159/000080257. [DOI] [PubMed] [Google Scholar]
- 7.Khan SR. Reactive oxygen species as the molecular modulators of calcium oxalate kidney stone formation: evidence from clinical and experimental investigations. J Urol. 2013;189:803–811. doi: 10.1016/j.juro.2012.05.078. [DOI] [PMC free article] [PubMed] [Google Scholar]
- 8.Khan SR, Glenton PA, Byer KJ. Modeling of hyperoxaluric calcium oxalate nephrolithiasis: experimental induction of hyperoxaluria by hydroxy-l-proline. Kidney Int. 2006;70:914–923. doi: 10.1038/sj.ki.5001699. [DOI] [PubMed] [Google Scholar]
- 9.Khan SR. Animal models of kidney stone formation: an analysis. World J Urol. 1997;15:236–243. doi: 10.1007/BF01367661. [DOI] [PubMed] [Google Scholar]
- 10.Khan SR, Johnson JM, Peck AB, Cornelius JG, Glenton PA. Expression of osteopontin in rat kidneys: induction during ethylene glycol induced calcium oxalate nephrolithiasis. J Urol. 2002;168:1173–1181. doi: 10.1016/S0022-5347(05)64621-6. [DOI] [PubMed] [Google Scholar]
- 11.Katsuma S, Shiojima S, Hirasawa A, Takagi K, Kaminishi Y, Koba M, Hagidai Y, Murai M, Ohgi T, Yano J, Tsujimoto G. Global analysis of differentially expressed genes during progression of calcium oxalate nephrolithiasis. Biochem Biophys Res Commun. 2002;296:544–552. doi: 10.1016/s0006-291x(02)00840-9. [DOI] [PubMed] [Google Scholar]
- 12.Umekawa T, Chegini N, Khan SR. Oxalate ions and calcium oxalate crystals stimulate MCP-1 expression by renal epithelial cells. Kidney Int. 2002;61:105–112. doi: 10.1046/j.1523-1755.2002.00106.x. [DOI] [PubMed] [Google Scholar]
- 13.Khan SR, Kok DJ. Modulators of urinary stone formation. Front Biosci. 2004;9:1450–1482. doi: 10.2741/1347. [DOI] [PubMed] [Google Scholar]
- 14.Mo L, Liaw L, Evan AP, Sommer AJ, Lieske JC, Wu XR. Renal calcinosis and stone formation in mice lacking osteopontin, Tamm–Horsfall protein, or both. Am J Physiol Renal Physiol. 2007;293:F1935–F1943. doi: 10.1152/ajprenal.00383.2007. [DOI] [PubMed] [Google Scholar]
- 15.Wesson JA, Johnson RJ, Mazzali M, Wesson JA, Johnson RJ, Mazzali M, Beshensky AM, Stietz S, Giachelli C, Liaw L, Alpers CE, Couser WG, Kleinman JG, Hughes J. Osteopontin is a critical inhibitor of calcium oxalate crystal formation and retention in renal tubules. J Am Soc Nephrol. 2003;14:139–147. doi: 10.1097/01.asn.0000040593.93815.9d. [DOI] [PubMed] [Google Scholar]
- 16.Hamamoto S, Nomura S, Yasui T, Okada A, Hirose M, Shimizu H, Itoh Y, Tozawa K, Khori K. Effects of impaired functional domains of osteopontin on renal crystal formation: analyses of OPN transgenic and OPN knockout mice. J Bone Miner Res. 2010;25:2712–2723. doi: 10.1359/jbmr.090520. [DOI] [PubMed] [Google Scholar]
- 17.Umekawa T, Hatanaka Y, Kurita T, Khan SR. Effect of angiotensin II receptor blockage on osteopontin expression and calcium oxalate crystal deposition in rat kidneys. J Am Soc Nephrol. 2004;15:635–644. doi: 10.1097/01.asn.0000113321.49771.2d. [DOI] [PubMed] [Google Scholar]
- 18.Giachelli CM, Lombardi D, Johnson RJ, Murry CE, Almeida M. Evidence for a role of osteopontin in macrophage infiltration in response to pathological stimuli in vivo. Am J Pathol. 1998;152:353–358. [PMC free article] [PubMed] [Google Scholar]
- 19.Knight JA. Free radicals: their history and current status in aging and disease. Ann Clin Lab Sci. 1998;28:331–346. [PubMed] [Google Scholar]
- 20.Wilcox CS, Welch WJ. Oxidative stress: cause or consequence of hypertension. Exp Biol Med (Maywood) 2001;226:619–620. doi: 10.1177/153537020222600702. [DOI] [PubMed] [Google Scholar]
- 21.Ricardo SD, Franzoni DF, Roesener CD, Crisman JM, Diamond JR. Angiotensinogen and AT(1) antisense inhibition of osteopontin translation in rat proximal tubular cells. Am J Physiol Renal Physiol. 2000;278:F708–F716. doi: 10.1152/ajprenal.2000.278.5.F708. [DOI] [PubMed] [Google Scholar]
- 22.Toblli JE, Ferder L, Stella I, De Cavanaugh EM, Angerosa M, Inserra F. Effects of angiotensin II subtype 1 receptor blockade by losartan on tubulointerstitial lesions caused by hyperoxaluria. J Urol. 2002;168:1550–1555. doi: 10.1016/S0022-5347(05)64519-3. [DOI] [PubMed] [Google Scholar]
- 23.Toblli JE, Ferder L, Stella I, Angerosa M, Inserra F. Protective role of enalapril for chronic tubulointerstitial lesions of hyperoxaluria. J Urol. 2001;166:275–280. [PubMed] [Google Scholar]
- 24.Zuo J, Khan A, Glenton PA, Khan SR. Effect of NA DPH oxidase inhibition on the expression of kidney injury molecule and calcium oxalate crystal deposition in hydroxy-l-proline-induced hyperoxaluria in the male Sprague–Dawley rats. Nephrol Dial Transpl. 2011;26:1785–1796. doi: 10.1093/ndt/gfr035. [DOI] [PMC free article] [PubMed] [Google Scholar]
- 25.Joshi S, Saylor BT, Wang W, Peck AB, Khan SR. Apocynin-treatment reverses hyperoxaluria induced changes in NA DPH oxidase system expression in rat kidneys: a transcriptional study. PLoS One. 2012;7:e47738. doi: 10.1371/journal.pone.0047738. [DOI] [PMC free article] [PubMed] [Google Scholar]
- 26.Khan SR, Glenton PA. Experimental induction of calcium oxalate nephrolithiasis in mice. J Urol. 2010;184:1189–1196. doi: 10.1016/j.juro.2010.04.065. [DOI] [PMC free article] [PubMed] [Google Scholar]
- 27.Khan SR. Nephrocalcinosis in animal models with and without stones. Urol Res. 2010;38:429–438. doi: 10.1007/s00240-010-0303-4. [DOI] [PMC free article] [PubMed] [Google Scholar]
- 28.Hunter GK. Role of osteopontin in modulation of hydroxyapatite formation. Calcif Tissue Int. 2013;93:348–354. doi: 10.1007/s00223-013-9698-6. [DOI] [PubMed] [Google Scholar]
- 29.Yamate T, Kohri K, Umekawa T, Konya E, Ishikawa Y, Iguchi M, Kurita T. Interaction between osteopontin on Madin Darby canine kidney cell membrane and calcium oxalate crystal. Urol Int. 1999;62:81–86. doi: 10.1159/000030363. [DOI] [PubMed] [Google Scholar]
- 30.Kumar V, Pena de la Vega L, Farell G, Lieske JC. Urinary macromolecular inhibition of crystal adhesion to renal epithelial cells is impaired in male stone formers. Kidney Int. 2005;68:1784–1792. doi: 10.1111/j.1523-1755.2005.00595.x. [DOI] [PubMed] [Google Scholar]
- 31.Khan SR, Rodriguez DE, Gower LB, Monga M. Association of Randall plaque with collagen fibers and membrane vesicles. J Urol. 2012;187:1094–1100. doi: 10.1016/j.juro.2011.10.125. [DOI] [PMC free article] [PubMed] [Google Scholar]
- 32.Khan SR, Finlayson B, Hackett R. Renal papillary changes in patient with calcium oxalate lithiasis. Urology. 1984;23:194–199. doi: 10.1016/0090-4295(84)90021-9. [DOI] [PubMed] [Google Scholar]
- 33.Coe FL, Evan AP, Worcester EM, Lingeman JE. Three pathways for human kidney stone formation. Urol Res. 2010;38:147–160. doi: 10.1007/s00240-010-0271-8. [DOI] [PMC free article] [PubMed] [Google Scholar]
- 34.Evan AP, Coe FL, Lingeman JE, Shao Y, Sommer AJ, Bledsoe SB, Anderson JC, Worcester EM. Mechanism of formation of human calcium oxalate renal stones on Randall’s plaque. Anat Rec (Hoboken) 2007;290:1315–1323. doi: 10.1002/ar.20580. [DOI] [PubMed] [Google Scholar]


