Published ahead of print March 22, 2016
Abstract
BACKGROUND:
The use of intraoperative pulse oximetry (Spo2) enhances hypoxia detection and is associated with fewer perioperative hypoxic events. However, Spo2 may be reported as 98% when arterial partial pressure of oxygen (Pao2) is as low as 70 mm Hg. Therefore, Spo2 may not provide advance warning of falling arterial oxygenation until Pao2 approaches this level. Multiwave pulse co-oximetry can provide a calculated oxygen reserve index (ORI) that may add to information from pulse oximetry when Spo2 is >98%. This study evaluates the ORI to Pao2 relationship during surgery.
METHODS:
We studied patients undergoing scheduled surgery in which arterial catheterization and intraoperative arterial blood gas analysis were planned. Data from multiple pulse co-oximetry sensors on each patient were continuously collected and stored on a research computer. Regression analysis was used to compare ORI with Pao2 obtained from each arterial blood gas measurement and changes in ORI with changes in Pao2 from sequential measurements. Linear mixed-effects regression models for repeated measures were then used to account for within-subject correlation across the repeatedly measured Pao2 and ORI and for the unequal time intervals of Pao2 determination over elapsed surgical time. Regression plots were inspected for ORI values corresponding to Pao2 of 100 and 150 mm Hg. ORI and Pao2 were compared using mixed-effects models with a subject-specific random intercept.
RESULTS:
ORI values and Pao2 measurements were obtained from intraoperative data collected from 106 patients. Regression analysis showed that the ORI to Pao2 relationship was stronger for Pao2 to 240 mm Hg (r2 = 0.536) than for Pao2 over 240 mm Hg (r2 = 0.0016). Measured Pao2 was ≥100 mm Hg for all ORI over 0.24. Measured Pao2 was ≥150 mm Hg in 96.6% of samples when ORI was over 0.55. A random intercept variance component linear mixed-effects model for repeated measures indicated that Pao2 was significantly related to ORI (β[95% confidence interval] = 0.002 [0.0019–0.0022]; P < 0.0001). A similar analysis indicated a significant relationship between change in Pao2 and change in ORI (β [95% confidence interval] = 0.0044 [0.0040–0.0048]; P < 0.0001).
CONCLUSIONS:
These findings suggest that ORI >0.24 can distinguish Pao2 ≥100 mm Hg when Spo2 is over 98%. Similarly, ORI > 0.55 appears to be a threshold to distinguish Pao2 ≥150 mm Hg. The usefulness of these values should be evaluated prospectively. Decreases in ORI to near 0.24 may provide advance indication of falling Pao2 approaching 100 mm Hg when Spo2 is >98%. The clinical utility of interventions based on continuous ORI monitoring should be studied prospectively.
Pulse oximetry use has been shown to enhance hypoxia detection and is associated with fewer perioperative hypoxic events,1 but the relationship between arterial partial pressure of oxygen (Pao2) and arterial oxygen saturation (Sao2) is not linear, because there is a rapid Sao2 decline once Pao2 decreases to <70 mm Hg.2 Pulse oxygen saturation (Spo2) is determined based on differences in light absorption that occur with arterial inflow compared with background light absorption by tissues, venous blood, and capillary blood.3,4 Commonly used pulse oximeters have a reported accuracy of ±2% to 4% compared with Sao25; thus, pulse oximeters may report Spo2 to be ≥98% whenever Pao2 exceeds 70 mm Hg. In clinical situations during which Pao2 is decreasing, pulse oximeters may not provide advance warning of impending hypoxia, because Spo2 may not decrease until Pao2 falls <70 mm Hg.6 Conversely, in an effort to prevent hypoxia, clinicians often provide supplemental oxygen to maintain Spo2 >98% during surgery to provide a “safety cushion” of oxygenation in the event of unexpected changes in oxygen delivery such as cardiac depression, rapid hemorrhage, or interrupted ventilation.7 This can result in significant hyperoxia, which may have its own negative effects in some patients.8
A multiple wavelength pulse co-oximeter is available that provides Spo2 and additional measurements based on differences in absorption spectra at the emitted wavelengths. Multiwave pulse co-oximetry use has been reported to detect carboxyhemoglobin, methemoglobin,9,10 and total hemoglobin in volunteers11 and during surgery12 in a wide range of clinical settings.13 Similar to standard pulse oximetry, multiwave pulse co-oximetry detects background light absorption in tissues and venous and capillary blood between arterial pulsations.
Oxygen supply is the product of cardiac output and oxygen content, which is determined by hemoglobin concentration, Sao2, and Pao2. Dissolved oxygen increases by 0.3 mL/100 mL of blood for each 100-mm Hg increase in Pao2. This dissolved oxygen can meet some of the metabolic demand for oxygen, decreasing the release of oxygen from hemoglobin. The balance between oxygen supply and demand will alter venous oxygen saturation. In summary, as oxygen supply rises, so will venous oxygen saturation, provided oxygen consumption is stable, as is often the case during anesthesia and surgery. During situations in which Sao2 is 100%, and if hemoglobin and cardiac output are also stable, then venous oxygen saturation will increase as Pao2 increases. Change in venous oxygen saturation results in changes in background light absorption at the multiple emitted wavelengths in the presence of hyperoxia (Pao2 >100 mm Hg). The ratios of light absorption at the multiple emitted wavelengths are mapped at varying degrees of hyperoxia to allow calculation of an oxygen reserve index (ORI) using proprietary algorithms.a ORI is not a measure of Pao2 per se, but rather is a dimensionless index between 0.0 and 1.0 that is derived from and directly related to these absorption patterns and reported when Spo2 is over 98%. ORI will generally be 0.0 when Spo2 is 98% or below. Although physiologic conditions may introduce interindividual variability in ORI, changes in the ratio of light absorption at the multiple emitted wavelengths will still be present in an individual. This should allow ORI to be used as an indication of the degree of hyperoxia over time when Spo2 is over 98%.
Although the algorithm was developed to be sensitive to changes in Pao2 between 100 and 200 mm Hg, ORI may be able to detect changes in Pao2 >200 mm Hg as well. ORI may also serve to indicate Pao2 trends (rising or falling Pao2) when Spo2 is over 98%. It is possible that falling ORI could indicate Pao2 decreases before Spo2 falls. This could provide advance warning of impending desaturation events. This study evaluates the relationship between Pao2 and ORI during surgery.
METHODS
The Loma Linda University IRB approved this observational study of multiwave pulse co-oximetry use during surgery. Written informed consent was obtained from patients scheduled for surgery in whom the management plan included arterial catheterization and intraoperative blood gas analyses. Data collection included patient and intraoperative characteristics.
Multiwave pulse co-oximetry (Radical-7, Touch Screen Software version V1451i; Root Software version V1470i; MS-5 DSP version V7B16; Masimo, Irvine, CA) data were continuously collected and stored on a computer and ORI was calculated. Each patient had multiple (up to 6) pulse co-oximetry sensors applied to fingers as part of the research protocol. Clinicians were not provided with ORI values during the procedures. ORI values were not available from all sensors at each arterial blood gas measurement. For each time point at which a clinically indicated arterial blood gas analysis was performed, all available ORI values collected from the multiple sensors were compared with the Pao2 obtained from arterial blood gas co-oximetry (ABL-800; Radiometer, Copenhagen, Denmark). Sequential changes in Pao2 and ORI were calculated as the value at the time of the later blood gas analysis minus the value at the time of the immediately preceding blood gas analysis (value 2 − value 1; value 3 − value 2; and so on) so that positive values indicate an increase, whereas negative values indicate a decrease in Pao2 or ORI between the samples.
Statistical Methods
Regression analysis was used to compare Pao2 with pooled ORI obtained at the time of arterial blood gas analysis and calculated Pao2 changes with calculated ORI changes from sequential samples. Data were analyzed to determine a Pao2 above and below which linear regression r2 was maximized. Linear mixed-effects regression models for repeated measures were then used to account for within-subject correlation across the repeatedly measured Pao2 and ORI and for the unequal time intervals of Pao2 determination over elapsed surgical time. Mixed-effects regression was performed using PROC MIXED in SAS software (SAS Institute Inc., Cary, NC), which analyzes and adjusts for both balanced and unbalanced data designs, with unequal time points. Regression plots were inspected to identify potential cutoff values for ORI that would indicate Pao2 >100 and 150 mm Hg. The lower cutoff value was chosen to correspond to the normal upper limit of Pao2. The Pao2 above which hyperoxia risks increase is not known.14 However, meta-analyses report that even mild degrees of hyperoxia may be associated with increased risks in critically ill patients with some studies reporting an increased risk at Pao2 as low as 150 mm Hg,15,16 which we used as the upper cutoff Pao2 value. The sensitivity and specificity for predicting falling Pao2 were calculated. Analyses were performed using SAS/STAT software, version 9.4 of the SAS System for Windows.
RESULTS
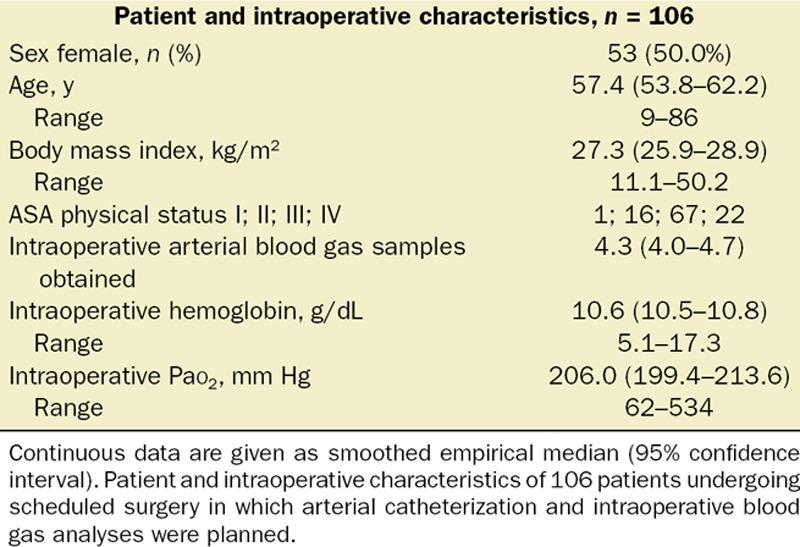
Table 1 shows patient and intraoperative characteristics of the 106 patients from whom data were collected. ORI could be calculated for 92.1% of the 2492 total monitored hours. ORI was not considered reliable in 7.9% of the recorded time related to issues with data collection system resets following dropped data packets and artifacts induced by conditions such as motion or very low perfusion index. Intraoperative Pao2 ranged from 62 to 534 mm Hg in the 485 arterial blood gas analyses obtained. Pao2 was <100 mm Hg in 25 arterial blood gas analyses. Because each patient had multiple sensors applied, a total of 1594 ORI values were used to compare with Pao2.
Table 1.
Patient and Intraoperative Characteristics
The ORI to Pao2 relationship was not linear across the range of Pao2 obtained (Figure 1A). Locally weighted regression analysis suggested a more linear relationship with a positive linear relationship for Pao2 up to 240 mm Hg. Based on the scatterplot, we modeled 2 simple linear regressions with the cutpoint of Pao2 of 240 mm Hg to maximize the r2 for both linear regression equations. Linear regression analysis showed a positive Pao2 to ORI relationship for Pao2 up to 240 mm Hg (r2 = 0.536) but not for Pao2 over 240 mm Hg (r2 = 0.0016; Figure 1B).
Figure 1.
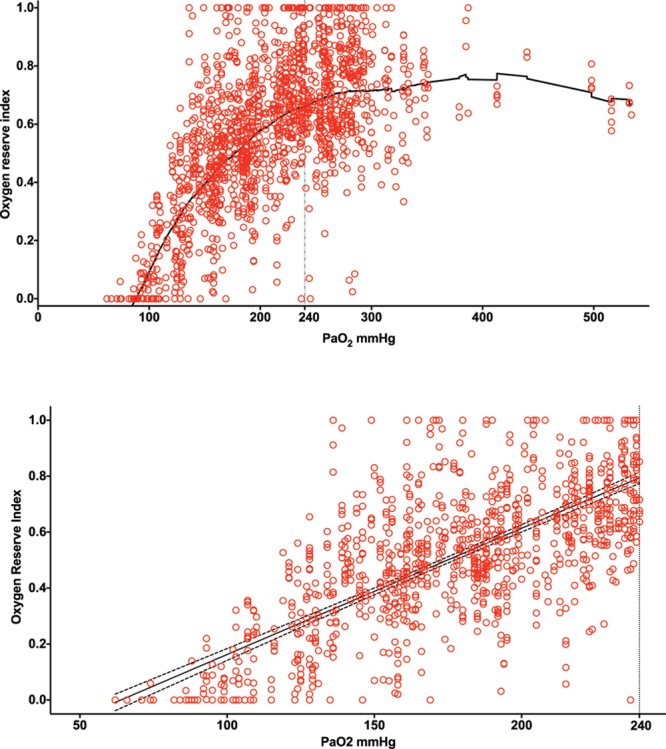
Plot of oxygen reserve index (ORI) compared with arterial partial pressure of oxygen (Pao2) obtained from 106 patients undergoing surgery in whom measured Pao2 from 485 arterial blood gas analyses was between 62 and 534 mm Hg. Patients had >1 sensor applied, with analysis done using 1594 ORI values. A, Locally weighted regression analysis showed a nonlinear relationship overall with a more positive linear relationship for Pao2 up to 240 mm Hg than >240 mm Hg. B, Linear regression analysis of ORI and Pao2 up to 240 mm Hg showed a positive relationship (r2 = 0.536); dashed lines indicate 95% confidence interval of regression line.
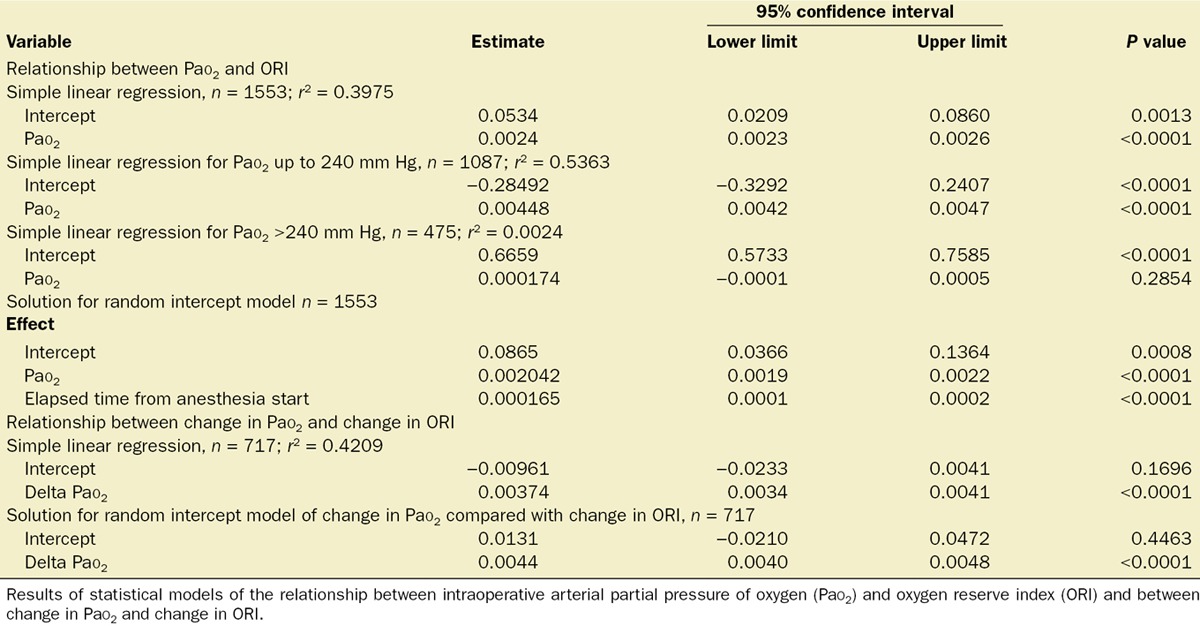
A linear mixed-effects regression model for repeated measures with a variance component covariance matrix was used to account for the within-subject correlation across the repeatedly measured Pao2 and ORI and the potential interaction between treatment effect (Pao2) and the repeated factor (elapsed time). This allowed determination of the level of agreement between the Pao2 measurements with ORI while controlling for the clustering of measurements within a patient. Pao2 and ORI were unequally measured over time. The linear mixed-effects regression model specified ORI as the dependent variable, Pao2 as the independent variable, and elapsed time in surgery as a continuous covariate. In this analysis, the intercept was random and significant (β [95% confidence interval {CI}] = 0.0235 [0.0177–0.0326]; Z = 6.49, P < 0.0001; intraclass correlation = 0.5185), permitting use of the random intercept model. Random slopes were assessed and were not found to be significant. A variance component covariance matrix was chosen. The interaction between Pao2 and time was assessed. The linear regression of the dependent variable of Pao2 and the independent variable of time was not significant (F[1, 1152] = 0.33; P = 0.5634). Because Pao2 does not necessarily depend on elapsed surgery duration, time is not included in our model. In all analyses, we consistently found Pao2 to be significantly related to ORI (Table 2).
Table 2.
Statistical Models
Inspection of the Pao2 to ORI linear regression plot suggested that cutoff values were present. When ORI was over 0.24, all measured Pao2 were ≥100 mm Hg (Figure 2A). When ORI was over 0.55, we found that 96.6% of Pao2 measurements were ≥150 mm Hg (Figure 2B).
Figure 2.
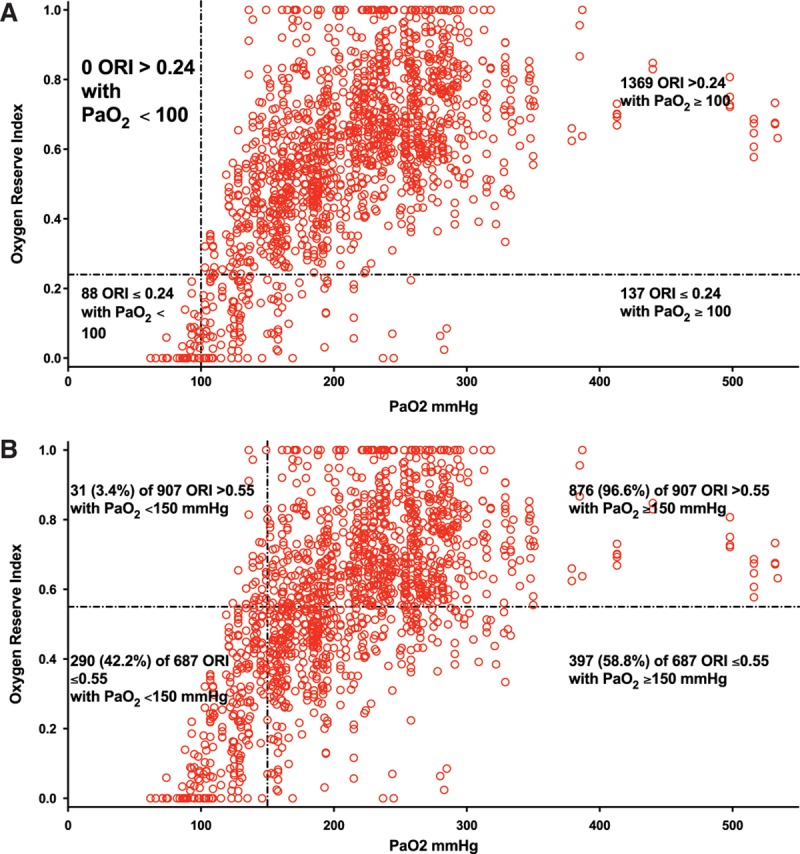
Plot of oxygen reserve index (ORI) to arterial partial pressure of oxygen (Pao2) obtained from 106 patients undergoing surgery suggested cutoff ORI values were present. A, When ORI was >0.24, all Pao2 were ≥100 mm Hg. B, When ORI was >0.55, 96.6% of Pao2 were ≥150 mm Hg.
To examine the relationship between change in Pao2 and change in ORI, we ran a simple linear regression model, ignoring time and the within-subject correlation. The scatterplot was linear, and the results from the simple linear regression analysis indicated a statistically significant relationship between change in ORI and change in Pao2 (β [95% CI] = 0.0037 [0.0034–0.0041]; P < 0.0001). We then modeled a linear mixed-effects regression model for the repeated measures with the dependent variable of change in ORI and the independent variable as change in Pao2. Models of random slopes, random intercepts, and both random slope and random intercepts were assessed with a variance component covariance matrix. The variance of the change in Pao2 was nearly zero and determined to be a fixed effect. The intercept was random and significant with a variance of 0.0171 (Z = 4.85, P < 0.0001; intraclass correlation = 0.4618). In all analyses, we consistently found change in Pao2 to be significantly related to change in ORI (Table 2). Because the positive ORI to Pao2 relationship was better for Pao2 up to 240 mm Hg, analysis of the relationship between change in Pao2 and change in ORI was done only for changes in which Pao2 was up to 240 mm Hg. Thus, 117 Pao2 changes were compared with 717 ORI changes. In this subset, change in ORI and change in Pao2 were associated (r2 = 0.421; Figure 3). For samples in which Pao2 was up to 240 mm Hg, decreasing ORI had 77.7% sensitivity and 76.7% specificity for detecting decreasing Pao2 (area under the receiver operating characteristic curve = 0.821).
Figure 3.
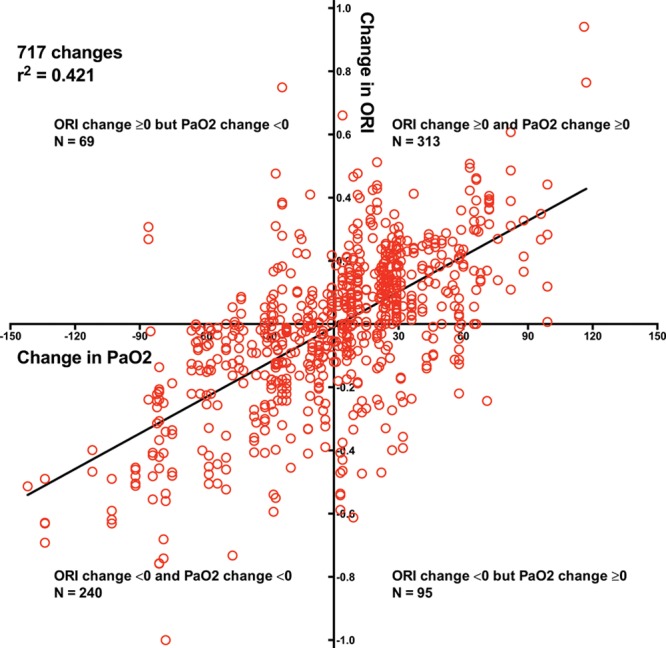
Plot of change in oxygen reserve index (ORI) to change in arterial partial pressure of oxygen (Pao2) for Pao2 up to 240 mm Hg obtained from 106 patients undergoing surgery showed a positive relationship; dashed lines indicate 95% confidence interval of regression line. Falling ORI had 77.7% sensitivity and 76.7% specificity for detecting decreasing Pao2.
DISCUSSION
Advance detection of worsening oxygenation is valuable in operative and critical care settings. Our data suggest that in a somewhat wider Pao2 range than the algorithm was developed for, decreasing ORI detects decreasing Pao2 and that an ORI decrease to 0.24 should provide advance warning of Pao2 declining to approximately 100 mm Hg. This cutoff could be of value during procedures that mandate apnea or 1-lung ventilation or during difficult intubation. Future prospective studies should be performed to determine the clinical utility of using an ORI of 0.24 as a lower threshold and an ORI >0.55 as an upper threshold for titrating inspired oxygen (Fio2) because in our data, ORI >0.24 indicates Pao2 ≥100 mm Hg, whereas Pao2 was ≥150 mm Hg for >96% of measurements in which ORI was >0.55. When intraoperative Pao2 is up to 240 mm Hg, decreasing ORI appears to indicate falling Pao2 before Spo2 reports desaturation, whereas increasing ORI appears to indicate increasing Pao2, as illustrated in plots obtained from individual patients (Figures 4 and 5).
Figure 4.
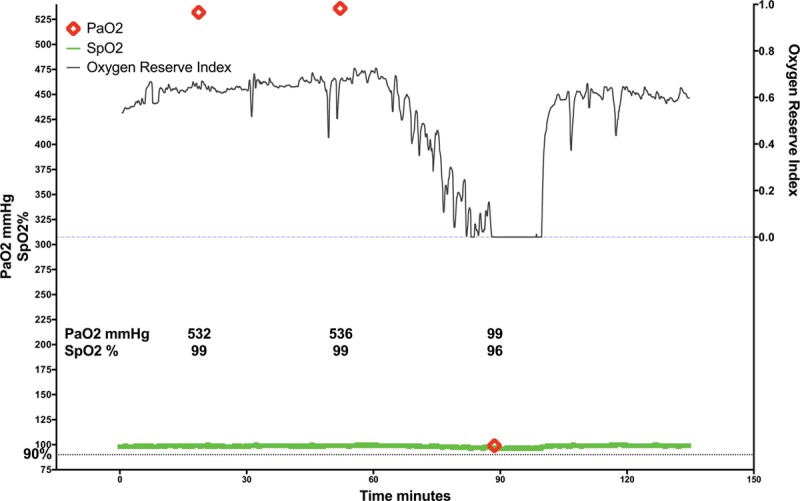
Example of continuous intraoperative oxygen reserve index trend (ORI; black line), continuous pulse oxygen saturation trend (Spo2; green line), and intermittent arterial partial pressure of oxygen determination (Pao2; red diamonds) obtained during surgery. ORI decreased during 30 minutes before a documented large decrease in Pao2.
Figure 5.
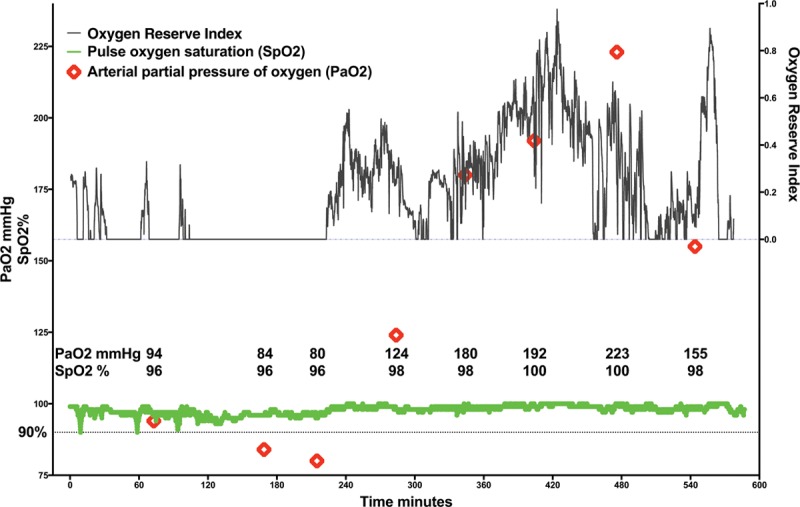
Example of continuous intraoperative oxygen reserve index trend (ORI; black line), continuous pulse oxygen saturation trend (Spo2; green line), and intermittent arterial partial pressure of oxygen determination (Pao2; red diamonds) obtained during surgery. ORI was zero at times when low Pao2 was measured and Spo2 was recorded at 96% and then increased over time as Pao2 and Spo2 increased.
ORI use has the potential to provide continuous monitoring to detect changes in pulmonary function. Although not evaluated in this study, it is possible that when patients are receiving stable Fio2 and when Spo2 is at least 98%, a decreasing ORI may indicate worsening pulmonary function, as may occur in patients with pulmonary contusion or those who require massive transfusion. Further study is needed to determine whether decreasing ORI could be a continuous noninvasive surrogate for the routinely used Pao2 to Fio2 ratio. Such a study could focus on patients in whom changing Pao2 to Fio2 ratios may have predictive value such as after cardiac surgery, in suspected pneumonia, in septic shock, or with worsening congestive heart failure.17–19 Continuous ORI monitoring using the identified threshold value of 0.24 to indicate Pao2 approaching 100 mm Hg may provide earlier detection of worsening pulmonary function in these settings, allowing more rapid treatment, which might mitigate the need for intubation and mechanical ventilation. The threshold for hyperoxic damage in a variety of pathologies is still unknown,8,20 but titrating Fio2 to the lowest desirable Pao2 may be of clinical significance in some patients.7,8,21 Monitoring ORI could potentially prevent excessive hyperoxia, but further study is needed.
Several factors limit generalization of our findings. We studied only intraoperative patients in whom arterial catheterization was deemed indicated for medical or surgical reasons. Studies of ORI monitoring in patient settings such as intensive care units would be prudent. Our ability to evaluate the intraoperative utility of ORI or ORI changes when Pao2 is between 60 and 100 mm Hg is limited by the small number of patients and arterial blood gas samples in which intraoperative Pao2 was <100 mm Hg. Further investigation is needed to determine whether ORI provides clinically useful information that could add to Spo2 when Pao2 is between 100 and 70 mm Hg and thus approaches the level at which the Sao2 to Pao2 slope steepens. This study was not designed to evaluate the impact of physiologic changes that alter oxyhemoglobin dissociation such as hypercapnia or hypocapnia on ORI. Our study patients underwent elective surgical procedures with the usual intraoperative management that resulted in a median measured Paco2 of 36.9 mm Hg (95% CI, 36.4–37.3 mm Hg). This limits our ability to assess the effect of abnormal Paco2 on the ORI to Pao2 relationship. There may be other clinical or feasibility limitations of this technology that have not been identified.
CONCLUSIONS
This study suggests that intraoperative ORI can distinguish Pao2 between 100 and 150 mm Hg when Spo2 is >98%. Decreases in ORI to near 0.24 may provide advance indication of falling Pao2 when Spo2 is still >98% and above the Pao2 level at which Sao2 declines rapidly. Usefulness of ORI >0.24 to distinguish Pao2 ≥100 mm Hg and ORI >0.55 to distinguish Pao2 ≥150 mm Hg should be tested prospectively in a range of clinical settings. The clinical utility of interventions based on continuous ORI monitoring should also be studied prospectively.
DISCLOSURES
Name: Richard L. Applegate II, MD.
Contribution: This author helped design the study, conduct the study, analyze the data, and write the manuscript.
Conflicts of Interest: Richard L. Applegate II was the principal investigator in this study for which funding was provided by a grant from Masimo to the Loma Linda University School of Medicine, Department of Anesthesiology.
Name: Ihab L. Dorotta, MD.
Contribution: This author helped analyze the data and write the manuscript.
Conflicts of Interest: Ihab L. Dorotta reported no conflicts of interest.
Name: Briana Wells, MS.
Contribution: This author helped analyze the data and write the manuscript.
Conflicts of Interest: Briana Wells reported no conflicts of interest.
Name: David Juma, MPH.
Contribution: This author helped analyze the data and write the manuscript.
Conflicts of Interest: David Juma reported no conflicts of interest.
Name: Patricia M. Applegate, MD.
Contribution: This author helped analyze the data and write the manuscript.
Conflicts of Interest: Patricia M. Applegate reported no conflicts of interest.
This manuscript was handled by: Maxime Cannesson, MD, PhD.
ACKNOWLEDGMENTS
The authors acknowledge the statistical analysis assistance of Mark Ghamsary, PhD, Associate Professor of Biostatistics, Center for Community Resilience, Loma Linda University School of Public Health.
FOOTNOTES
Masimo Whitepaper. Accessed October 13, 2015. Oxygen Reserve Index. http://www.masimo.co.uk/pdf/ori/LAB8543A_Whitepaper_ORI_British.pdf
Published ahead of print March 22, 2016
Funding: Funding for this study was provided by a grant from Masimo to the Loma Linda University School of Medicine, Department of Anesthesiology, and from departmental sources.
Conflict of Interest: See Disclosures at the end of the article.
This report was previously presented, in part, at the International Anesthesia Research Society Annual Meeting 2015, S1646.
Reprints will not be available from the authors.
REFERENCES
- 1.Pedersen T, Nicholson A, Hovhannisyan K, Møller AM, Smith AF, Lewis SR. Pulse oximetry for perioperative monitoring. Cochrane Database Syst Rev. 2014;3:CD002013. doi: 10.1002/14651858.CD002013.pub3. [DOI] [PMC free article] [PubMed] [Google Scholar]
- 2.Beasley R, McNaughton A, Robinson G. New look at the oxyhaemoglobin dissociation curve. Lancet. 2006;367:1124–6. doi: 10.1016/S0140-6736(06)68488-2. [DOI] [PubMed] [Google Scholar]
- 3.Chan ED, Chan MM, Chan MM. Pulse oximetry: understanding its basic principles facilitates appreciation of its limitations. Respir Med. 2013;107:789–99. doi: 10.1016/j.rmed.2013.02.004. [DOI] [PubMed] [Google Scholar]
- 4.Nitzan M, Romem A, Koppel R. Pulse oximetry: fundamentals and technology update. Med Devices (Auckl) 2014;7:231–9. doi: 10.2147/MDER.S47319. [DOI] [PMC free article] [PubMed] [Google Scholar]
- 5.Milner QJ, Mathews GR. An assessment of the accuracy of pulse oximeters. Anaesthesia. 2012;67:396–401. doi: 10.1111/j.1365-2044.2011.07021.x. [DOI] [PubMed] [Google Scholar]
- 6.Hsia CC. Respiratory function of hemoglobin. N Engl J Med. 1998;338:239–47. doi: 10.1056/NEJM199801223380407. [DOI] [PubMed] [Google Scholar]
- 7.Lumb AB, Walton LJ. Perioperative oxygen toxicity. Anesthesiol Clin. 2012;30:591–605. doi: 10.1016/j.anclin.2012.07.009. [DOI] [PubMed] [Google Scholar]
- 8.Habre W, Petak F. Perioperative use of oxygen: variabilities across age. Br J Anaesth. 2014;113(suppl 2):ii26–36. doi: 10.1093/bja/aeu380. [DOI] [PubMed] [Google Scholar]
- 9.Shamir MY, Avramovich A, Smaka T. The current status of continuous noninvasive measurement of total, carboxy, and methemoglobin concentration. Anesth Analg. 2012;114:972–8. doi: 10.1213/ANE.0b013e318233041a. [DOI] [PubMed] [Google Scholar]
- 10.Zaouter C, Zavorsky GS. The measurement of carboxyhemoglobin and methemoglobin using a non-invasive pulse CO-oximeter. Respir Physiol Neurobiol. 2012;182:88–92. doi: 10.1016/j.resp.2012.05.010. [DOI] [PubMed] [Google Scholar]
- 11.Macknet MR, Allard M, Applegate RL, II, Rook J. The accuracy of noninvasive and continuous total hemoglobin measurement by pulse CO-oximetry in human subjects undergoing hemodilution. Anesth Analg. 2010;111:1424–6. doi: 10.1213/ANE.0b013e3181fc74b9. [DOI] [PubMed] [Google Scholar]
- 12.Applegate RL, II, Barr SJ, Collier CE, Rook JL, Mangus DB, Allard MW. Evaluation of pulse cooximetry in patients undergoing abdominal or pelvic surgery. Anesthesiology. 2012;116:65–72. doi: 10.1097/ALN.0b013e31823d774f. [DOI] [PubMed] [Google Scholar]
- 13.Kim SH, Lilot M, Murphy LS, Sidhu KS, Yu Z, Rinehart J, Cannesson M. Accuracy of continuous noninvasive hemoglobin monitoring: a systematic review and meta-analysis. Anesth Analg. 2014;119:332–46. doi: 10.1213/ANE.0000000000000272. [DOI] [PubMed] [Google Scholar]
- 14.Spoelstra-de Man AM, Smit B, Oudemans-van Straaten HM, Smulders YM. Cardiovascular effects of hyperoxia during and after cardiac surgery. Anaesthesia. 2015;70:1307–19. doi: 10.1111/anae.13218. [DOI] [PubMed] [Google Scholar]
- 15.Cornet AD, Kooter AJ, Peters MJ, Smulders YM. The potential harm of oxygen therapy in medical emergencies. Crit Care. 2013;17:313. doi: 10.1186/cc12554. [DOI] [PMC free article] [PubMed] [Google Scholar]
- 16.Helmerhorst HJ, Roos-Blom MJ, van Westerloo DJ, de Jonge E. Association between arterial hyperoxia and outcome in subsets of critical illness: a systematic review, meta-analysis, and meta-regression of cohort studies. Crit Care Med. 2015;43:1508–19. doi: 10.1097/CCM.0000000000000998. [DOI] [PubMed] [Google Scholar]
- 17.Luna CM, Vujacich P, Niederman MS, Vay C, Gherardi C, Matera J, Jolly EC. Impact of BAL data on the therapy and outcome of ventilator-associated pneumonia. Chest. 1997;111:676–85. doi: 10.1378/chest.111.3.676. [DOI] [PubMed] [Google Scholar]
- 18.Rello J, Gallego M, Mariscal D, Soñora R, Valles J. The value of routine microbial investigation in ventilator-associated pneumonia. Am J Respir Crit Care Med. 1997;156:196–200. doi: 10.1164/ajrccm.156.1.9607030. [DOI] [PubMed] [Google Scholar]
- 19.Weiss YG, Merin G, Koganov E, Ribo A, Oppenheim-Eden A, Medalion B, Peruanski M, Reider E, Bar-Ziv J, Hanson WC, Pizov R. Postcardiopulmonary bypass hypoxemia: a prospective study on incidence, risk factors, and clinical significance. J Cardiothorac Vasc Anesth. 2000;14:506–13. doi: 10.1053/jcan.2000.9488. [DOI] [PubMed] [Google Scholar]
- 20.Altemeier WA, Sinclair SE. Hyperoxia in the intensive care unit: why more is not always better. Curr Opin Crit Care. 2007;13:73–8. doi: 10.1097/MCC.0b013e32801162cb. [DOI] [PubMed] [Google Scholar]
- 21.Decalmer S, O’Driscoll BR. Oxygen: friend or foe in peri-operative care? Anaesthesia. 2013;68:8–12. doi: 10.1111/anae.12088. [DOI] [PubMed] [Google Scholar]


