

Abstract
Understanding how quiescent and apoptotic populations form in tumors is necessary because these cell types can considerably diminish therapeutic efficacy. Most cancer therapeutics are ineffective against quiescent cells because they target rapidly proliferating cells. Distinguishing apoptosis is important because apoptotic cells are committed to death and do not require treatment. Regrowth of quiescent cell can lead to tumor reoccurrence and metastasis, which are the leading causes of cancer mortality. We hypothesized that cylindroid cultures and acridine orange staining could be used to determine how nutrient diffusion creates apoptotic and quiescent regions in tumors. To test this hypothesis we developed a microscopy technique to measure cellular DNA and RNA content in single cells using thin cylindroids and acridine orange staining. Cell classification was compared to flow cytometry of cells grown in defined monolayer cultures. The presence of apoptosis was confirmed by morphological nuclear analysis. The effect of diffusion was determined by varying incubation time, cylindroid size, and exposing cylindroids to nutrient-deficient media. Four overlapping regions were identified as a function of cylindroid radius: an outer viable/quiescent region; a second quiescent/apoptotic region; a third late-stage apoptotic region; and an inner dead region. In monolayer cultures the absence of glutamine and growth factors induced apoptosis and hypoxia induced quiescence. Treating with nutrient-deficient media suggested that cells became quiescent near the periphery because of glucose and oxygen limitations, and became apoptotic and died further from the edge because of glutamine and growth factor limitations. These results show that cellular microenvironments can be identified in cylindroids using simple acridine orange staining and that single cell florescence can be measured in three-dimensional culture. The developed techniques will be useful for developing cancer therapies and determining how cell death and apoptosis are induced in three-dimensional tumor tissue.
Keywords: multicellular cylindroids, acridine orange, apoptosis, quiescence, glutamine, glucose, fluorescence microscopy
Introduction
Tumors have heterogeneous cell populations that include proliferating, quiescent and apoptotic cells (Mueller-Klieser 2000; Sutherland 1988; Sutherland and Durand 1984; Wallen et al. 1984a). Understanding how these populations form in tumors is necessary for the development of therapeutic strategies that target all viable tumor cells (Jain 1998; Kim and Forbes 2007; Tredan et al. 2007; Venkatasubramanian et al. 2006). Each of these cell types responds differently to therapeutics (Siu et al. 1999). Most cancer therapeutics target rapidly proliferating cells and are ineffective against quiescent cells (Brown and Giaccia 1998; Mellor et al. 2005; Tannock et al. 2002). Apoptotic cells are committed to death and do not require treatment. After each therapy cycle, quiescent cells that are exposed to favorable metabolic conditions will reenter the cell cycle (Kim and Tannock 2005). This regrowth can eventually lead to tumor reoccurrence and metastasis, which are the leading causes of cancer mortality (Tannock 2001).
An in vitro tumor model that accurately determines where cell populations form in tumors and the mechanisms of their formation is essential for predicting the overall response of tumors to therapeutics. Multiple models have been developed to characterize apoptotic, quiescent and proliferating cells including spheroid, sandwich, and cylindroid cultures. Spheroids are spherical clusters of cells that are grown suspended in culture medium (Sutherland 1988; Sutherland and Durand 1984). Concentric cell layers in spheroids create pH, oxygen, and nutrient gradients (Mueller-Klieser 2000; Sutherland 1988) as well as the quiescent and apoptotic microenvironments observed in tumors in vivo (Freyer and Sutherland 1986; Venkatasubramanian et al. 2006). Quiescence and apoptosis are difficult to study in spheroids because cells must first be physically dissociated and the regions cannot be observed microscopically. Sandwich cultures are formed by constraining a monolayer of cells between two glass slides to create nutrient gradients (Hlatky and Alpen 1985). Sandwich cultures enable the observation of cellular microenvironments using standard fluorescence microscopy (Hlatky and Alpen 1985), but do not capture the cell-cell interactions or interstitial diffusion resistances present in tumors.
Cylindroids were developed in our laboratory to create optically accessible tumor microenvironments and metabolite gradients (Kasinskas and Forbes 2006), and simplify the analysis of cell populations in three-dimensional culture. Tumor cylindroids are created by constraining spheroids between two parallel polymer surfaces. These impermeable surfaces force nutrients in the medium to diffuse from the peripheral edge to the center – a geometry that is similar to in vivo tumors where nutrients in the blood have to diffuse from the vasculature into the tumor interstitium. Although they do not explicitly model whole vascularized tumors, cylindroids provide information about all cell types in tumors by modeling the interstitial spaces between adjacent blood vessels. Conceptually, a large vascularized tumor is composed of the collective behavior of many such interstitial regions. Unlike spheroids, cylindroids have centers that can be observed in real-time with standard fluorescence microscopy techniques. Our laboratory has previously used cylindroids to quantify the chemotaxis of bacteria in tumors (Kasinskas and Forbes 2006; Kasinskas and Forbes 2007) and determine the intracellular metabolism of quiescent cells (Kim and Forbes 2007).
Cell populations can be distinguished in monolayer cultures using acridine orange (AO), a dye which differentially stains cellular DNA and RNA (Darzynkiewicz 1994). When bound to double-stranded nucleic acids, AO fluoresces green and when bound to single-stranded nucleic acids, AO fluoresces red. Flow cytometry and AO staining has been used to quantify populations of quiescent, viable and proliferating cells in cultures of leukemia, neural stem, lymphocyte and epithelial cells (Alam et al. 2004; Darzynkiewicz et al. 1980; Pellicciari et al. 1995) and has shown that starving cells of nutrients, amino acids or serum induces quiescence (Siu et al. 1999; Wallen et al. 1984a; Wallen et al. 1984b).
We hypothesized that the fluorescence intensity profile and nuclear morphology of AO stained cylindroid cultures could be used to determine how nutrient diffusion creates apoptotic and quiescent regions in tumors. We have shown previously that quiescent cells in spheroids have slower rates of biosynthesis (Kim and Forbes 2007) and that glutamine is consumed by cancer cells primarily to provide biosynthetic precursors (Forbes et al. 2006). To test our hypothesis, thin cylindroids were grown and stained with AO. Single cell analysis, a straight-forward and non-invasive technique, was developed to quantify individual cell fluorescence in cylindroids. Using these techniques, four distinct cell populations were identified based on fluorescence intensity and nuclear morphology: viable, quiescent, apoptotic and necrotic cells. Cells were grown as monolayers in nutrient-deficient media and analyzed with flow cytometry to determine the effects of individual nutrients. When cylindroids were exposed to nutrient-deficient media, the location and extent of the cell regions changed. The absence of serum factors and glutamine had the greatest effects by increasing the size of the apoptotic region. In addition, single cell sorting is a generally useful method that can be used to quantify the behavior of individual cells in three-dimensional culture.
Materials and Methods
Cell Culture
Mouse embryonic fibroblast, ras-transformed cells were a kind gift from Dr. R. Johnson (University of California, San Diego). Cells were grown in high glucose Dulbecco Modified Eagle Medium (DMEM, 4.5 g/L glucose) containing 25mM HEPES buffer (pH 7.4) supplemented with 10% fetal bovine serum. All cultures were maintained at 37°C with 5% CO2 in a humidified incubator.
Flow Cytometry
Prior to analysis cells were grown exponentially as monolayers in well plates. Cells were harvested with trypsin-EDTA, washed with PBS, and suspended in 3 ml PBS containing 2% FBS. Cells were fixed by adding 7ml ethanol and were stored at 4°C. Immediately before injection into the flow cytometer (FACSCalibur), the fixed cells were washed with PBS, resuspended in 0.2ml of PBS containing 2% FBS and mixed with 1ml of cooled staining solution, which contained 6μg/ml acridine orange (AO), 1mM ETDA, 0.15M NaCl in phosphate-citric acid buffer adjusted to pH 6.0. The total number of cells was adjusted to 1×10⁶ per sample. During staining, samples were kept on ice. Flow cytometric analysis was carried out less than 5 minutes after the addition of staining solution. Cells were excited with 488nm light. Emitted light was collected through either a 530/30nm (green) band pass filter or a 670nm (red) long pass filter. For each sample, 10,000 events were recorded. Single cells were isolated from doublets by comparing the pulse width to the area of green fluorescence. The total cell population was divided into four subpopulations: viable (G1/S), actively proliferating (S/G2/M), apoptotic (Ap), and quiescent (Q) based on relative green and red fluorescence pulse heights (Darzynkiewicz 1983; Darzynkiewicz et al. 1992). Boundaries between the subpopulations were defined by drawing lines through distinct valleys in contour plots of cellular RNA and DNA levels (Figure 1A). The fraction of cells in each subpopulation was calculated by dividing the number of cells in each region by the total number of cells in all four regions.
Figure 1. Acridine orange staining of transformed cells.
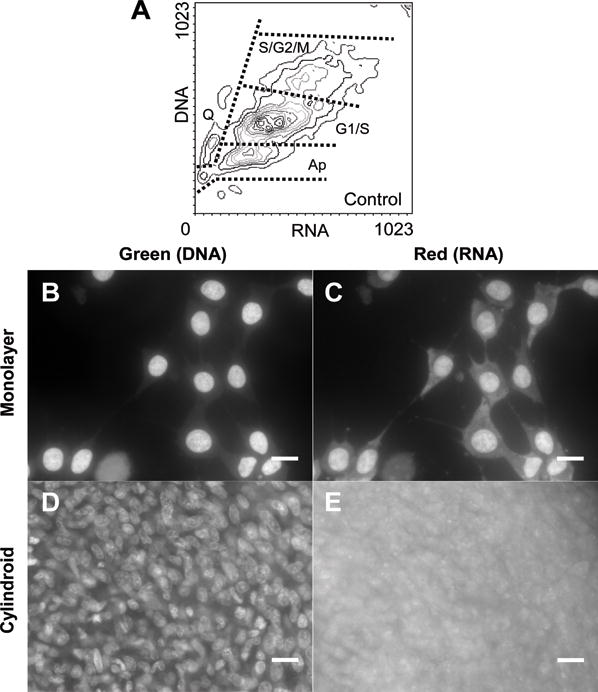
Acridine orange enables discrimination of cell type because it fluoresces green when bound to double-stranded nucleic acids (mostly DNA) and fluoresces red when bound to single-stranded nucleic acids (mostly RNA). A) In monolayer culture four different populations were identified based on DNA and RNA content by flow cytometry: viable (G1/S), actively proliferating (S/G2/M), apoptotic (Ap), and quiescent (Q). B,C) In monolayer culture nuclei fluoresced green (B) and nuclei and cytoplasm both fluoresced red (C). D) Individual nuclei were identifiable in green fluorescence images in cylindroids. E) Cell boundaries were not identifiable in red fluorescence images in cylindroids. Scale bar is 20μm.
Spheroid and Cylindroid Formation
Spheroids were formed from single-cell suspensions inoculated into poly(2-hydroxyethyl methacrylate)-coated T75 cell culture flasks at a density of 1.5×10⁵cells/ml with a total culture volume of 10ml. Embryonic fibroblast cells naturally aggregated into spheroids in coated flasks. Cylindroids were formed by constraining spheroids between the surface of a 48-well plate and a set of 3.2mm cylindrical plugs projecting from a polycarbonate lid (Figure 2A; Kasinskas and Forbes 2006). Cylindroids were prepared from spheroids that were allowed to grow for 6–8 days to a diameter of approximately 150μm.
Figure 2. Schematic of the cylindroid device and the assigned boundaries for single-cell analysis.

A) A tumor cylindroid is formed by constraining a spheroid between the bottom of a well plate and a plug attached to the well-plate lid. Plugs are spaced 60 μm above the bottom of the plate. B) Nuclei centers were identified in green fluorescent images of cylindroids. Around these centers, 16μm diameter circles were drawn and used to determine maximum red and green fluorescence in cells. Scale bar is 20μm.
The thickness of the gap between the bottom of the plate and the plugs was set to 60 ± 20μm, which was thinner than the 150 μm gap used in previous cylindroid experiments (Kasinskas and Forbes 2006; Kim and Forbes 2007) to enhance the visibility of individual cell nuclei. When 150 μm thick, interfering light from out-of-focus nuclei deep in the cylindroid prevented discernment of individual nuclei. Cylindroids in a 60μm gap were very thin; the height to width ratio for these cylindroids ranged from was 1:8 to 1:15, compared to 1:3 and 1:5 for cylindroids in a 150μm gap. The thinness of 60μm-gap cylindroids prevented cell growth beyond 72 hours.
After being constrained, 200μl media was added to each well and cylindroids were allowed to equilibrate for at least 24 hours to relieve mechanical stress and establish oxygen and metabolic gradients (Kasinskas and Forbes 2006) before AO staining. Compression to 60μm did not significantly affect cell viability. Tumor tissue has been shown to relax from mechanical stress on the order of minutes (Netti et al. 2000) and in previous experiments we have shown that after 24 hours of equilibration, the viability distribution in cylindroids is equivalent to uncompressed spheroids (Kim and Forbes 2007).
AO staining and Image Acquisition
Cylindroids were stained by removing the media from each cylindroid well and adding 200μl culture medium containing 0.05% Triton X-100 and 20μg/ml AO. Prior to observation, cylindroids were incubated for 12 hours to allow complete dye diffusion. Fluorescence images were acquired with an Olympus (Center Valley, PA) X71 inverted fluorescence microscope equipped with color-corrected 10X Plan-APO and 20X LCPlanFI fluorescence objectives and IPLab software (BD Bioscience, Rockville, MD). Green and red fluorescence images were acquired using 470/40nm excitation and 525/50nm emission filters, and 535/50nm excitation and 590nm long pass emission filters, respectively (Chroma, Rockingham, VT). To accommodate cylindroids larger than the field of view (665.8 μm × 873.9 μm with the 10X objective and 322.3μm × 423.1μm with the 20X objective), tiled images, composed of 4 or 9 panels, were acquired and assembled using a customized script. Tiling high-resolution images enabled nuclear morphology to be observed in images that were also used to determine radial intensity profiles, which describe macroscopic, population-based information.
Pixel-based Radial Intensity Profiles
Pixel-based radial intensity profiles were generated from green and red fluorescent images using a customized script in ImageJ (NIH Research Services Branch). Cylindroid radii were determined from transmitted light images. Average radial intensities were obtained by summing the intensities of all pixels at a given radius and dividing by the number of pixels at that radius. Distances were normalized by the radius of each cylindroid and fluorescence intensities were normalized to the maximum fluorescence intensity in each image. The locations of peaks and troughs in pixel-based intensity profiles were determined for multiple cylindroids and significance between the locations was determined using Student’s t-test. The peaks and troughs were used to divide cylindroids into distinct annular regions.
Single-Cell Analysis and Sorting
The fluorescence intensity of single cells was determined by locating individual nuclei in green fluorescence images (Figure 2B). The centers of in-focus nuclei were manually chosen and the coordinates were recorded using a customized macro in ImageJ. The locations of the nuclei were used to define 16μm diameter intracellular regions for individual cells (Figure 2B). Within these regions the maximum green and red fluorescence intensity was measured for each cell, to match AO analysis with flow cytometry. This single-cell technique assumed that, on average, the image pixel with the maximum fluorescence intensity within each cell was also within the circular intracellular region of interest. Apoptotic and necrotic cells were excluded from single-cell analysis because of unclear cell boundaries, and because these cell types were easily identifiable based on nuclear morphology. Individual cell fluorescence was compared the pixel-based fluorescence by averaging the intensity of cells in 20μm thick annuli around cylindroid centers. The effect of radial position was determined by comparing cells in the three regions closest to the cylindroid edge. Significance between the fluorescence of the groups was established using Student’s t-test.
Nucleus Size and Density Distribution
Nuclear size and spacing were determined from the green AO fluorescence images from four cylindroids of similar size. Nuclei in one fourth of the cross-sectional area were analyzed. Radial distances were normalized by each cylindroid radius. Polygonal regions-of-interest (ROIs) were defined along each nuclear boundary to account for irregular shapes. The location and areas of the ROIs were measured using ImageJ, and areas were converted into representative diameters. The average nuclear density was determined in 20μm thick circular annuli by dividing each annular area by the number of included nuclei.
Effect of Cylindroid Size and Incubation Time
To determine the effect of cylindroid size two different sized cylindroids were created. For most experiments, large cylindroids with diameters greater than 750μm were used. The effect of size on diffusion was investigated by comparison to smaller 550μm diameter cylindroids. The effect of time for nutrient diffusion was investigated by incubating cylindroids for either 24 or 48 hours, including equilibration time. After incubation, dyes were added and allowed to diffuse for another 12 hours, for a total of 36 and 60 hours. Average intensities at the center and periphery of cylindroids were calculated by averaging intensities from the inner and outer 50μm of acquired radial profiles.
Growth in Nutrient-Deficient Media and Hypoxia
Monolayer cultures were grown to determine the effects of nutrient-deficient media and hypoxia. Cells were inoculated in T75 flasks at a density of 300cells/cm2. After 24hrs of growth, the media were replaced with FBS-, glucose- or glutamine-deficient media. A hypoxic environment was created in a custom-made hypoxia chamber placed in a cell culture incubator at 37°C. The hypoxia chamber was purged with a humidified gas mixture containing 1% oxygen, 5% carbon dioxide and 94% nitrogen. Media in all flasks were replaced daily. After 5 days of growth, number of cells was counted using a hemacytometer and trypan-blue staining. Triplicate flasks were prepared for each treatment. Flow cytometry was preformed on the cells in each flask to quantify the cell populations as described above. The effect of nutrient depletion was determined in cylindroids by replacing with nutrient-deficient media after the equilibration period. Cylindroids were allowed to grow in deficient media for 24 or 48 hours, stained with AO, and imaged as described above. The apoptotic region was identified morphologically as a region where more than 50% of nuclei had formed apoptotic bodies.
Results and Discussion
Identification of Cell Populations with Acridine Orange
The number of cells in different cell-cycle phases was identified in a monolayer culture of proliferating cells using acridine orange (AO) staining and flow cytometry. Acridine orange is a nucleic-acid-selective stain that fluoresces green (525nm) when intercalated into DNA and fluoresces red (>630nm) when electrostatically bound to RNA. The ability of AO to differentially bind single- and double-stranded nucleotides allows it to independently quantify the concentration of RNA and DNA in single cells (Figure 1A).
Based on their DNA and RNA content, cells from exponentially growing monolayer cultures were divided into four populations: viable (G1/S), actively proliferating (S/G2/M), quiescent (Q) and apoptotic (Ap) cells (Figure 1A). S/G2/M phase cells were differentiable from G1/S phase cells because they have replicated their chromosomes and have greater levels of DNA (Darzynkiewicz 1994). Quiescent cells are less metabolically active than viable cells and therefore have lower RNA levels (Darzynkiewicz et al. 1980). Apoptotic cells have less DNA than viable cells because of the onset of nuclear breakdown (Darzynkiewicz et al. 1992).
In monolayer cultures green fluorescence from DNA-bound AO was observed only inside the nucleus (Figure 1B) and red fluorescence from RNA-bound AO was observed throughout the nucleus and the cytoplasm (Figure 1C). In thin cylindroids (60 ± 20μm) individual nuclei were easily identified in the green fluorescence images (Figure 1D). In the same region, cell boundaries were not observed in the red fluorescence images (Figure 1E) because of overlapping fluorescence with out-of-focus cells and the distribution of RNA throughout the cytoplasm.
Acridine Orange Intensity Distribution in Cylindroids
When large cylindroids (>750μm) were stained with acridine orange, local microenvironments were visible as successive bright and dark rings in fluorescence images (Figure 3A & B). All large cylindroids possessed bright rings at the periphery and at the center in both red and green fluorescence images (Figure 3). The dark band between these bright rings was always thicker in the red compared to the green fluorescence images (Figure 3). A dark region was also observed at the center of the red fluorescence images. These bright rings and dark bands appear as peaks and troughs in pixel-based radial intensity profiles (Figure 3C), and were present in all observed large cylindroids that were constrained for 48 hours (n=4, Figure 3D). The first red fluorescence peak was located 41±8μm from the periphery. It was followed by a green fluorescence peak 71±8μm from the periphery, a red trough 117±13μm from the periphery and an internal green peak 367±20 from the periphery. The locations of these peaks and troughs were used to divide cylindroids into four regions: 1) between the outside red and green peaks, 2) between the outside green peak and the red trough, 3) between the red trough and the interior green peak, and 4) inside the interior green peak (Figure 3C & D). The region outside the first red peak was not included because the fluorescence intensities were affected by the spreading of cells along the plastic culture surface.
Figure 3. Acridine orange identifies distinct cellular region in cylindroids.
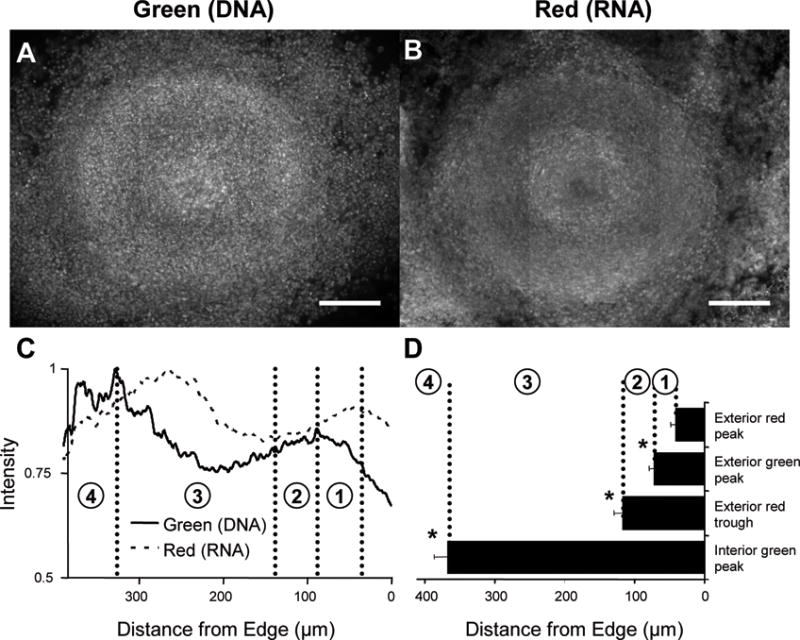
A,B) Typical green (A) and red (B) fluorescence images for a large cylindroid stained with acridine orange. The cylindroid in (A) and (B) was 780μm in diameter and was cultured for 48 hours prior to staining. Bright rings were present at both the periphery and the center. Scale bars are 200μm. C) Bright and dark rings translated into peaks and troughs in radial intensity profiles and were used to classify four cellular regions: between the outside red and green peaks (region 1), between the outside green peak and the red trough (region 2), between the red trough and the interior green peak (region 3), and inside the interior green peak (region 4). All intensities were normalized to maximum values in each image. D) The location of each peak was significantly distinct from its neighbors (*, p<0.05) for all observed cylindroids (n=4).
Nuclear Morphology
Individual nuclei could easily be identified in green high resolution fluorescent images (63×47μm) extracted from the larger tiled image in Figure 3 (Figure 4). Four regions with distinct nuclear morphology were identified at 60, 180, 290 and 360 μm from the cylindroid edge (Figure 4B–E). Nuclei with clear boundaries were present at the periphery of the cylindroid (white arrows, Figure 4B). At greater distance from the edge, the number of nuclei with clear boundaries decreased (white arrows, Figure 4C) until the center of the cylindroid, where no clear nuclear boundaries were visible (Figure 4E). No difference in nuclear morphology was observed between the two outer regions of the cylindroid, despite the obvious differences in nuclear density and fluorescence intensity (Figure 4B & C). The first detectable difference in morphology was the presence of apoptotic bodies (black arrows in Figure 4D) in the bright fluorescence ring around the center of the cylindroids. In the green fluorescence images, apoptotic bodies were smaller than the nuclei of viable cells in the periphery (Figure 4B). In the very center of the cylindroids, the diffuseness of the nuclear material indicated that the nuclei have completely disintegrated and the cells are not viable (Figure 4E). The degraded nuclear material in the necrotic center fluoresced more intensely than viable cells because it was more accessible to acridine orange.
Figure 4. High resolution images identify nuclear morphologies in cylindroids.

A) Four detailed images were selected from regions 1–4 of an equatorial slice through a large AO-stained cylindroid at 60, 180, 290, and 360μm from the periphery. B,C) Nuclei with clear boundaries (white arrows) were present in both regions 1 (B) and 2 (C). C) Nuclear density and green fluorescence intensity decreased from region 1 to region 2. D) Apoptotic bodies (black arrows) are visible and prevalent towards the center of cylindroids in region 3. E) In the center of cylindroids, region 4, nuclear material has degraded and cells are necrotic. Scale bars are 100 (A) and 20μm (B–E).
Single Cell Analysis
The fluorescence intensities of single cells were measured (Figure 5) to determine whether the patterns in radial intensity profiles (Figure 3) were an accurate measurement of cellular RNA and DNA content. There were two possible causes for the bright rings and dark troughs in the intensity profiles: 1) variation in the nucleic content of individual cells or 2) changes in local cell density and nuclear size. The centers of individual nuclei were identified in the high resolution green fluorescence image of four large cylindroids. The analysis of the representative large cylindroid in Figure 3 is shown in Figure 5. The maximum green (Figure 5A) and red (Figure 5B) fluorescence intensities within a 16μm diameter circle around each nucleic center were determined to produce maps of individual cell fluorescence. When binned into 32μm thick annuli (indicated by points in Figures 5C & D), individual cell intensities were functionally identical to the pixel-based radial intensity profiles. The similarity between the pixel-based and individual-cell-based radial intensity profiles demonstrates that the dark and bright rings in the fluorescence images were accurate measurements of cellular nucleic acid content and were not affected by nuclear size or density.
Figure 5. Single-cell analysis of a large cylindroid stained with acridine orange.

A,B) Maximum green (A) and red (B) fluorescence intensities for individual cells. Shading indicates normalized intensity range: low, grey circles (0.45–0.65); middle, open circles (0.65–0.8); and high, filled circles (0.8–1.0). C,D) Comparisons of pixel-based and individual-cell-based radial intensity profiles for green (C) and red (D) fluorescence intensities. Cell intensities were grouped by radius into 32μm bins.
The identification of every nuclei in a cylindroid enabled multiple single-cell measurements as a function of cylindroid radius, including 1) average RNA and DNA content, 2) nuclear density, and 3) nuclear size. The average cellular RNA and DNA content was measured for the outer three regions of a large cylindroid (Figures 3–5) that were 25–61μm (n = 295), 61–157 μm (n = 590), and 157–248 μm (n = 297) from the edge. The spread of cellular fluorescence intensities was large in all three regions (Figure 6A). Cells in region 1 had significantly higher RNA content (p<0.001) and lower DNA content (p<0.001) than region 2 (Figure 6B). This difference was caused primarily by three populations of cells: a metabolically active population in region 1 that had a high RNA content (arrow a in Figure 6A); a quiescent population in region 2 that had a low RNA content (arrow b), and an early apoptotic population in region 2 that had a high green fluorescence (arrow c). In region 3, green fluorescence was less than region 2 (p<0.001) and greater than region 1 (p<0.05), and red fluorescence was greater than region 2 (p<0.001; Figure 6B).
Figure 6. Cell characteristics as a function of radial position.

A) Green and red intensities of individual cells in regions 1–3. Arrows indicate distinct populations within regions. Arrow a indicates a population of cells in region 1 with high RNA content. Arrows b and c indicate populations of cells in region 2 that have low RNA content and high green fluorescence, respectively. B) Average fluorescence in each region. Error bars indicate standard errors of the mean. C,D) Nuclear diameter and density as a function of radius. Both nuclear size (C) and spacing (D) significantly decreased toward the center of cylindroids (p<0.01, n=4).
Single cell analysis of four cylindroids also showed that nuclear diameter and density both significantly decreased toward the center of cylindroids (p<0.001; Figure 6C & D). The average size of the cylindroids was 821±24μm and a total of 1014 nuclei were measured. As noted above, this detected variation in nuclear size and density did not affect the correlation between the pixel-based and individual-cell-based radial intensity profiles. Nuclear diameter ranged from 3 to 17μm and sizes were evenly distributed throughout the cylindroids (Figure 6C). This decrease in nuclear size most likely indicates the early stages of apoptosis, in which nuclear material condenses before it fragments (Martelli et al. 2001; Van Cruchten and Van Den Broeck 2002). The observed decrease in nuclear density could have been caused by an increase in cell size or an increase in extracellular matrix material towards the cylindroid center (Figure 6D). Both the decrease in nuclear size and density indicate a decrease in cell viability and an onset of apoptosis toward the cylindroid center. These effects may have been caused by the thinness of the cylindroids or gradients of essential nutrients and factors.
Distribution of Cell Populations in Cylindroids
The different cell populations in cylindroids were identified (Figure 7) using the radial fluorescence profiles (Figure 3), the changes in nuclear morphology (Figure 4), and the average regional nucleotide concentration (Figure 6). The fluorescence intensities in the different cylindroid regions (Figure 3C) were compared to the relative fluorescent intensities of cell populations analyzed by flow cytometry (Figure 1A). Classification of cells based on radial intensity profiles was more complex than flow cytometry because cell populations in cylindroids overlap and are not separated into discrete groups (Figure 6A). Cell populations in cylindroids change gradually with position and have diffuse rather than discrete boarders. Each cylindroid region contains multiple cell types and represents a transition from one type to another (Figure 7).
Figure 7.

Classification of cell populations in cylindroids
Nuclei in region 1 were distinct and regularly shaped, which is a characteristic of healthy, viable cells (Figure 4). The decrease in cellular RNA content (red fluorescence) as a function of radius indicates a reduction in cellular activity and the onset of quiescence (Bauer et al. 1982; Darzynkiewicz 1983). Therefore, when compared to the flow cytometry analysis of monolayer cells (Figure 1A), fluorescence intensity profiles (Figure 3C) suggest that region 1 contained both cycling (G1/S, S/G2/M) and quiescent (Q) cells and the number of quiescent cells increased with distance from the periphery (Figure 7).
In region 2, nuclei were distinct, indicating that the cells were mostly viable. As a function of radius, the RNA content decreased in this region (Figures 3 & 6), indicating that metabolic activity was continuing to decrease and the region contains a population of quiescent cells. Region 2 also contained a population of cells in the beginning stages of apoptosis. The sequential nuclear changes that characterize apoptosis are chromatin collapse, nuclear condensation, and the eventual complete degradation of the nuclear membrane and material (Martelli et al. 2001; Van Cruchten and Van Den Broeck 2002). Compared to region 1, region 2 had higher average green fluorescence (Figure 6), because more nuclear material was accessible to AO following chromatin collapse (Darzynkiewicz et al. 1992; Martelli et al. 2001). In addition, green fluorescence decreased with radius in region 2 (Figure 3C) indicating the beginning of nuclear condensation (Martelli et al. 2001; Van Cruchten and Van Den Broeck 2002). The decrease in nuclear size observed in region 2 (Figures 4C & 6A) is another indication of the onset of apoptosis. Region 2, therefore, contained viable cells that were becoming more quiescent and progressing through the early stages of apoptosis (Figure 7).
The thickness of the viable rim (117 μm), which is comprised of regions one and two, was in the range of previously reported values (80–200μm; (Freyer and Sutherland 1986; Kim and Forbes 2007). The decrease in cellular activity and increase in quiescence from region 1 to region 2 was consistent with previous reports that showed an increasing fraction of non-proliferating cells toward the center of spheroids (Freyer and Sutherland 1980).
The initial decrease in green fluorescence (Figure 3C) and increase in nuclear spacing (Figures 4C & 6D) in region 3 indicates further degradation of nuclear DNA and progression through the apoptotic process (Figure 7). At the central interior edge of region 3 the appearance of apoptotic bodies is characteristic of the later stages of apoptosis (Figure 4D). Towards the inside edge of region 3, both the red and green fluorescence intensities increased (Figure 3C). In apoptotic and necrotic regions of cylindroids, fluorescence intensities may be increased because of enhanced AO stainability associated with changes in chromatin structure and membrane permeability (Darzynkiewicz 1983; Darzynkiewicz et al. 1992). Compromised cell membranes would allow a higher AO concentration in the cytoplasm and more nucleotide fragments in extracellular matrix that would be more available to staining as apoptosis progresses. The difference in the location of green and red fluorescence peaks (Figure 3C) might be caused by apoptotic events (e.g. DNA denaturation) that have different spatial and temporal effects on nucleotide stainability.
The central region had decreased red and green fluorescence intensities (Figure 3). The complete lack of intact nuclei indicates that the cells in region four were necrotic or in the final stages of apoptosis (Figure 7). The decrease in both fluorescence intensities indicates that nuclear material and cellular membranes were almost completely degraded in this region.
Effects of Cylindroid Size and Culture Time
Cylindroid size and incubation time in the plug device affected the fluorescence intensity patterns (Figure 8A–H) and the distribution of nuclear morphologies (Figure 8I–L). Smaller cylindroids (550μm diameter; Figure 8) did not have the same complexity of fluorescence intensity patterns in the center interior compared to larger cylindroids (>750μm diameter; Figure 3). In small cylindroids that were incubated for 24 hours the green and red fluorescence intensities did not change across the cylindroid diameter (Figure 8D). Small cylindroids that were incubated for 48 hours had a different staining pattern because of the increased time in culture (Figures 8E–H). The centers of these cylindroids were darker in the green fluorescence images (Figure 8E). In pixel-based radial intensity profiles the green fluorescence decreased significantly from the periphery to the center (p<0.05; Figure 8G & H).
Figure 8. Effects of incubation time and cylindroids size on cylindroid cell populations.
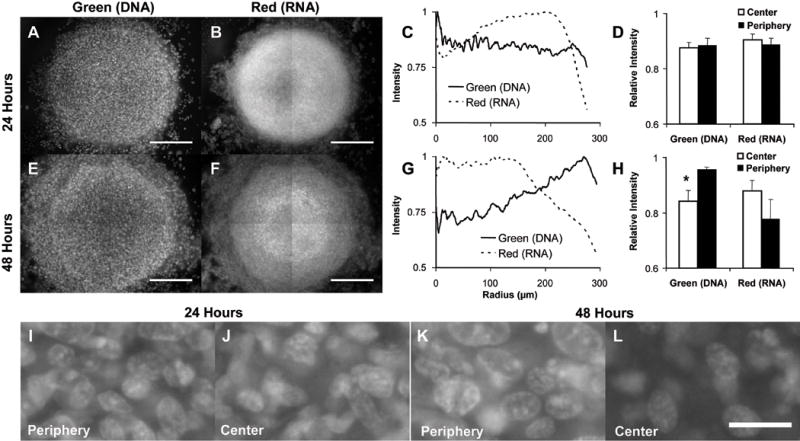
Small cylindroids were incubated for 24 (A–D) and 48 hours (E–H) prior to AO staining. A,B,E,F) Green (A,E) and red (B,F) fluorescence images of representative 532 and 562μm diameter cylindroids. Scale bars are 200μm. C,G) Radial intensity profiles of fluorescent images in (A–B,E–F). Intensities were normalized to maximum values in each image. D) Fluorescence intensities did not change as a function of radius in small cylindroids incubated for 24 hours (n=9). H) Green fluorescence significantly (*, p<0.05) decreased in small cylindroids incubated for 48 hours (n=5). I–L) Nuclear morphology of small cylindroids incubated for 24 (I, J) and 48 (K, L) hours shown at the periphery (I, K) and center (J, L). Scale bar is 20μm.
The morphology of nuclei in small cylindroids was different than in larger cylindroids (Figure 8I–L). Nuclei with clear boundaries were observed in both the periphery and center of cylindroids incubated for 24 and 48 hours (Figure 8I–L), indicating that cells were viable across the entire width. The nuclear density did not change across the width of cylindroids incubated for 24 hours, whereas the density significantly (p<0.05, n=4) dropped from 550±100 to 103±34 nuclei/mm2 from the periphery to the center of cylindroids incubated for 48 hours (Figures 8C & D). The lack of apoptotic bodies in these smaller cylindroids suggests that diffusion distance plays an important role in the onset of apoptosis.
Staining patterns observed in small cylindroids suggest that heterogeneous cell populations were caused by the diffusion of factors that control cellular proliferation and survival. In the second day of culture (from 24 to 48hours), the DNA content in cylindroid centers decreased (Figures 8E & H), indicating the onset of apoptosis. This change may have been triggered by concentration gradients of essential nutrients or growth factors that formed during the second 24 hour period. Compared to large cylindroids (Figures 3–6), small cylindroids did not develop as many distinct cell populations (Figure 8), indicating that distance, as well as time, critically affects diffusion gradients. Dead and dying cells were observed in the center of large and not small cylindroids, suggesting that concentrations of cell survival factors were low enough in the center of small cylindroids to initiate apoptosis but not completely kill cells.
Effects of Nutrient Diffusion and Availability
To understand how diffusion controls cell population differentiation, monolayer and cylindroid cultures were grown in nutrient-deficient media. The results are summarized in Table 1. To determine how nutrient deficiency affected cell populations, monolayer cultures were grown in environments deficient in FBS, glucose, glutamine, and oxygen for 5 days (Figure 9). Flow cytometry and AO staining were used to determine the percentages of cells in four groups: viable (G1/S), proliferating (S/G2/M), quiescent (Q) and apoptotic (Ap). Populations were compared to control cultures grown in complete media (Figure 1A). Cells grown in glutamine-deficient media had significantly more (p<0.05) apoptotic cells and significantly less (p<0.05) quiescent cells (Figures 9B & D). Hypoxic conditions (1% oxygen) significantly increased (p<0.05) the population of quiescent cells (Figures 9C & D). No significant difference was observed between the controls (Figure 1A) and cells grown in glucose-deficient media (Figures 9A & D). Monolayer cultures grown in FBS-deficient media died before the cell populations could be analyzed. No changes were observed in the G1/S and S/G2/M populations under any condition (Figure 9D).
Table 1.
Effects on Nutrient Depletion on Cell and Cylindroid Behavior
| Nutrient/Factor | Monolayer response | Cylindroid response |
|---|---|---|
| Glutamine | Increased apoptosis & decreased quiescence | Central apoptosis |
| FBS | Death before analysis | Central apoptosis |
| Glucose | None | – |
| Oxygen | Increased quiescence | – |
Figure 9. Effect of nutrient depletion on cell populations in monolayer culture.
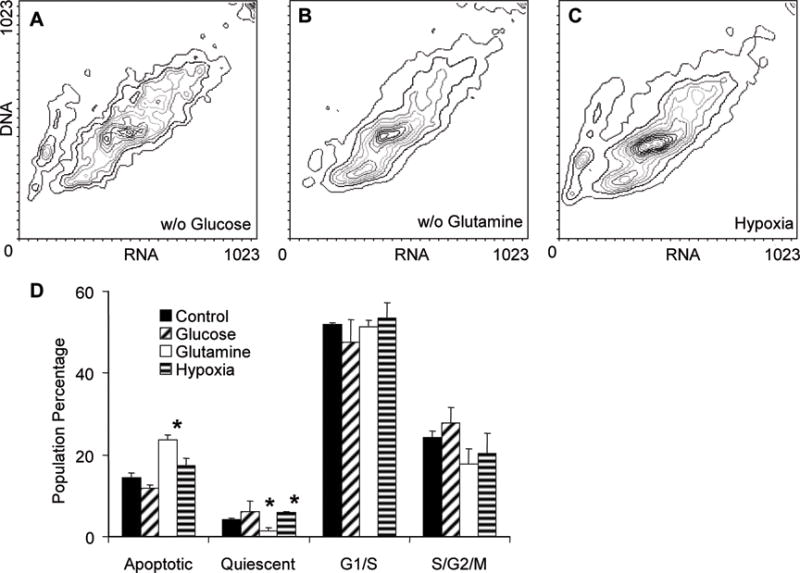
(A–C) Contour plots showing DNA and RNA content measured by flow cytometry in cultures grown in glucose- (A) and glutamine-deficient medium (B) and under hypoxic conditions (C), D) Percentage of cells in viable (G1/S), proliferating (S/G2/M), apoptotic, and quiescent populations. Growth in glutamine-deficient media increased apoptosis and decreased quiescence compared to untreated controls (*, p<0.05). Growth in hypoxia increased quiescence compared to controls (*, p<0.05).
Cylindroids grown in FBS- and glutamine-deficient medium (Figure 10) contained more cell death than control cylindroids grown in complete media (Figures 3–8). After 24 hours in glutamine-deficient media, small cylindroids (420±24 μm) showed signs of apoptosis around the center: decreased nuclear density and nucleotide content (Figure 10A & B, n=7). After 48 hours in glutamine deficient-media (Figure 10D & E), a hole formed in centers of all observed cylindroids that was absent of nuclear material, indicating the onset of late-stage apoptosis. The cylindroid in Figure 10D & E had a diameter of 314μm and the apoptotic region started 107μm from the edge. After growing in FBS-deficient media for 24hrs, apoptotic cells with highly fluorescent apoptotic bodies were prevalent throughout cylindroids (Figure 10J, white arrows). The distance of the apoptotic region to the edge was significantly less in cylindroids grown in both FBS- and glutamine-deficient media than controls (Figure 10K, p<0.05). In figure 10J the apoptotic region is 125μm from the edge. Radial intensity profiles (Figure 10C, F & I) also showed reduced DNA and RNA content around center of cylindroids indicating lower metabolic activity and cell viability.
Figure 10. Morphology of cylindroids grown in glutamine and FBS deficient media.

A,B,D,E) Representative green (A,D) and red (B,E) fluorescence images for small cylindroids grown in glutamine-deficient medium for 24 (A–C) and 48 hours (D–F). C,F) Radial intensity profiles of fluorescent images in (A–B,D–E). At 48 hours a hole appeared in cylindroid centers that was absent of nuclear material. G,H) Representative green (G) and red (H) fluorescence images of a small cylindroid grown in FBS-deficient medium. I) Radial intensity profile for cylindroid in (G,H). J) High resolution section of green fluorescent image in (G) showing apoptotic bodies (white arrows) in the cylindroid center. K) The average distance from the cylindroid edge to the apoptotic region was significantly less (*, p<0.05) for cylindroids grown in FBS (n=4) and glutamine (n=7) deficient media than in controls (n=8). The apoptotic region was identified as a region where greater than 50% of cells contained apoptotic bodies. Scale bars are 200 (A,B,D,E,G,H) and 50μm (J).
The effects of nutrient deficient media in monolayer cultures and in cylindroids provide insight into how diffusion gradients create distinct cell populations in tumors. These results suggest that gradients in glutamine and essential growth factors induce apoptosis and cell death far from nutrient sources, and glucose and oxygen deprivation slows metabolism and induces quiescence. As expected, removal of serum from the medium increased the extent of apoptosis and cell death (Figure 10). Removing glutamine from the media induced apoptosis in both monolayer and cylindroid cultures (Figures 9 & 10). We have shown previously that glutamine is preferentially used for biosynthesis in cancer cells (Forbes et al. 2006). Glutamine-derived biosynthesis is crucial for to maintaining cell growth and homeostasis (Medina 2001; Portais et al. 1996). We have also shown that flux through biosynthetic pathways decreases towards the center of cylindroids (Kim and Forbes 2007). Comparatively, neither hypoxia nor glucose-deficient media induced apoptosis in monolayer cells (Figure 9). On the other hand, lack of oxygen significantly induced quiescence compared to controls (Figure 9). Limited oxygen respiration has been shown to induce quiescence but is not damaging enough to trigger apoptosis (Goda et al. 2003; Seagroves et al. 2001; Walenta et al. 1990). Previous flux results have also shown that glucose is primarily used for cellular energy (Forbes et al. 2006; Kim and Forbes 2007). Combined, the experimental evidence suggests that cellular quiescence is caused predominantly by hypoxia and glucose deprivation, and apoptosis and cell death are predominantly caused by gradients of growth factors and glutamine.
Potential Applications
Single cell analysis of thin cylindroids is a microscopic technique that has numerous advantages over current technology. This method, coupled to AO staining, is non-invasiveness and enables fast and simple characterization of cell populations. In addition, it could easily be scaled for high throughput analysis. One current method of quantifying cell populations in three-dimensional tumor tissue requires physical dissociation of spheroids using protease treatment (Freyer and Sutherland 1980; Mellor et al. 2005), a process which may affect cellular behavior and is difficult correlate with radial position. The advantages of cylindroids over sandwich cultures (Hlatky and Alpen 1985) are that they maintain cell-cell interactions and are able to measure diffusion effects that are present in tumors. The primary limitation of this cylindroid technique is that it can only be used with low molecular weight dyes. Many cell staining techniques use specific antibodies that are too large to easily diffuse through cylindroid tissue.
In addition to the results presented here, this technique has many potential applications. Primarily, cylindroids could be used to quantify the diffusion of experimental therapeutics in tumor tissue. Concentration profiles of fluorescent drugs could be measured as a function of radius. Local compartmentalization, as either intracellular or intranuclear, could be also measured. These measurements would be important because it has been suggested that the rates of clearance and retention have strong effects on drug efficacy (Venkatasubramanian et al. 2008). Staining with AO enables discernment between drugs that induce quiescence and apoptosis and can be used to investigate the response of quiescent cells to therapeutics. Finally, many fluorescent dyes could be used in cylindroids to characterize cell behavior as long as the dyes have a low molecular weight and can easily diffuse through tumor tissue.
Conclusion
We have developed a microscopy technique to measure fluorescence from single cells using thin cylindroids and acridine orange staining. Using this technique, cellular DNA and RNA content was measured as a function of cylindroid radius. Coupled with morphological analysis, four distinct regions were identified: an outer viable/quiescent region; a second quiescent/apoptotic region; a third late-stage apoptotic region; and an inner dead region. Varying incubation time and cylindroid size suggested that diffusion limitations created these heterogeneous cell populations. Flow cytometry showed that absence of glutamine and growth factors induced apoptosis, and hypoxia induced quiescence. Exposing cylindroids to nutrient-deficient media showed that glutamine and growth factor gradients increased cell death in cylindroids. These results show that cellular microenvironments can be identified in cylindroids using simple fluorescence staining techniques. In addition, these results show that the florescence of single cells can be measured in three-dimensional culture. These techniques will be valuable for determining how cancer therapeutics diffuse and induce cell death in tumor tissue, and will be useful in the development of novel drugs and delivery systems.
Acknowledgments
We would like to thank Dr. Randall Johnson at the University of California, San Diego, for the gift of the mouse embryonic fibroblast cells, and we would like to thank the National Institute of Health (Grant No. 1 R21 CA112335-01A1), and the National Science Foundation (Grant No. DMI-0531171) for financial support of this project.
References
- Alam S, Sen A, Behie LA, Kallos MS. Cell cycle kinetics of expanding populations of neural stem and progenitor cells in vitro. Biotechnol Bioeng. 2004;88(3):332–47. doi: 10.1002/bit.20246. [DOI] [PubMed] [Google Scholar]
- Bauer KD, Keng PC, Sutherland RM. Isolation of quiescent cells from multicellular tumor spheroids using centrifugal elutriation. Cancer Res. 1982;42(1):72–8. [PubMed] [Google Scholar]
- Brown JM, Giaccia AJ. The unique physiology of solid tumors: opportunities (and problems) for cancer therapy. Cancer Res. 1998;58(7):1408–16. [PubMed] [Google Scholar]
- Darzynkiewicz Z. Molecular interactions and cellular changes during the cell cycle. Pharmacol Ther. 1983;21(2):143–88. doi: 10.1016/0163-7258(83)90071-2. [DOI] [PubMed] [Google Scholar]
- Darzynkiewicz Z. Simultaneous analysis of cellular RNA and DNA content. Methods Cell Biol. 1994;41:401–20. doi: 10.1016/s0091-679x(08)61731-8. [DOI] [PubMed] [Google Scholar]
- Darzynkiewicz Z, Bruno S, Del Bino G, Gorczyca W, Hotz MA, Lassota P, Traganos F. Features of apoptotic cells measured by flow cytometry. Cytometry. 1992;13(8):795–808. doi: 10.1002/cyto.990130802. [DOI] [PubMed] [Google Scholar]
- Darzynkiewicz Z, Traganos F, Melamed MR. New cell cycle compartments identified by multiparameter flow cytometry. Cytometry. 1980;1(2):98–108. doi: 10.1002/cyto.990010203. [DOI] [PubMed] [Google Scholar]
- Forbes NS, Meadows AL, Clark DS, Blanch HW. Estradiol stimulates the biosynthetic pathways of breast cancer cells: detection by metabolic flux analysis. Metab Eng. 2006;8(6):639–52. doi: 10.1016/j.ymben.2006.06.005. [DOI] [PubMed] [Google Scholar]
- Freyer JP, Sutherland RM. Selective dissociation and characterization of cells from different regions of multicell tumor spheroids. Cancer Res. 1980;40(11):3956–65. [PubMed] [Google Scholar]
- Freyer JP, Sutherland RM. Regulation of growth saturation and development of necrosis in EMT6/Ro multicellular spheroids by the glucose and oxygen supply. Cancer Res. 1986;46(7):3504–12. [PubMed] [Google Scholar]
- Goda N, Ryan HE, Khadivi B, McNulty W, Rickert RC, Johnson RS. Hypoxia-inducible factor 1alpha is essential for cell cycle arrest during hypoxia. Mol Cell Biol. 2003;23(1):359–69. doi: 10.1128/MCB.23.1.359-369.2003. [DOI] [PMC free article] [PubMed] [Google Scholar]
- Hlatky L, Alpen EL. Two-dimensional diffusion limited system for cell growth. Cell Tissue Kinet. 1985;18(6):597–611. doi: 10.1111/j.1365-2184.1985.tb00703.x. [DOI] [PubMed] [Google Scholar]
- Jain RK. The next frontier of molecular medicine: delivery of therapeutics. Nat Med. 1998;4(6):655–7. doi: 10.1038/nm0698-655. [DOI] [PubMed] [Google Scholar]
- Kasinskas RW, Forbes NS. Salmonella typhimurium specifically chemotax and proliferate in heterogeneous tumor tissue in vitro. Biotechnol Bioeng. 2006;94(4):710–21. doi: 10.1002/bit.20883. [DOI] [PubMed] [Google Scholar]
- Kasinskas RW, Forbes NS. Salmonella typhimurium lacking ribose chemoreceptors localize in tumor quiescence and induce apoptosis. Cancer Res. 2007;67(7):3201–9. doi: 10.1158/0008-5472.CAN-06-2618. [DOI] [PubMed] [Google Scholar]
- Kim BJ, Forbes NS. Flux analysis shows that hypoxia-inducible-factor-1-alpha minimally affects intracellular metabolism in tumor spheroids. Biotechnol Bioeng. 2007;96(6):1167–82. doi: 10.1002/bit.21205. [DOI] [PubMed] [Google Scholar]
- Kim JJ, Tannock IF. Repopulation of cancer cells during therapy: an important cause of treatment failure. Nat Rev Cancer. 2005;5(7):516–25. doi: 10.1038/nrc1650. [DOI] [PubMed] [Google Scholar]
- Martelli AM, Zweyer M, Ochs RL, Tazzari PL, Tabellini G, Narducci P, Bortul R. Nuclear apoptotic changes: an overview. J Cell Biochem. 2001;82(4):634–46. doi: 10.1002/jcb.1186. [DOI] [PubMed] [Google Scholar]
- Medina MA. Glutamine and cancer. J Nutr. 2001;131(9 Suppl):2539S–42S. doi: 10.1093/jn/131.9.2539S. discussion 2550S–1S. [DOI] [PubMed] [Google Scholar]
- Mellor HR, Ferguson DJ, Callaghan R. A model of quiescent tumour microregions for evaluating multicellular resistance to chemotherapeutic drugs. Br J Cancer. 2005;93(3):302–9. doi: 10.1038/sj.bjc.6602710. [DOI] [PMC free article] [PubMed] [Google Scholar]
- Mueller-Klieser W. Tumor biology and experimental therapeutics. Crit Rev Oncol Hematol. 2000;36(2–3):123–39. doi: 10.1016/s1040-8428(00)00082-2. [DOI] [PubMed] [Google Scholar]
- Netti PA, Berk DA, Swartz MA, Grodzinsky AJ, Jain RK. Role of extracellular matrix assembly in interstitial transport in solid tumors. Cancer Res. 2000;60(9):2497–503. [PubMed] [Google Scholar]
- Pellicciari C, Mangiarotti R, Bottone MG, Danova M, Wang E. Identification of resting cells by dual-parameter flow cytometry of statin expression and DNA content. Cytometry. 1995;21(4):329–37. doi: 10.1002/cyto.990210404. [DOI] [PubMed] [Google Scholar]
- Portais JC, Voisin P, Merle M, Canioni P. Glucose and glutamine metabolism in C6 glioma cells studied by carbon 13 NMR. Biochimie. 1996;78(3):155–64. doi: 10.1016/0300-9084(96)89500-9. [DOI] [PubMed] [Google Scholar]
- Seagroves TN, Ryan HE, Lu H, Wouters BG, Knapp M, Thibault P, Laderoute K, Johnson RS. Transcription factor HIF-1 is a necessary mediator of the pasteur effect in mammalian cells. Mol Cell Biol. 2001;21(10):3436–44. doi: 10.1128/MCB.21.10.3436-3444.2001. [DOI] [PMC free article] [PubMed] [Google Scholar]
- Siu WY, Arooz T, Poon RY. Differential responses of proliferating versus quiescent cells to adriamycin. Exp Cell Res. 1999;250(1):131–41. doi: 10.1006/excr.1999.4551. [DOI] [PubMed] [Google Scholar]
- Sutherland RM. Cell and environment interactions in tumor microregions: the multicell spheroid model. Science. 1988;240(4849):177–84. doi: 10.1126/science.2451290. [DOI] [PubMed] [Google Scholar]
- Sutherland RM, Durand RE. Growth and cellular characteristics of multicell spheroids. Recent Results Cancer Res. 1984;95:24–49. doi: 10.1007/978-3-642-82340-4_2. [DOI] [PubMed] [Google Scholar]
- Tannock IF. Tumor physiology and drug resistance. Cancer Metastasis Rev. 2001;20(1–2):123–32. doi: 10.1023/a:1013125027697. [DOI] [PubMed] [Google Scholar]
- Tannock IF, Lee CM, Tunggal JK, Cowan DS, Egorin MJ. Limited penetration of anticancer drugs through tumor tissue: a potential cause of resistance of solid tumors to chemotherapy. Clin Cancer Res. 2002;8(3):878–84. [PubMed] [Google Scholar]
- Tredan O, Galmarini CM, Patel K, Tannock IF. Drug resistance and the solid tumor microenvironment. J Natl Cancer Inst. 2007;99(19):1441–54. doi: 10.1093/jnci/djm135. [DOI] [PubMed] [Google Scholar]
- Van Cruchten S, Van Den Broeck W. Morphological and biochemical aspects of apoptosis, oncosis and necrosis. Anat Histol Embryol. 2002;31(4):214–23. doi: 10.1046/j.1439-0264.2002.00398.x. [DOI] [PubMed] [Google Scholar]
- Venkatasubramanian R, Henson MA, Forbes NS. Incorporating energy metabolism into a growth model of multicellular tumor spheroids. J Theor Biol. 2006;242(2):440–53. doi: 10.1016/j.jtbi.2006.03.011. [DOI] [PubMed] [Google Scholar]
- Venkatasubramanian R, Henson MA, Forbes NS. Incorporating cell cycle progression and drug penetration into metabolic models of multicellular tumor spheroid growth. Journal of Theoretical Biology. 2008 doi: 10.1016/j.jtbi.2008.02.016. [DOI] [PMC free article] [PubMed] [Google Scholar]
- Walenta S, Dotsch J, Mueller-Klieser W. ATP concentrations in multicellular tumor spheroids assessed by single photon imaging and quantitative bioluminescence. Eur J Cell Biol. 1990;52(2):389–93. [PubMed] [Google Scholar]
- Wallen CA, Higashikubo R, Dethlefsen LA. Murine mammary tumour cells in vitro. I. The development of a quiescent state. Cell Tissue Kinet. 1984a;17(1):65–77. doi: 10.1111/j.1365-2184.1984.tb00569.x. [DOI] [PubMed] [Google Scholar]
- Wallen CA, Higashikubo R, Dethlefsen LA. Murine mammary tumour cells in vitro. II. Recruitment of quiescent cells. Cell Tissue Kinet. 1984b;17(1):79–89. doi: 10.1111/j.1365-2184.1984.tb00570.x. [DOI] [PubMed] [Google Scholar]