

Abstract
Non-covalent incorporation of hydrophobic drugs into polymeric systems is a commonly-used strategy for drug delivery because non-covalent interactions minimize modification of the drug molecules whose efficacy is retained upon release. The behaviors of the drug-polymer delivery system in the biological environments it encounters will affect the efficacy of treatment. In this report, we have investigated the interaction between a hydrophobic drug and its encapsulating polymer in model biological environment using a photosensitizer encapsulated in a polymer-coated nanoparticle system. The photosensitizer, 3-(1′-hexyloxyethyl)-3-devinylpyropheophorbide-a (HPPH), was non-covalently incorporated to the poly(ethylene glycol) (PEG) layer coated on Au nanocages (AuNCs) to yield AuNC-HPPH complexes. The non-covalent binding was characterized by Scatchard analysis, fluorescence lifetime, and Raman experiments. The dissociation constant (Kd) between PEG and HPPH was found to be ~35 μM with a maximum loading of ~2.5 × 10⁵ HPPHs/AuNC. The release was studied in serum mimetic environment and in vesicles that model human cell membranes. The rate of protein-mediated drug release decreased when using a negatively-charged or cross-linked terminus of the surface-modified PEG. Furthermore, the photothermal effect of AuNCs can initiate burst release, and thus allow control of the release kinetics, demonstrating on-demand drug release. This study provides insights regarding the actions and release kinetics of non-covalent drug delivery systems in biological environments.
Keywords: gold nanostructure, drug delivery, PEG coating, controlled release
Graphical abstract

Introduction
Controlled release systems for drug delivery using nanocarriers have been developed and studied for more than three decades.1 Au nanostructures have been used as drug delivery vehicles in chemotherapy because of their biocompatibility, facile surface modification, and robust optical properties.2–8 While drug molecules can be covalently immobilized on the nanoparticles’ surface,2,8–10 non-covalent interactions are particularly appealing because they minimize modification of the drug molecules, whose efficacy is then largely retained upon release. Several strategies have been developed to non-covalently tether molecules through electrostatic and hydrophobic interactions to polymer-coated nanoparticles, which include wrapping into layer-by-layer assembled polyelectrolytes,11 entrapping in a polymer monolayer,12–14 encapsulating into a phospholipid bilayer,15 and absorbing into a hydrogel.16 Among these methods, poly(ethylene glycol) (PEG) coated nanoparticles are advantageous because PEG used widely in the pharmaceutical industry is generally nontoxic and possesses antifouling properties well-suited for increasing circulation half-life and minimizing immunological clearance.17 The graft density of PEG was found to significantly affect the biological fate of the particles.18 Hydrophobic phthalocyanine photosensitizers19–21 or anti-cancer drugs22,23 have been delivered within the surface PEG layer or inside the hydrophobic pocket for photodynamic therapy or chemotherapy. We recently applied a similar system to deliver a hydrophobic porphyrin-derivative (3-(1′-hexyloxyethyl)-3-devinylpyropheophorbide-a, HPPH, structure shown in Fig. 1A) for image-guided photodynamic therapy with enhanced efficacy.14
Figure 1.

(A) Structure of HPPH. Normalized UV-vis-NIR spectra of AuNC (B) before and (C) after loading with HPPH. Inset shows TEM image of AuNCs with a 50 nm scale bar. (D) Fluorescence spectra of HPPH-loaded AuNCs, before (green) and after (red) KCN digestion of AuNCs.
In this work, we systematically investigate the binding affinity and the release kinetics of HPPH from PEG-coated Au nanocages (AuNCs) to further elucidate the behavior of the drug-polymer delivery system. The induced-dipole/induced-dipole interactions between the pheophorbide and the PEG backbone serve as the driving force to load molecules into the PEG layer.24 HPPH is stably integrated within the PEG coating of AuNC-HPPH in saline solution. The release itself is mediated by either serum proteins (specifically albumin in our model) or cell membranes (modelled here with vesicles). The serum proteins unloaded the drug over several hours and the release of entrapped molecules can be endogenously controlled by the charge and functionality of the PEG terminus. Additionally, the release rate can be exogenously controlled by utilizing the photothermal (PT) effect of Au nanostructures which allows external and temporal control of the drug release by non-invasive near-infrared light.25–27,11,28 By manipulating these variables, we are able to demonstrate on-demand unloading of the drug with minimal premature loss and were able to suggest the relative affinity of the drug for soluble proteins versus cell membranes.
METHODS
Incorporation of HPPH to AuNC-PEG to form AuNC-HPPH complexes
HPPH (7 mg, 11 μmol) was dissolved in 2.5 mL DMSO at a concentration of 4.5 mM as stock solution. This stock solution (0.25 mL) was diluted in 4 mL of phosphate buffered saline (PBS) via dropwise addition in an ice bath to a concentration of ~183 μM. The diluted HPPH solution was flushed with Ar for 5 min and allowed to mix for 5 additional min. The AuNC-PEG suspension (3 nM, 2 mL) was added dropwise to the HPPH solution. The reaction was allowed to stir overnight under the protection of Ar in the dark. The product containing non-covalently incorporated HPPH on AuNC-PEG was then washed with three cycles of centrifugation (14,000 RPM, 15 min, 20 °C) and redispersed in PBS with a final AuNC concentration of 6 nM. The loaded HPPH can be fully released from complexes by methanol.
Cross-linking of AuNC-HPPH complexes
AuNC-PEG-NH3 +was incorporated with HPPH to a concentration of ~2.5 × 10⁴ HPPHs/AuNC using the above procedure. PEG250 (PEG with M.W. = 250), a diacidic cross-linker, was dispersed in borate buffer (pH = 9) in an ice bath with stirring to a concentration of 2.0 mM (4.2 μmol, 1.0 mg). To this 2 mL solution, EDC (7.8 μmol, 1.2 mg) and NHS (10.4 μmol, 1.2 mg) were added. The solution was then flushed with Ar for 20 min. AuNC-HPPH solution (0.2 mL) was added dropwise into the solution. The reaction was allowed to stir overnight in the dark under the protection of Ar. The product was recovered by two centrifugation cycles (14,000 RPM, 15 min, 20 °C) and redispersed in PBS.
Preparation of Lipid Vesicles
1,2-dimyristoyl-sn-glycero-3-phosphocholine (DMPC, 75 μmol) and 1,2-dimyristoyl-sn-glycero-3-phospho-(1′-rac-glycerol) (DMPG, 25 μmol) were dissolved in 5 mL chloroform to yield a 20 mM lipid solution. The solvent was removed under high vacuum overnight. The lipids were hydrated in 5 mL PBS with vigorous shaking for 2 h, following by 2 h in the bath sonicator, until the solution was no longer turbid. Lipid vesicles were stored at 4 °C under Ar.
Study of HPPH release kinetics
Recovered fluorescence was used to monitor the release kinetics of HPPH from AuNC-HPPH complexes. Typically, AuNC-HPPH was diluted in PBS or BSA in PBS (4 % w/w, ~575 μM) at a final concentration of 0.1 nM AuNC. Fluorescence measurements were acquired after the dilution at various intervals throughout a 32 h period using λex = 605 nm and λem = 668 nm. Samples were kept at room temperature, in the dark, without stirring or unnecessary agitation between measurements. At the end of the data acquisition, 10 μL of 0.5 M aqueous KCN was added to dissolve AuNCs and the fluorescence spectrum was acquired to determine the maximum (100%) HPPH signal for the sample. PBS samples were monitored using supernatant absorbance at various times following centrifugation. After measurement, the pellet was redispersed in the original supernatant.
To test the PT effect on the release kinetics, an 808-nm diode laser (Power Technology) was used to irradiate the suspension of AuNC-HPPH complexes. The laser intensity was adjusted to a power density of 1 W/cm2 by changing the spot size to maintain the temperature at ~46 °C. The fluorescence measurement was taken at different time periods over the course of 2 h irradiation, and irradiation began within 10 s of introduction of sample into BSA. On-demand release was demonstrated using 5 min irradiation pulses followed by 10 min without irradiation.
RESULTS AND DISCUSSION
The AuNC-HPPH complexes were prepared according to our previously-reported method by covalently attaching HS-PEG-X to the nanoparticle surface and subsequently encapsulating HPPH into the PEG coating.14 AuNCs with an average exterior edge length of 53 ± 8 nm and interior edge length of 41 ± 6 nm measured from TEM were synthesized for this study. After their surface was coated with HS-PEG-NH3+, the LSPR of the AuNCs was centered at 801 nm (Fig. 1B), slightly red-shifted from the LSPR of the “bare” AuNCs at 798 nm (Fig. S1A). This LSPR maximum falls within the tissue transparent window and overlaps the 808 nm wavelength of the diode laser utilized for PT release. Figure 1C shows the spectral changes after loading; the LSPR of AuNCs was further red-shifted to 829 nm, which is attributed to a change in the refractive index of the local surface environment.29 The peaks at 512, 545, 617, and 669 nm are attributed to absorption by the HPPH molecules (Fig. S1B). The concentration of AuNCs was calculated by the metal concentration from flame atomic absorbance spectroscopy and size information from TEM analysis. The extinction coefficient of AuNCs was derived based on Beer’s Law to be 1×1010 cm−1M−1 (Fig. S2A). The fluorescence was quenched after loading due to static/contact quenching in the HPPH, nanometal surface energy transfer, incident light being absorbed by the AuNCs, or a combination thereof.30–33 After the AuNCs were digested by KCN, the fluorescence was recovered, and then quantified by comparison to the calibration curve (Figs. 1D, S2B).
The concentration of HPPH was determined by UV-vis spectroscopy based on its absorption coefficient in methanol εHPPH, 669 nm ≈ 4.0 × 10⁴ M−1 cm−1. The incorporated HPPH per AuNC is readily changed by adjusting the ratio of HPPH to AuNC in the reaction. The loaded concentration of HPPH increased to a maximum on the order of 105 HPPHs per AuNC. As the loading increased, the hydrodynamic diameter (dH) slightly increased from 98.7 ± 0.9 to 105.3 ± 2.8 nm while the zeta potential decreased from +6.4 ± 0.5 to −26.3 ± 0.8 mV (Fig. 2A). The decrease of zeta potential is likely due to the increasing amount of negatively-charged HPPH in the complexes. The dH remained more or less constant, suggesting that HPPH was mostly entangled within the PEG layer on the nanocage surface rather than aggregating on top of the coating. Earlier theoretical work predicted that the addition of PEG to a solution of hematoporphyrin resulted in concentration-dependent porphyrin deaggregation and association with the PEG chains through strong interaction between the –CH2CH2– region of the PEG chain and the porphyrin ring.24
Figure 2.
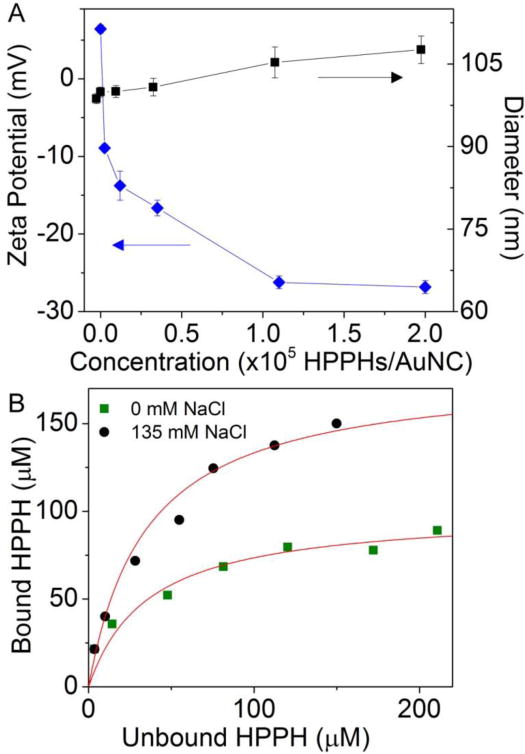
(A) Zeta potential (diamonds) and hydrodynamic diameter (squares) as measured by DLS for AuNC-HPPH at varying ratios of HPPH to AuNC. (B) Saturation binding isotherm between HPPH and the PEG coating on AuNC surface, AuNC concentration (1 nM) using 0 mM (squares) or 135 mM (circles) NaCl in 10 mM phosphate buffer (pH = 7.4). The red line indicates the fitting using the equation Lb = N × Lu/ (Kd,ns + Lu).
The hydrophobic interaction between PEG and HPPH was further confirmed by studying the binding affinity. Increasing amounts of HPPH were introduced to phosphate buffer (10 mM, pH 7.4) with 0 or 135 mM NaCl at a AuNC-PEG concentration of 1 nM. After incubation overnight, the unbound HPPH concentration was determined by the absorbance at 669 nm upon removal of AuNCs by centrifugation. The bound HPPH (Lb) was taken to be the difference between the total (Lt) and the unbound HPPH (Lu) concentration. No loss of HPPH was seen in the absence of AuNCs. A saturation binding isotherm (Fig. 2B) was developed, and Scatchard analysis results in a plot that is both hyperbolic and concave up, consistent with nonspecific binding between PEG and HPPH.34 The data were fitted to the equation Lb = N × Lu/ (Kd,ns + Lu), where Kd,ns is the dissociation constant for nonspecific binding and N is a constant loosely related to the number of available binding sites.35 Based on the fitting, the Kd,ns was determined to be 3.2 × 10⁻⁵ M and 3.7 × 10⁻⁵ M in 0 mM and 135 mM NaCl, respectively, which is similar to simulation results on similar molecules;24 the respective N values increased from ~100 to ~180. These data suggest that the ionic strength does not enhance binding between HPPH and PEG, but makes available additional binding sites and/or screens electrostatic repulsion, increasing the packing density of HPPH. The presence of aqueous ions significantly increased the available binding sites of PEG and HPPH due to a further exposure of –CH2CH2– of PEG to the porphyrin ring of HPPH, which ultimately caused a near doubling the N value. Moreover, the loaded HPPH reached a maximum at ~2.5 × 10⁵ HPPHs/AuNC, indicating that a finite space was available for loading within the PEG layer on the nanocage surface.
The fluorescent properties of HPPH inside the PEG layer on the AuNCs were examined by fluorescence lifetime measurements (Fig. 3A). Due to quenching, the quantum yields were very low, but a weak signal was present that was able to be picked up using the microscope setup. The HPPH lifetime (τavg) for AuNC-HPPH was measured to be 1.39 ns, comparable to that in PBS (1.51 ns) and appreciably shorter than in methanol (6.55 ns) or BSA (7.21 ns). Even when the loading concentration was reduced to 5 × 10³ HPPHs per AuNC, the lifetime increased only slightly to 2.69 ns. These data suggest that the HPPH molecules in AuNC-HPPH are in close proximity to each other, similar to the small aggregates that have been generated in PBS.36 The proximity of HPPH to the AuNC surface was further characterized by Raman spectroscopy (Fig. 3B). Raman spectra were acquired at excitation wavelength of 488 nm and the signal intensities were compared for different forms of HPPH at a concentration of 100 nM. The samples include free HPPH, AuNC-HPPH (5 × 10³ HPPHs per AuNC), and AuNC-HPPH (1 × 10⁵ HPPHs per AuNC). The peak at 1641 cm−1 was assigned to the weak Raman signal from water. The C–H peaks at ~2950 cm−1 in these spectra likely originate from the PEG as the intensity does not change with the HPPH concentration. The broad, Gaussian region from 2000 to 2500 cm−1 (540–555 nm) in the free HPPH was attributed to weak fluorescence of HPPH. The high loading concentration gave rise to a typical Raman peak at 1590 cm−1 that corresponds to the vibration of aromatic bonds in the macrocycle,37 suggesting that the pheophorbide ring is oriented somewhat perpendicularly to the surface of the metal.38 At low concentration, the Raman signature disappeared and was replaced by a broad fluorescence peak centered at 2340 cm−1. These data suggest that HPPH may be driven deeper in the coating and closer to the metal surface at higher concentrations, highlighting that HPPHs were densely packed within the PEG layer.
Figure 3.

(A) Fluorescence lifetime measurements of HPPH under various conditions: dispersed in methanol (violet), 4% w/w BSA solution (blue), PBS (green) and as AuNC-HPPH in PBS loaded at 5000 HPPHs/AuNC (red) and 105 HPPHs/AuNC (cyan). (B) Raman spectra of 100 nM HPPH under various conditions: (a) free HPPH, (b) AuNC-HPPH (~5000 HPPHs/AuNC, 20 pM AuNC), and (c) AuNC-HPPH (~105 HPPHs/AuNC, 1 pM AuNC); spectra were acquired over 300 s using 488 nm excitation.
The release of the drug was monitored in a serum-mimetic environment to simulate intravenous injection (Fig. 4A).39 Fluorescence gradually recovered over 32 h when incubated in 4 wt % BSA (~600 μM, 37 °C, pH = 7.4).40 As a control, AuNC-HPPH was also incubated in PBS, and release was monitored using supernatant absorbance at various times compared to the maximum. It was found that 86.3 ± 7.6 % of HPPH had been unloaded in the BSA solution within 24 h, but only 4.7 ± 2.1 % of the payload had unloaded in PBS. PEG monolayers are known to resist formation of a “hard” (nonremovable) protein corona,41,42 therefore the release is attributable to the formation of the “soft” protein corona, which entails rapid adsorption and desorption of serum proteins on the PEG surface.43,44 During this transient event, BSA presumably binds HPPH, which then desorbs with the protein. The Kd,ns of PEG-HPPH complexes is on the order of 10−5 M, much larger than the typical Kd values of BSA-porphyrin complexes (~10−9 M),45,46 ergo it would be energetically favorable for BSA to bind HPPH, releasing it from the PEG.
Figure 4.
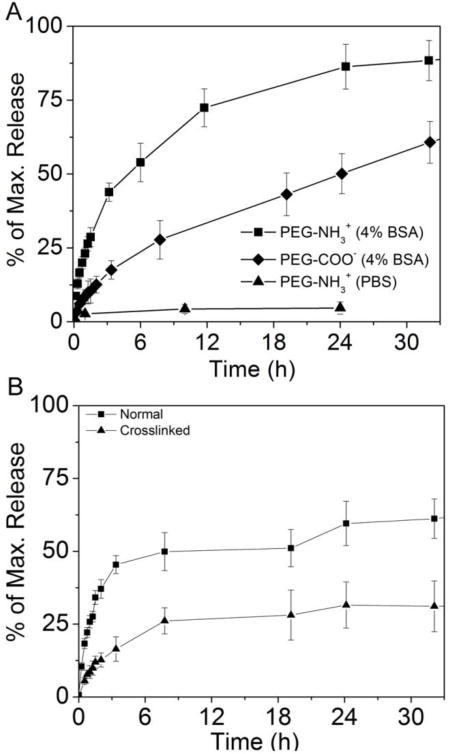
(A) Comparison of HPPH release kinetics at pH = 7.4, 37 °C for AuNC-HPPH using PEG-NH3+ (squares) and PEG-COO− (diamonds) with 4% w/w BSA in PBS, and in only PBS (triangles). (B) Comparison of HPPH release kinetics from AuNC-HPPH without (squares) and with (triangles) cross-linking of the polymer terminus (-NH2) by HOOC-PEG250-COOH. Maximum (100%) values were determined by the recovered fluorescence signal after the AuNCs were digested by KCN.
The PEG terminus was changed by conjugating AuNCs to either amine- or carboxylate-terminated PEG prior to HPPH loading (AuNC-HPPH and AuNCCOO-HPPH, respectively), which was found to significantly affect the kinetics of HPPH release. Replacing cationic (NH3+) with anionic (COO−) termini, resulted in slower unloading kinetics with only 50.1 ± 6.8 % release within 24 h. Because the isoelectric point of BSA is 4.7, it is negatively charged at pH of 7.4, and should be repelled by the carboxylate terminus of the PEG,47 which in turn slows the unloading of HPPH. The release rate could be further retarded by cross-linking the termini of the PEGs on the surface (Fig. 4B). Amide coupling between the cross-linker, HOOC-PEG250-COOH (3–4 repeating units, M.W. = 250 Da), and the NH3+ terminus of the PEG resulted in steric hindrance that blocked protein binding. Cross-linking with PEG250 resulted in a dramatic reduction of the HPPH release to only 31.1 ± 8.7 % within 32 h as compared to the release of 61.2 ± 6.8 % for the noncross-linked system. Similar steric hindrance was observed with block-copolymeric micelles wherein crosslinking was prevented further from the water-polymer interface.48
Ideally, AuNC-HPPH is anticipated to unload the HPPH in the tumor cell membrane for maximal photodynamic effect due to the short lifetime of singlet oxygen. Vesicles were prepared with a 3:1 mole ratio of DMPC and DMPG to mimic the composition of human cell membranes. Incorporation of HPPH in the vesicle membrane (1 mM lipid solution) leads to recovery of its fluorescence; therefore the release could be monitored similarly to BSA solutions. The release of HPPH to the vesicle solution was compared for free HPPH and AuNC-HPPH (Fig. 5). Similar to the BSA solution, ~90 % of the HPPH unloaded from AuNC-HPPH after 24 h. It is worth noting that unlike tumor cells, the vesicles were free in solution and could interact freely with suspended particles, artificially inflating the kinetics of the process. Interestingly, free HPPH did not reach its maximum signal until between 2 and 4 h incubation in the vesicle solution, whereas the BSA solution of free HPPH reached a maximum within 10 min. These results imply that kinetics of HPPH adsorption is much more rapid for BSA than for the cell membrane. However, the ultimate release amount of HPPH from AuNC-HPPH is comparable for both systems, which suggests that diffusion is a major determining factor in release. As such, following intravenous injection HPPH would be less likely to be bound by BSA when delivered as AuNC-HPPH than free HPPH. Additionally, because of its accumulation in tumors,14 AuNC-HPPH would likely deliver a larger HPPH dose to the cell membrane itself.
Figure 5.
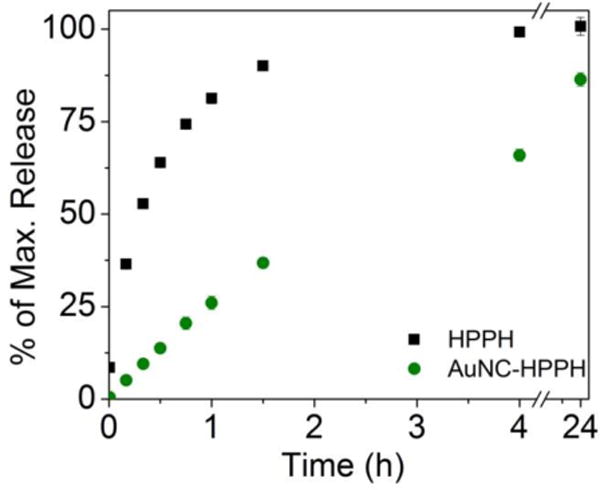
Kinetics of incorporation of HPPH into vesicles using free HPPH (squares) and AuNC-HPPH (circles).
The release could be further controlled with PT heating by the AuNCs (Fig. 6). Under NIR irradiation by a diode laser (1 W/cm2 at 808 nm) that overlaps with the LSPR, the solution temperature was held at 46 °C for 2 h.49,50 In the dark, only 26.2 ± 6.7 % of the payload was released from the PEG layer after two hours. The slow release profile should provide enough time for the AuNC-HPPH to accumulate in the tumor prior to unloading, as demonstrated in our previous in vivo study.14 Irradiation led to localized heating, which presumably increased the fluidity of the PEG/HPPH layer, enabling HPPH to rapidly diffuse to the interface and interact with BSA. We speculate that this change might be the result of disruption of the hydration of the PEG51 and/or partial collapse of the PEG layer,52 increasing molecular motion due to thermal energy. A linear burst release (69.2 ± 5.0 %) in the first 45 min was observed, after which the release proceeded gradually, only reaching ~75 % when the study terminated after two hours. The residual HPPH is unlikely to be trapped within the nanocage void because the loading capacity of AuNCs by diffusion to their interiors was ~100 HPPHs/AuNC (Fig. S3), which accounted for only 0.1 % of the total loaded HPPH. Thus, the remaining HPPH may have been buried too deeply within the PEG layer to have interacted with BSA for release.
Figure 6.
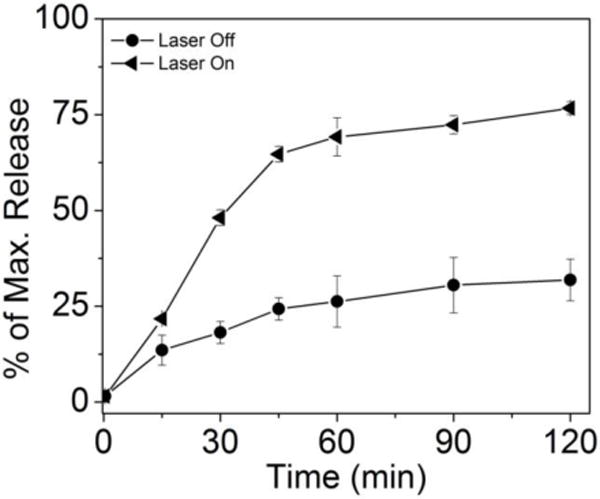
Comparison of HPPH release kinetics from AuNC-HPPH under irradiation by 808 nm diode laser at 1 W/cm2 (triangles), and from AuNC-HPPH at 37 °C in the dark (circles). Maximum (100%) values were determined by the recovered fluorescence signal after the AuNCs were digested by KCN.
A finer measure of control was achieved using brief pulses of irradiation, and little release was observed during the dark time. The controlled release profiles are shown in Figure 7A, and the change in temperature of equimolar AuNCs in PBS is shown in Figure 7B. The suspension temperature rose from 37 °C to 46 °C during the 5 min irradiation period and returned to 37 °C during the 10 min dark time. AuNCCOO-HPPH and AuNC-HPPH were separately incubated in BSA for 5 min prior to the first irradiation. During the first laser pulse roughly 20 and 30 % of the respective payloads were released, and only a further 5 % released in the dark time that followed. The second pulse resulted in 15 and 20 % of the respective payloads being released, and the final pulse released ~10 % of the payload. Ultimately, ~60 % and ~80 % of the payload was released from AuNCCOO-HPPH and AuNC-HPPH, respectively. Faster release was observed for AuNC-HPPH than AuNCCOO-HPPH, similar to the dark release (Fig. 7A). Both samples demonstrated similar capacity for on-demand release, though AuNCCOO-HPPH seemed to be more responsive to the irradiation. The slow release observed in the absence of irradiation suggests that little premature leakage would occur during transport from the injection site to the tumor, but the extensive, controllable release of the payload suggests that extensive unloading can be accomplished quickly within the tumor. Furthermore, release was achieved using photothermally therapeutic temperatures, suggesting that photothermal unloading could provide the benefits of both PT therapy and on-demand drug delivery.
Figure 7.
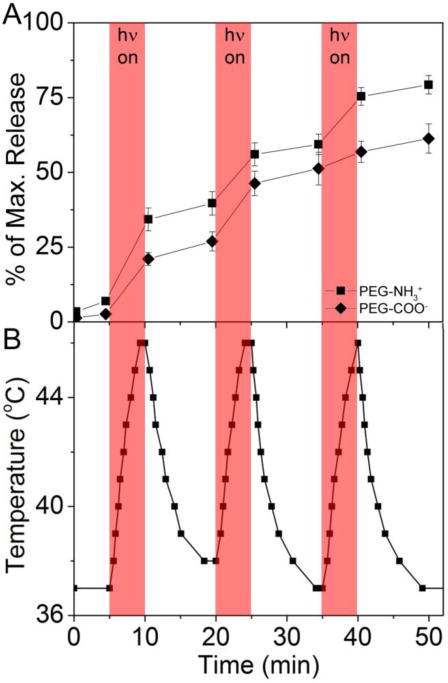
(A) On-demand release of HPPH from AuNC-HPPH as triggered by NIR irradiation at 808 nm (1 W/cm2). Maximum (100%) values were determined by the recovered fluorescence signal after the AuNCs were digested by KCN. (B) Temperature change of sample solutions for cycles of 5 min irradiation and 10 min in the dark. Shaded regions indicate laser irradiation periods.
CONCLUSION
We have systematically investigated the use of PEG-coated AuNCs as a platform to deliver a photosensitizer namely HPPH by a number of methods including fluorescence intensity and lifetimes, Raman spectroscopy, DLS, and zeta potential measurements. HPPH was found to densely pack within the PEG coating, rather than aggregating at the surface. The loading capacity could be maximized to be ~2 × 10⁵ HPPHs/AuNC, which is attributable to the hydrophobic interaction between HPPH and the PEG layer with a Kd of ~35 μM. Release of cargo from this delivery system was investigated in albumin-containing media to mimic in vivo delivery following intravenous injection and in vesicles to mimic unloading to the cell membrane. The release was found to be slightly faster for albumin, although the timeframes are comparable. This suggests that, in vivo, HPPH would be unloaded to both serum proteins and cell membranes. Changing the ionic character of the PEG terminus affected the release rate by modifying the interactions with dissolved proteins, and crosslinking the termini provides a steric block that prevents undesired unloading. On-demand release could be accomplished by using irradiation to induce the PT effect.
Release studies in a serum-mimetic environment and a suspension of cell membrane mimetic vesicles provide a general method to optimize drug delivery systems prior to costly in vitro and in vivo evaluation. In combination with our previous in vivo demonstration of AuNC-HPPH efficacy,14 this work has established fundamental understanding of the PEG-covered AuNC platform in the delivery of HPPH, which may help elucidate the fate of other non-covalent drug-polymer systems in vivo. The PEG-covered AuNC system integrated with stimuli-responsive cross-linkers can potentially serve as a multifunctional platform for controlled delivery of a wide variety of hydrophobic drugs. Further utilizing the optical properties of AuNC,50 these systems can achieve theranostics through diagnosis via AuNC contrast-enhanced molecular imaging and multi-modal treatment via photodynamic-, photothermal-, and chemo- therapies.
Supplementary Material
Acknowledgments
This work was supported in part by the pilot project funds from the Arkansas Biosciences Institute, the National Institutes of Health (NIH P30 GM103450), the Ralph E. Powe Jr. Faculty Enhancement Award, and startup funds from the University of Arkansas, to J.C.; the financial support from Roswell Park Alliance to R.K.P; and an appointment to S.V.J. to the Summer Student Research Program at the National Center for Toxicological Research administered by the Oak Ridge Institute for Science and Education through an interagency agreement between the U.S. Department of Energy and the U.S. Food and Drug Administration. C.D.H. would like to thank the National Science Foundation (CHE-1255440) for financial support. K.Y.R. thanks the support from Student Undergraduate Research Fellowship (SURF). The views presented in this article do not necessarily reflect those of the Food and Drug Administration.
Footnotes
Publisher's Disclaimer: This is a PDF file of an unedited manuscript that has been accepted for publication. As a service to our customers we are providing this early version of the manuscript. The manuscript will undergo copyediting, typesetting, and review of the resulting proof before it is published in its final citable form. Please note that during the production process errors may be discovered which could affect the content, and all legal disclaimers that apply to the journal pertain.
References
- 1.Peer D, Karp JM, Hong S, Farokhzad OC, Margalit R, Langer R. Nat Nano. 2007;2:751–760. doi: 10.1038/nnano.2007.387. [DOI] [PubMed] [Google Scholar]
- 2.Ghosh P, Han G, De M, Kim CK, Rotello VM. Adv Drug Del Rev. 2008;60:1307–1315. doi: 10.1016/j.addr.2008.03.016. [DOI] [PubMed] [Google Scholar]
- 3.Gil PR, Parak WJ. ACS Nano. 2008;2:2200–2205. doi: 10.1021/nn800716j. [DOI] [PubMed] [Google Scholar]
- 4.Farokhzad OC, Langer R. ACS Nano. 2009;3:16–20. doi: 10.1021/nn900002m. [DOI] [PubMed] [Google Scholar]
- 5.Bardhan R, Lal S, Joshi A, Halas NJ. Acc Chem Res. 2011;44:936–946. doi: 10.1021/ar200023x. [DOI] [PMC free article] [PubMed] [Google Scholar]
- 6.Xia Y, Li W, Cobley CM, Chen J, Xia X, Zhang Q, Yang M, Cho EC, Brown PK. Acc Chem Res. 2011;44:914–924. doi: 10.1021/ar200061q. [DOI] [PMC free article] [PubMed] [Google Scholar]
- 7.Dreaden EC, Alkilany AM, Huang X, Murphy CJ, El-Sayed MA. Chem Soc Rev. 2012;41:2740–2779. doi: 10.1039/c1cs15237h. [DOI] [PMC free article] [PubMed] [Google Scholar]
- 8.Rana S, Bajaj A, Mout R, Rotello VM. Adv Drug Del Rev. 2012;64:200–216. doi: 10.1016/j.addr.2011.08.006. [DOI] [PMC free article] [PubMed] [Google Scholar]
- 9.Xie J, Lee S, Chen X. Adv Drug Del Rev. 2010;62:1064–1079. doi: 10.1016/j.addr.2010.07.009. [DOI] [PMC free article] [PubMed] [Google Scholar]
- 10.Alkilany AM, Lohse SE, Murphy CJ. Acc Chem Res. 2012;46:650–661. doi: 10.1021/ar300015b. [DOI] [PubMed] [Google Scholar]
- 11.Huang J, Jackson KS, Murphy CJ. Nano Lett. 2012;12:2982–2987. doi: 10.1021/nl3007402. [DOI] [PubMed] [Google Scholar]
- 12.Kim CK, Ghosh P, Pagliuca C, Zhu Z-J, Menichetti S, Rotello VM. J Am Chem Soc. 2009;131:1360–1361. doi: 10.1021/ja808137c. [DOI] [PMC free article] [PubMed] [Google Scholar]
- 13.Ren F, Bhana S, Norman DD, Johnson J, Xu L, Baker DL, Parrill AL, Huang X. Bioconjugate Chem. 2013;24:376–386. doi: 10.1021/bc300442d. [DOI] [PubMed] [Google Scholar]
- 14.Srivatsan A, Jenkins SV, Jeon M, Wu Z, Kim C, Chen J, Pandey RK. Theranostics. 2014;4:163–74. doi: 10.7150/thno.7064. [DOI] [PMC free article] [PubMed] [Google Scholar]
- 15.Tam NCM, Scott BMT, Voicu D, Wilson BC, Zheng G. Bioconjugate Chem. 2010;21:2178–2182. doi: 10.1021/bc100386a. [DOI] [PubMed] [Google Scholar]
- 16.Sershen SR, Westcott SL, Halas NJ, West JL. J Biomed Mater Res. 2000;51:293–298. doi: 10.1002/1097-4636(20000905)51:3<293::aid-jbm1>3.0.co;2-t. [DOI] [PubMed] [Google Scholar]
- 17.Knop K, Hoogenboom R, Fischer D, Schubert US. Angew Chem Int Ed. 2010;49:6288–6308. doi: 10.1002/anie.200902672. [DOI] [PubMed] [Google Scholar]
- 18.Sun G, Hagooly A, Xu J, Nyström AM, Li Z, Rossin R, Moore DA, Wooley KL, Welch MJ. Biomacromolecules. 2008;9:1997–2006. doi: 10.1021/bm800246x. [DOI] [PubMed] [Google Scholar]
- 19.Cheng YC, Samia A, Meyers JD, Panagopoulos I, Fei B, Burda C. J Am Chem Soc. 2008;130:10643–10647. doi: 10.1021/ja801631c. [DOI] [PMC free article] [PubMed] [Google Scholar]
- 20.Cheng Y, Samia AC, Li J, Kenney ME, Resnick A, Burda C. Langmuir. 2009;26:2248–2255. doi: 10.1021/la902390d. [DOI] [PubMed] [Google Scholar]
- 21.Cheng Y, Meyers JD, Broome A-M, Kenney ME, Basilion JP, Burda C. J Am Chem Soc. 2011;133:2583–2591. doi: 10.1021/ja108846h. [DOI] [PMC free article] [PubMed] [Google Scholar]
- 22.Ghosh P, Han G, De M, Kim CK, Rotello VM. Advanced Drug Delivery Reviews. 2008;60:1307–1315. doi: 10.1016/j.addr.2008.03.016. [DOI] [PubMed] [Google Scholar]
- 23.Ren F, Bhana S, Norman DD, Johnson J, Xu L, Baker DL, Parrill AL, Huang X. Bioconjugate Chemistry. 2013;24:376–386. doi: 10.1021/bc300442d. [DOI] [PubMed] [Google Scholar]
- 24.Li Y-C, Rissanen S, Stepniewski M, Cramariuc O, Róg T, Mirza S, Xhaard H, Wytrwal M, Kepczynski M, Bunker A. J Phys Chem B. 2012;116:7334–7341. doi: 10.1021/jp300301z. [DOI] [PubMed] [Google Scholar]
- 25.Yavuz MS, Cheng Y, Chen J, Cobley CM, Zhang Q, Rycenga M, Xie J, Kim C, Song KH, Schwartz AG, Wang LV, Xia Y. Nat Mater. 2009;8:935–939. doi: 10.1038/nmat2564. [DOI] [PMC free article] [PubMed] [Google Scholar]
- 26.Moon GD, Choi S-W, Cai X, Li W, Cho EC, Jeong U, Wang LV, Xia Y. J Am Chem Soc. 2011;133:4762–4765. doi: 10.1021/ja200894u. [DOI] [PMC free article] [PubMed] [Google Scholar]
- 27.You J, Zhang G, Li C. ACS Nano. 2010;4:1033–1041. doi: 10.1021/nn901181c. [DOI] [PMC free article] [PubMed] [Google Scholar]
- 28.Sershen SR, Westcott SL, Halas NJ, West JL. Journal of Biomedical Materials Research. 2000;51:293–298. doi: 10.1002/1097-4636(20000905)51:3<293::aid-jbm1>3.0.co;2-t. [DOI] [PubMed] [Google Scholar]
- 29.Wilets KA, Duyne RPV. Ann Rev Phys Chem. 2007;58:267–97. doi: 10.1146/annurev.physchem.58.032806.104607. [DOI] [PubMed] [Google Scholar]
- 30.Yun CS, Javier A, Jennings T, Fisher M, Hira S, Peterson S, Hopkins B, Reich NO, Strouse GF. J Am Chem Soc. 2005;127:3115–9. doi: 10.1021/ja043940i. [DOI] [PubMed] [Google Scholar]
- 31.Jennings TL, Singh MP, Strouse GF. J Am Chem Soc. 2006;128:5462–7. doi: 10.1021/ja0583665. [DOI] [PubMed] [Google Scholar]
- 32.Xia X, Yang M, Oetjen LK, Zhang Y, Li Q, Chen J, Xia Y. Nanoscale. 2011;3:950–3. doi: 10.1039/c0nr00874e. [DOI] [PubMed] [Google Scholar]
- 33.Biczok L, Valat P, Wintgens V. Phys Chem Chem Phys. 1999;1:4759–4766. [Google Scholar]
- 34.Mendel CM, Mendel DB. Biochem J. 1985;228:269–72. doi: 10.1042/bj2280269. [DOI] [PMC free article] [PubMed] [Google Scholar]
- 35.van Zoelen EJ. Biochem J. 1989;262:549–56. doi: 10.1042/bj2620549. [DOI] [PMC free article] [PubMed] [Google Scholar]
- 36.Baba K, Pudavar HE, Roy I, Ohulchanskyy TY, Chen Y, Pandey RK, Prasad PN. Mol Pharm. 2007;4:289–297. doi: 10.1021/mp060117f. [DOI] [PMC free article] [PubMed] [Google Scholar]
- 37.Cotton TM, Schultz SG, Duyne RPV. J Am Chem Soc. 1982;104:6528–32. [Google Scholar]
- 38.Gao X, Davies JP, Weaver MJ. J Phys Chem. 1990;94:6858–64. [Google Scholar]
- 39.Jenkins SV, Qu H, Mudalige T, Ingle TM, Wang R, Wang F, Howard PC, Chen J, Zhang Y. Biomaterials. 2015;51:226–237. doi: 10.1016/j.biomaterials.2015.01.072. [DOI] [PMC free article] [PubMed] [Google Scholar]
- 40.Doweiko JP, Nompleggi DJ. J Parenteral Enteral Nutrition. 1991;15:207–11. doi: 10.1177/0148607191015002207. [DOI] [PubMed] [Google Scholar]
- 41.Harder P, Grunze M, Dahint R, Whitesides GM, Laibinis PE. J Phys Chem B. 1998;102:426–436. [Google Scholar]
- 42.Ostuni E, Chapman RG, Holmlin RE, Takayama S, Whitesides GM. Langmuir. 2001;17:5605–5620. doi: 10.1021/la0015258. [DOI] [PubMed] [Google Scholar]
- 43.Walkey CD, Olsen JB, Guo H, Emili A, Chan WCW. J Am Chem Soc. 2011;134:2139–2147. doi: 10.1021/ja2084338. [DOI] [PubMed] [Google Scholar]
- 44.Walkey CD, Chan WCW. Chem Soc Rev. 2012;41:2780–2799. doi: 10.1039/c1cs15233e. [DOI] [PubMed] [Google Scholar]
- 45.Rotenberg M, Margalit R. Biochem J. 1985;229:197–203. doi: 10.1042/bj2290197. [DOI] [PMC free article] [PubMed] [Google Scholar]
- 46.Mahammed A, Gray HB, Weaver JJ, Sorasaenee K, Gross Z. Bioconjugate Chem. 2004;15:738–746. doi: 10.1021/bc034179p. [DOI] [PubMed] [Google Scholar]
- 47.Hartvig RA, van de Weert M, Østergaard J, Jorgensen L, Jensen H. Langmuir. 2011;27:2634–2643. doi: 10.1021/la104720n. [DOI] [PubMed] [Google Scholar]
- 48.Sun G, Lee NS, Neumann WL, Freskos JN, Shieh JJ, Dorshow RB, Wooley KL. Soft Matter. 2009;5:3422–3429. [Google Scholar]
- 49.Chen J, Glaus C, Laforest R, Zhang Q, Yang M, Gidding M, Welch MJ, Xia Y. Small. 2010;6:811–817. doi: 10.1002/smll.200902216. [DOI] [PMC free article] [PubMed] [Google Scholar]
- 50.Chen J, Yang M, Zhang Q, Cho EC, Cobley CM, Kim C, Glaus C, Wang LV, Welch MJ, Xia Y. Adv Funct Mater. 2010;20:3684–3694. doi: 10.1002/adfm.201001329. [DOI] [PMC free article] [PubMed] [Google Scholar]
- 51.Hey MJ, Ilett SM, Davidson G. J Chem Soc Faraday Trans. 1995;91:3897–3900. [Google Scholar]
- 52.Karlstroem G. J Phys Chem. 1985;89:4962–4964. [Google Scholar]
Associated Data
This section collects any data citations, data availability statements, or supplementary materials included in this article.