

Abstract
Cell migration within 3D interstitial microenvironments is sensitive to extracellular matrix (ECM) properties, but the mechanisms that regulate migration guidance by 3D matrix features remain unclear. To examine the mechanisms underlying the cell migration response to aligned ECM, which is prevalent at the tumor-stroma interface, we utilized time-lapse microscopy to compare the behavior of MDA-MB-231 breast adenocarcinoma cells within randomly organized and well-aligned 3D collagen ECM. We developed a novel experimental system in which cellular morphodynamics during initial 3D cell spreading served as a reductionist model for the complex process of matrix-directed 3D cell migration. Using this approach, we found that ECM alignment induced spatial anisotropy of cells’ matrix probing by promoting protrusion frequency, persistence, and lengthening along the alignment axis and suppressing protrusion dynamics orthogonal to alignment. Preference for on-axis behaviors was dependent upon FAK and Rac1 signaling and translated across length and time scales such that cells within aligned ECM exhibited accelerated elongation, front-rear polarization, and migration relative to cells in random ECM. Together, these findings indicate that adhesive and protrusive signaling allow cells to respond to coordinated physical cues in the ECM, promoting migration efficiency and cell migration guidance by 3D matrix structure.
Keywords: contact guidance, cell protrusions, morphodynamics, invasion
Graphical abstract
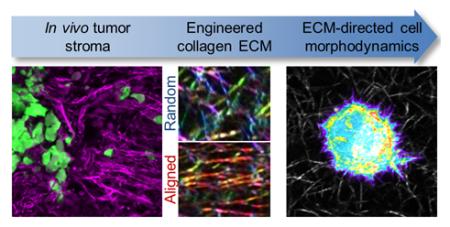
Fiber alignment within tumor-mimetic engineered collagen matrices drives FAK- and Rac1-dependent cellular anisotropy that promotes protrusions along fibers and suppresses off-axis protrusions to direct cell migration.
Introduction
Cell migration through 3D ECM is a fundamental feature of many physiological and pathological processes. Efficient motility depends on precise coordination of cell protrusion, adhesion, and contractility mechanisms, which are largely governed by intracellular signaling networks.1 However, 3D migration is also sensitive to local extracellular cues, which can integrate with established intracellular signaling to influence migration mode and efficiency2 and impart migration directionality by inducing cell polarity.3 Such extracellular guidance of cell migration in 3D environments can be attributed to soluble factors that induce chemotaxis1,4 as well as physical ECM cues including interfacial boundaries,5 gradients of adhesive ligands and matrix stiffness6,7 and local matrix alignment.8,9 Notably, tumor progression is associated with biochemical, mechanical, and structural changes in the stromal ECM that are presumed to impact invasive cancer cell migration,10–13 and understanding the mechanisms by which these changes affect tumor cell behavior is critical.
ECM linearization and alignment resulting from cell traction force generation8,14,15 can drive several processes including epithelial tissue branching and disruption16,17 and invasive migration into the stroma.18–21 Since the stromal matrix surrounding tumors is highly linearized as compared to the ECM of normal epithelial tissue,18,22 understanding the molecular and cellular mechanisms by which cancer cells detect and respond to locally aligned matrix could inform therapeutic strategies to target stromal invasion. While the effects of 3D matrix alignment and contact guidance on cell morphology and migration have been appreciated for some time,9,21,23–25 our mechanistic understanding of these cellular responses to matrix alignment remains limited.
In this study, we examined and compared the morphodynamics of early 3D cell spreading in random and aligned 3D collagen matrix. Using this initial spreading phase as a reductionist model for 3D cell migration, we revealed the subcellular behaviors that mediate 3D contact guidance. We found that matrix alignment accelerates and spatially directs spreading, cell polarization, and migration by promoting “on-axis” and suppressing “off-axis” protrusion and cell body displacement. Through pharmacological screening of cell motility regulators, we found that this matrix alignment-induced behavioral anisotropy was dependent on focal adhesion kinase (FAK) and Rac1 signaling.
Materials and Methods
Cell culture and reagents
MDA-MB-231 breast adenocarcinoma cells (HTB-26; ATCC, Rockville, MD) were maintained in DMEM (Life Technologies, Grand Island, NY) supplemented with 10% FBS (Atlanta Biologicals, Flowery Branch, GA), 100 U/ml penicillin, and 100 μg/ml streptomycin (Life Technologies). GFP-expressing MDA-MB-231 (AKR-201; Cell Biolabs, San Diego, CA) were maintained in complete MDA-MB-231 medium as described above supplemented with 0.1 mM MEM nonessential amino acids (Life Technologies). MDA-MB-231 cells were transiently transfected with GFP-Lifeact as previously described.26 All cell culture and time-lapse imaging was performed at 37°C and 5% CO2.
The following reagents were used for fluorescent imaging: polyclonal anti-pFAKY397 (3283; Cell Signaling Technology, Danvers, MA); Alexa Fluor 568-conjugated anti-rabbit (A-11036, Life Technologies); Alexa Fluor 488-conjugated phalloidin (Life Technologies). The Rac1 inhibitor NSC23766 (50 μM; Santa Cruz Biotechnology, Santa Cruz, CA), FAK inhibitor PF573228 (5 μM; Santa Cruz Biotechnology), Src kinase inhibitor PP1 (10 μM; Sigma-Aldrich, St. Louis, MO), PI3K inhibitor LY294002 (20 μM; EMD Millipore, Billerica, MA), and β1 integrin blocking antibody 4B4 (10 μg/ml; Beckman Coulter, Brea, CA) were used as described below.
In vivo and in vitro invasion assays
A murine mammary cancer model was used as previously described.26,27 Mice were maintained according to Cornell University Animal Care guidelines, and methods were approved by the Cornell Institutional Animal Care and Use Committee (protocol 2009-0101; R.M. Williams). Briefly, GFP-expressing MDA-MB-231 cells were injected into the cleared mammary fat pad and allowed to form orthotopic tumors for 3 weeks, at which point tumors and the surrounding stroma were excised for ex vivo imaging as described below. The multicellular spheroid collagen invasion assay was performed using GFP-expressing MDA-MB-231 cells as described.19
Characterization of cell morphodynamics and migration from time-lapse imaging
Cells were seeded within 1.5 mg/ml collagen matrices prepared from acid-solubilized type I rat tail tendon collagen as previously described.26 Briefly, collagen stock solution was diluted using ice-cold culture medium and neutralized with sodium hydroxide. Cells were incorporated into neutralized collagen and matrices were polymerized at room temperature for 30 min, at which point collagen matrices were fully polymerized as determined by stable matrix structure in time-lapse confocal reflectance images acquired as described below. Following polymerization, matrices were overlaid with culture medium and immediately transferred to temperature-, humidity-, and CO2-controlled microscope incubation chambers for time-lapse studies. For inhibitor studies, cells were pretreated with inhibitors in suspension for 30 min prior to collagen seeding and polymerized matrices were overlaid with culture medium supplemented with inhibitors. Since pharmacological inhibitors were solubilized in DMSO (PF573228, PP1, LY294002) or water (NSC23766), cells were treated with DMSO vehicle alone at the highest used concentration as a negative control. Time-lapse, phase contrast imaging was performed using a Zeiss Axio Observer Z1 microscope equipped with a Plan-Apochromat 10×/0.45 NA or Plan-Neofluar 20×/0.4 NA lens, a Hamamatsu ORCA-ER camera, and AxioVision software (version 4.8, Carl Zeiss Microscopy). All images were acquired > 200 μm above the bottom surface of 3D matrices. Image analysis was performed using ImageJ (version 1.49b, National Institutes of Health, Bethesda, MD).
For detection of subcellular protrusion dynamics, images were acquired at 2-min intervals starting immediately after matrix polymerization. Protrusion angle (from cell body surface into surrounding matrix), length, and lifetime were recorded for all protrusions generated by a cell. For quantification of protrusion dynamics during early spreading, protrusions were monitored for 3-4 h or until the cell extended a major polarizing protrusion. Cell morphodynamics were analyzed by manually tracing cell contours from time-lapse image series. Aspect ratio and circularity were jointly used to describe cell morphology,28 and cell elongation angle was defined by the angle of an elongated cell’s major axis. Cell body positions were manually tracked from time-lapse image series to measure stepwise cell body movement speeds and angles. A cell was considered motile if it displaced at least one cell diameter (~ 15 μm) during a 2-h period, and ‘motile fraction’ was defined as the ratio of motile cells to total cells. Single cell stepwise migration speed and orientation were measured between 8-24 h after seeding.
Matrix alignment
Collagen matrix was aligned using magnetic field-induced flow of magnetic beads during matrix polymerization.8,29 Paramagnetic polystyrene beads (PM-20-10; Spherotech, Lake Forest, IL) were incorporated into cell-containing collagen solution at 1% (v/v). This solution was loaded into one well of a custom cell culture device consisting of PDMS walls bonded to coverglass on the bottom and ends. The opposing well was filled with cell-containing collagen solution without beads to serve as a matched random matrix control. The device was positioned adjacent to a neodymium magnet (BZX0Y0X0-N52; K&J Magnetics, Pipersville, PA) with surface field strength > 4kG and matrices were polymerized at room temperature for 30 min before being overlaid with culture medium.
Confocal imaging of cells and extracellular matrix
Confocal fluorescence and reflectance imaging of ex vivo and in vitro matrix-embedded cells was performed using a Zeiss LSM700 confocal microscope operated by ZEN software (version 2010, Carl Zeiss) and equipped with a C-Apochromat 40×/1.1 NA long working distance water immersion lens. Time-lapse confocal imaging of Lifeact-GFP-transfected MDA-MB-231 cells was performed 30-60 minutes after matrix polymerization to allow for sample stabilization. Following the indicated length of culture, aligned matrix samples were fixed with 3.7% formaldehyde, rinsed, blocked, and stained with anti-pFAKY397 antibody for immunofluorescence imaging. Lifeact-GFP and fluorescent adhesion images are maximum intensity projections of three sequential ~1 μm thick confocal slices. Cell morphologies 24 h after seeding were determined from 10 × magnification maximum intensity confocal projections of fixed phalloidin-labelled samples. Extracellular matrix alignment was quantified from confocal reflectance images of mammary stroma or in vitro collagen matrix using the ImageJ plugin OrientationJ as previously described.19 Single confocal slices (~1 μm thickness) were analyzed using a 0.6-μm Gaussian window to create distributions of pixel orientation. Pixel orientation relative to horizontal was used to pseudocolor matrix images. For all angle-dependent measurements, 0° reference was set to collagen alignment axis for aligned matrix and set arbitrarily for random matrix.
Statistical analysis
All numerical data are from at least 3 independent experiments and are presented as individual measurements, mean ± SEM, or box-and-whisker plots, where boxes represent medians and 25th/75th percentile and bars indicate the 5th and 95th percentiles. Means were compared by one-way analysis of variance (ANOVA) with a post hoc Tukey’s HSD test using JMP (version 10; SAS Institute, Cary, NC). Cell migration speeds were compared using a nonparametric Wilcoxon test. Angle-dependent measurements including protrusion dynamics, cell elongation distributions, angular displacement distributions, and stepwise cell migration speeds were compared using linear regression analysis in JMP; goodness of fit (R2), slope, and significance are reported.
Results
Cancer cells encounter aligned 3D ECM in vivo and in vitro
During the process of cancer invasion and metastasis, tumor cells pass through diverse ECM microenvironments that can provide a variety of biochemical, mechanical, and structural cues that affect cell migration. In particular, the stromal ECM surrounding tumors can show linearization and fiber alignment that is associated with enhanced invasion.18 Here, using an orthotopic mammary tumor model, we found that invasive cells can detach from the primary tumor and migrate into regions of highly organized stromal ECM (Fig. 1A) in which matrix fibers surrounding invading cells are preferentially aligned orthogonal to the tumor-stroma interface (Fig. 1B). Furthermore, in an in vitro multicellular spheroid model of tumor invasion, cancer cells migrate outward in radially oriented strands of cells (Fig. 1C) that associate with aligned type I collagen matrix (Fig. 1D).19 Finally, analysis of single cells following spreading within 3D collagen matrix (Fig. 1E) revealed an association of major cell projections with locally aligned matrix (Fig. 1F; arrowheads). Since alignment of 3D matrix provides cells with coordinated linear structural cues at the tumor-stroma interface in vivo as well as in vitro, we aimed to determine how local matrix alignment affects 3D cancer cell migration behavior.
Figure 1. Extracellular matrix alignment in vivo and in vitro.

(A) Ex situ confocal image of tumor-stroma interface following 3 weeks of orthotopic mammary tumor growth and invasion. GFP-labeled MDA-MB-231 cells (green) invading from the tumor (‘T’) into the surrounding stromal ECM (magenta). Scale bar: 100 μm. (B) Alignment-pseudocolored image and orientation analysis of stromal ECM indicated in A. Colors correspond to alignment relative to horizontal. (C) GFP-labeled MDA-MB-231 cells (green) invading from a multicellular spheroid (‘S’) into the surrounding collagen matrix. Scale bar: 100 μm. (D) Alignment-pseudocolored image and orientation analysis of collagen matrix surrounding an invasive strand of cells such as that indicated in C. (E) Maximum intensity projection of an isolated MDA-MB-231 cell (‘C’) following 24 h of spreading in 3D collagen matrix (red). Yellow, green, and blue regions highlight major cell protrusions. Scale bar: 20 μm. (F) Alignment-pseudocolored images and orientation analysis of plane of interest for regions indicated in E. Arrowheads indicate protrusion-aligned collagen fibers.
Migrating cells exchange spreading-associated protrusion formation for cell elongation, polarization, and displacement
Tunable 3D in vitro culture models have become valuable tools for defining the mechanisms by which matrix structure guides cell migration. However, since cells constantly interact with their surrounding ECM during 3D migration and can engage in dynamic ECM remodeling, the effects of initial matrix structure and cell-modified matrix structure are difficult to decouple. Therefore, traditional 3D migration assays in which cells are seeded within matrices and observed after overnight incubation to allow equilibration may not be able to rigorously uncover matrix guidance mechanisms since both the cells and surrounding matrix itself are in constant flux. To overcome this, we used initial 3D cell spreading, where cells are seeded into naïve 3D matrix and their immediate response is examined, as a reductionist experimental model by which to study the extracellular guidance of 3D spreading and migration. The primary rationale underlying the design of the following studies is that ECM formation occurs quickly, prior to the initiation of cell spreading, which itself precedes cellular matrix remodeling.
To validate this approach, we first investigated the integrated processes of cell spreading and migration within 3D ECM by seeding cells within fibrillar type I collagen matrix and monitoring their behavior immediately following matrix polymerization using high temporal resolution time-lapse microscopy. We used the malignant MDA-MB-231 breast cancer cell line throughout this study as a model for mesenchymal migration. Simultaneous analysis of cell morphology, protrusion dynamics, and cell body movement revealed the subcellular coordination associated with spreading and the initiation of 3D migration (Fig. 2A-D). Immediately following collagen ECM polymerization (30 minutes after the start of gel neutralization), cells generated matrix-probing protrusions that extended into the pericellular space (Fig. 2A; arrowheads). These pseudopodial protrusions were 2-10 μm in length and persisted for 10-30 min before being retracted (Fig. 2B). Notably, once the cell effectively chose a direction by extending a major, long-lived protrusion (Fig. 2B; dark red protrusion trace) and polarizing to define a front-rear axis, it substantially changed its phenotype, resulting in a significant reduction in new protrusion formation (Fig. 2C), increased cell elongation, and migration initiation (Fig. 2D; blue and red traces, respectively). Notably, while the cell depicted in Fig. 2A-D made the transition from matrix probing to motility 120-180 min after seeding, the timing and efficiency of cells’ transition between these two states varied widely across cells. Nonetheless, the ability to switch off new protrusion formation was uniquely characteristic of efficient 3D migrators (Fig. 2E), and high migration speeds were associated with low new protrusion formation rates (Fig. 2F). Together, these data demonstrate that the process of 3D cell spreading is closely related to 3D cell migration and suggest that analysis of a cell’s morphodynamics during spreading could provide insight into migration behavior.
Figure 2. Morphodynamics of early 3D cell spreading and migration initiation.

(A) Time-lapse image series of MDA-MB-231 cell spreading in three-dimensional 1.5 mg/ml collagen matrix immediately following matrix polymerization. Arrowheads indicate cell protrusions. Red cross denotes cell body centroid. Scale bar: 10 μm. (B) Traces of individual matrix-probing protrusions generated by the cell shown in A. (C) Rate of new protrusion formation by cell shown in A. (D) Cell elongation (aspect ratio / circularity) and net cell body displacement of cell shown in A. (E) New protrusion formation rate for individual cells before and after cell elongation event (aspect ratio / circularity > 5). Each cell’s measurements are connected by a line to highlight change before and after elongation. Horizontal bars indicate mean protrusion formation rates. “Migrators” are cells that eventually displaced at least 50 μm. ***, P < 0.0001. n.s., not significant. (F) Linear correlation between new protrusion formation rate and net cell migration speed. Each data point represents an individual cell measured 12 h after seeding in collagen. (G) Lifeact-GFP-transfected MDA-MB-231 cell spreading in collagen matrix immediately after polymerization. Insets highlight dynamics of transient protrusions. Scale bars: 5 μm. (H) Extension and maintenance of actin-rich protrusion along radially aligned matrix at the cell periphery (arrowhead) that supports protrusion persistence. Scale bar: 5 μm.
Matrix-probing filopodia engage fibrillar collagen ECM during early 3D cell spreading
We previously reported that the transition from matrix probing to motility in 3D collagen is sensitive to ECM density and structure,26,28 suggesting that cell-matrix interactions underlie this critical transition. To determine whether the process of 3D cell spreading is indiscriminate and spatially random or directed by the ECM, we used time-lapse confocal microscopy to simultaneously monitor collagen matrix structure and the behavior of embedded Lifeact-GFP-transfected MDA-MB-231 cells. Spreading cells initially generated filopodia-like, actin-containing protrusive structures that extended into the pores and along the fibers of the surrounding collagen matrix. When these dynamic structures emerged within ECM pores, they were generally less than 5 μm in length and persisted for several minutes before buckling or retracting back into the cell cortex (Fig. 3A; red boxes). Notably, when filopodial protrusions emerged near radially aligned collagen fibers adjacent to the cell (Fig. 3B; black arrowhead), they persisted and developed into larger protrusive structures that extended along the initial matrix alignment. Since cells’ continuous engagement with their surrounding ECM is bidirectional, we next asked whether cells were capable of inducing remodeling of their surrounding collagen matrix that, in turn, influenced cell protrusions and spreading. We observed that MDA-MB-231 cells initially surrounded by isotropic collagen matrix (Fig. 3C; top row) induced highly anisotropic collagen fiber remodeling, including local condensation and alignment of fibers, during culture (Fig. 3C; bottom row). Interestingly, pronounced changes in the pericellular matrix preceded directional spreading and migration initiation, suggesting that cell-mediated ECM “pre-patterning” guided subsequent cell spreading (Fig. 3D). These findings suggest that both native and cell-remodeled fibrillar matrix structure may locally guide 3D cell spreading by promoting the development of matrix-probing protrusions into larger pseudopodial protrusions.
Figure 3. Cell-matrix interactions during early 3D cell spreading and migration initiation.

(A) Lifeact-GFP-transfected MDA-MB-231 cell spreading in collagen matrix immediately after polymerization. Insets highlight dynamics of transient protrusions. Scale bars: 5 μm. (B) Extension and maintenance of actin-rich protrusion along radially aligned matrix at the cell periphery (arrowhead) that supports protrusion persistence. Scale bar: 5 μm. (C) Confocal reflectance images of collagen matrix structure (left) around an embedded MDA-MB-231 cell (projected area shown as ‘c’) as well as heat maps illustrating collagen fiber density (middle) and orientation (right) immediately after matrix polymerization (top row) and following 24 h of culture (bottom row). Arrows indicate anisotropy of ECM structure. Scale bar: 20 μm. (D) Lifeact-GFP-transfected MDA-MB-231 cell shown in (C) spreading along pre-patterned anisotropy axis indicated by arrow.
Local ECM alignment accelerates and directs cell elongation, polarization, and the transition from matrix probing to migration
Having demonstrating the involvement of local ECM structure in the processes of 3D cell spreading and migration initiation, we next sought to define and systematically analyze the mechanisms by which cells detect and respond to ECM alignment. To do so, we seeded cells within an aligned collagen matrix by preparing collagen solution to include metal beads that were pulled through the solution by a magnet during matrix polymerization, aligning collagen fibers as they formed (Fig. 4A). Collagen fibers in aligned matrix showed significant linear organization whereas those in random matrix showed no orientation bias (Fig. 4B,C). For reference, the axis of fiber alignment was considered 0° throughout this study.
Figure 4. Guidance of 3D cell spreading by extracellular matrix alignment.

(A) Schematic of custom glass-bottomed cell culture device used to align collagen matrix. (B) Confocal reflectance images of random and aligned collagen matrix. Images were pseudocolored such that fiber hue corresponds to alignment relative to horizontal. Scale bar: 5 μm. (C) Quantification of collagen fiber alignment. Data are represented as mean ± SD for 10 images (160 μm × 160 μm). (D) Time-lapse analysis of 3D cell spreading and migration initiation of MDA-MB-231 cells in random and aligned matrix. Elongation and displacement data are represented as mean ± SEM for 20 cells per matrix condition. Dashed lines indicate cell elongation threshold (aspect ratio / circularity = 5), half-maximum cell polarization response (50% polarized), and net cell displacement threshold (50 μm). (E) Alignment-pseudocolored images of phalloidin-labelled cells 24 h after seeding in 3D matrix. Red arrow indicates matrix alignment axis. Scale bar: 500 μm. (F) Cell morphology map of aspect ratio and circularity 24 h after seeding. Each data point represents an individual cell; horizontal and vertical lines represent average aspect ratio and circularity, respectively (no significant difference). (G) Fraction of cells showing front-rear polarization. n.s., not significant. (H) Distributions and linear regression analysis of cell elongation angle relative to matrix alignment. Cell elongation angle distributions were determined and mean ± SEM was computed for each angular bin. Linear regression analysis and associated goodness of fit (R2), regression slope, and significance of comparison between random and aligned matrix are shown. Data in F-H are represented as mean ± SEM from n = 3 independent experiments (> 750 cells per condition).
To determine how matrix alignment regulates early 3D cell spreading, we used time-lapse imaging to compare cell behavior within random and aligned collagen ECM. Cells within aligned matrix showed faster elongation and net displacement than those within random matrix (Fig. 4D), as cells within aligned ECM reached the thresholds for these behaviors earlier than cells within random matrix (Fig. 4D; dashed lines). Furthermore, aligned matrix increased the rate of front-rear polarization in cells that ultimately polarized (Fig. 4D). Following 24 h of spreading, cells exhibited a range of morphologies (Fig. 4E), which were examined by measurement of single cells’ aspect ratio and circularity, whereby rounded cells (low aspect ratio, high circularity), well-spread multipolar cells (low aspect ratio, low circularity), and well-spread bipolar cells (high aspect ratio, low circularity) could be distinguished. Interestingly, despite influencing the rate of initial cell spreading (Fig. 4D), there was no difference in average aspect ratio and circularity between the two matrix conditions by 24 h (Fig. 4F; horizontal and vertical lines, respectively). Additionally, although cells acquired front-rear polarized morphology faster in aligned matrix (Fig. 4D) there was no difference in the fraction of polarized cells by 24 h (Fig. 4G). However, matrix alignment induced a significant orientation bias on cell morphology: while ~65% of cells oriented within ±30° of the collagen axis in aligned ECM, those in random ECM showed no such directionality (Fig. 4E,H). As indicated by comparable distributions of rounded, elongated, and polarized cells in random and aligned matrix by 24 h (Fig. 4F,G), our data suggest that local matrix alignment does not influence a cell’s ability to spread per se. Rather, local matrix alignment provides cues that accelerate (Fig. 4D) and spatially direct cell spreading (Fig. 4H).
ECM alignment causes spatial and temporal anisotropy of early matrix-probing protrusions
To expose the subcellular dynamics underlying the cellular response to aligned ECM, we investigated the matrix-probing protrusion dynamics of cells embedded within random and aligned collagen ECM. We monitored cells for 3-4 h after matrix polymerization, or until the cell elongated, since this event is associated with significant changes in cell behavior (Fig. 2). Interestingly, while cells within random ECM generated isotropically distributed protrusions in all directions, cells in aligned ECM preferentially generated protrusions along the axis of collagen alignment (Fig. 5A). These distinct angular distributions of protrusions were maintained over time (Fig. 5B). Thus, while there was no discernible angular preference for protrusions in random matrix, approximately 80% of protrusions were within ±30° of the collagen axis in aligned matrix (Fig. 5C). Notably, cells in aligned matrix also generated significantly fewer new protrusions during the matrix-probing phase (Fig. 5D). Finally, we used regression analysis to examine maximum protrusion length and protrusion lifetime as a function of protrusion angle and found that matrix organization locally regulates protrusion dynamics (Fig. 5E,F). Whereas aligned matrix induced anisotropy of protrusion dynamics, there was no angular dependence of protrusion length or lifetime in random matrix. Interestingly, cells in aligned collagen generated larger and longer-lived protrusions along the axis of matrix alignment and shorter, more transient protrusions orthogonal to this axis. Together with our earlier finding that “switching off” protrusion is critical for efficient 3D migration, these data suggest that local matrix alignment accelerates cell spreading and motility acquisition by reducing the overall number of matrix-probing protrusions while spatially focusing those that form along the matrix alignment axis. The strong angular anisotropy of protrusion dynamics demonstrates that local ECM alignment also controls protrusion dynamics such that these on-axis protrusions are larger and more persistent.
Figure 5. Spatial guidance of early protrusion dynamics by extracellular matrix alignment.

(A) Representative time-lapse image series of matrix-probing protrusions generated by MDA-MB-231 cells during initial cell spreading in random and aligned collagen. Blue traces highlight protrusions. Red arrow indicates matrix alignment axis. Scale bar: 10 μm. (B) Angular distribution of protrusion formation over time. Data points represent the protrusion orientation and time of formation. (C) Rose plots (15° bins) illustrating distributions of protrusion orientation angle for data in B. (D) New protrusion formation rate for cells analyzed in B. Each data point represents a single cell. Black bars indicate means. *, P < 0.001. (E) Angular distributions and regression analysis of matrix-probing protrusion length. Protrusions in B were binned according to their orientation angle and mean ± SEM protrusion length was computed for each bin. (F) Angular distributions and regression analysis of matrix-probing protrusion lifetime as in E. Data in B-F are from n = 3 independent experiments (15 cells per condition).
ECM alignment induces cell migration anisotropy
Since cell morphodynamics are intimately tied to cell motility (Fig. 2), we hypothesized that the matrix-induced anisotropy of early protrusion dynamics and cell morphology would ultimately translate to differences in cell migration. Indeed, reflective of the more rapid cell elongation, polarization, and displacement observed in aligned matrix (Fig. 4D), motile fraction increased more rapidly and was significantly higher in aligned matrix (Fig. 6A). To better understand the effect of matrix structure on 3D cell migration, frame-to-frame displacements – “stepwise cell movements” – were considered to fully capture migration behavior. While cells in random matrix showed no overall directional preference for their movement, greater than 60% of stepwise cell displacements in aligned matrix were within ±30° of the collagen orientation axis (Fig. 6B), resulting in significantly different angular distributions by regression analysis. In addition to these differences in overall motility and movement direction, cell migration in aligned ECM was significantly faster than migration in random ECM (Fig. 6C). Furthermore, matrix alignment-induced migration anisotropy was evident when stepwise cell speeds were considered along with the angle of the corresponding cell displacement (Fig. 6D). Whereas stepwise cell speeds were distributed uniformly versus displacement angle in random matrix, higher stepwise speeds were observed at lower angles relative to the collagen orientation axis in aligned matrix. These results demonstrate that structural anisotropy of a cell’s local ECM can induce anisotropy of cell migration by promoting faster movement along the predetermined major axis of ECM organization.
Figure 6. Guidance of 3D cell migration by extracellular matrix alignment.
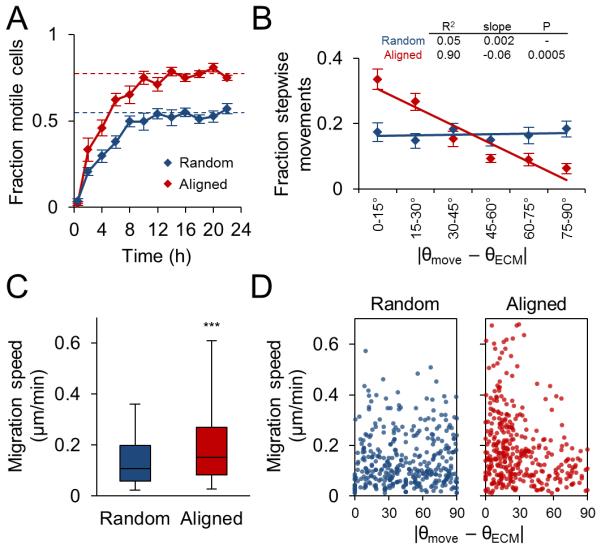
(A) Fraction of motile cells (mean ± SEM) in random and aligned matrix during the first 24 h of culture. Motile fraction was significantly higher (P < 0.001) in aligned matrix at all time points after 2 h, including at steady state (dashed lines; average of 12-24 h). (B) Angular distributions and regression analysis of stepwise cell movements from 12-18 h after seeding. Stepwise angular displacement distributions were binned as indicated and mean ± SEM was determined for each bin. (C) Stepwise cell migration speeds. Box and whisker plots show medians, 25th/75th, and 5th/95th percentiles. ***, P < 0.0001. (D) Stepwise migration speed versus stepwise displacement angle relative to matrix alignment axis. All data are from n = 3 independent experiments (cells per condition: > 150 cells, A; 25 cells, B-D).
FAK and Rac1 activity enable matrix alignment-induced behavioral anisotropy
We next aimed to define the molecular mechanisms governing the subcellular morphodynamic response to matrix alignment. Cells perceive 3D matrix properties through integrin signaling,30,31 which is spatially influenced by 3D matrix fiber structure and alignment.32 Here, we found that matrix structure spatially directs the formation of cell-matrix adhesions and localization of focal adhesion kinase (FAK) activity during 3D cell spreading (Fig. 7A). Whereas pFAKY397 staining was diffuse immediately following aligned matrix polymerization, pFAKY397 signal rapidly localized to small protrusions associated with aligned fibers at the cell periphery after 30 and 120 min of spreading (Fig. 7A; arrowheads), and later localized to the leading edge of migrating cells (Fig. 7B). Radially oriented fibers were similarly associated with adhesions in random matrix, but clear polarization of adhesion localization was only observed in aligned matrix (Fig. 7A). These results provide evidence that matrix-directed adhesion signaling anisotropy occurs prior to spreading in aligned matrix and is maintained through 3D cell migration. Therefore, we investigated the role of β1-integrin, FAK, and Src, which can link adhesion signaling to Rho GTPases,33 as well as Rac1, in the cellular response to matrix alignment. Additionally, we tested whether PI3K, which is a major regulator of chemotactic migration guidance,1,3 contributes to ECM-driven behavioral anisotropy and guidance. Because we sought to identify molecular regulators of the anisotropic phenotype – which is only observed within anisotropic matrices – the following experiments were conducted within aligned collagen matrices.
Figure 7. Regulation of 3D matrix alignment-induced protrusion anisotropy.

(A) Development of pFAKY397-containing adhesions (cyan; arrowheads) during early MDA-MB-231 cell spreading in aligned collagen matrix (red). Red arrow indicates matrix alignment axis. (B) Front-rear pFAKY397 polarization in migrating cell 24 h after seeding. White arrow indicates migration direction. Scale bars: 20 μm. (C) New protrusion formation rate within the first 4 h after seeding in aligned matrix. Cells were pretreated with the indicated inhibitors for 30 min before seeding. ***, P < 0.0001. (D) Angular distributions and regression analysis of matrix-probing protrusion formation. Protrusion orientation distributions were determined and means were computed for each angular bin. Rows highlighted in red are significantly different from Control. (E) Overall matrix-probing protrusion length. ***, P < 0.0001 compared to Control. (F) To account for significant differences in mean overall protrusion length, each treatment’s data was mean-normalized before quantification of angular distributions and regression analysis as in Fig. 5E. Rows highlighted in red are significantly different from Control. (G) Overall matrix-probing protrusion lifetime. ***, P < 0.0001 compared to Control. (H) Angular distributions and regression analysis of mean-normalized protrusion lifetimes analyzed and presented as in F. Rows highlighted in red are significantly different from Control. Data in C-H are from n = 3 independent experiments (12 cells, > 150 protrusions per treatment); data in C,E, and G are presented as mean ± SEM.
Blocking β1-integrin ligation with the function-blocking antibody 4B4 significantly reduced protrusion formation (Fig. 7C) and prevented cell spreading (data not shown), reaffirming the role of β1-integrin in mesenchymal 3D cell spreading34,35 and precluding β1-integrin-inhibited cells from further characterization of behavioral anisotropy in our system. Interestingly, while none of the other inhibitors significantly altered overall protrusion frequency during initial cell spreading (Fig. 7C), we did observe significant differences in protrusion orientation under Rac1 and FAK inhibition (Fig. 7D). While control cells showed a strong orientation bias for on-axis protrusion formation as demonstrated in Fig. 5 (more protrusions at lower angles relative to ECM alignment), regression analysis indicated that Rac1 or FAK inhibition, but not Src or PI3K inhibition, resulted in significantly different angular distributions of matrix-probing protrusions. Notably, both Rac1 and FAK inhibition completely eliminated protrusion anisotropy (Fig. 7D). Overall protrusion dynamics were also affected by both Rac1 inhibition, which decreased average protrusion length and lifetime, and FAK inhibition, which increased average protrusion length and lifetime (Fig. 7E,G). To account for significant differences in average protrusion dynamics parameters, we used mean-normalized values for regression analysis, finding that the orientation-indiscriminate protrusion directionality exhibited under Rac1 and FAK inhibition was accompanied by similarly alignment-insensitive protrusion dynamics (Fig. 7F,H). Finally, neither PI3K nor Src inhibition significantly affected the angular dependence of protrusion dynamics (Fig. 7E-H).
We next measured the morphology and migration of inhibitor-treated cells in aligned collagen matrix to determine if the observed differences in early matrix-probing protrusions preceded later behavioral anisotropy. We found that all treatments with the exception of Src inhibition induced significant changes in overall spread cell morphology 24 h after seeding (Fig. 8A). Control cells showed morphologies ranging from rounded to bipolar elongated as indicated by the broad distribution in the aspect ratio versus circularity morphology map. Rac1-inhibited cells generally failed to elongate (low aspect ratio, high circularity), while FAK and PI3K inhibition induced bipolar/multipolar cell elongation (low/high aspect ratio, low circularity). We measured cell elongation angle, as defined by the major axis of elongated cells (aspect ratio > 1.75) relative to the matrix alignment axis, and found that Rac1 and FAK inhibition significantly reduced the anisotropy of 3D cell spreading observed in control cells (Fig. 8B). Additionally, Rac1 and FAK inhibition significantly reduced front-rear polarization and 3D motility (Fig. 8C,D) and reduced stepwise cell migration speeds to near or below the motility threshold limit (Fig. 8E; dashed line). Conversely, pharmacological targeting of Src signaling had no effect on 3D cell morphology and migration, and despite altering 3D morphology, PI3K inhibition did not affect front-rear polarization, motile fraction, or cell migration speed (Fig. 8C-E). Finally, we analyzed stepwise cell migration speeds as a function of displacement angle and found that neither Src nor PI3K inhibition significantly affected the migration anisotropy induced by aligned collagen matrix (Fig. 8F). In contrast, and in addition to significantly reducing overall cell migration speed, pharmacological inhibition of Rac1 or FAK eliminated ECM alignment-induced orientation bias of cell migration (Fig. 8F). In summary, despite eliciting subtle changes in 3D morphology, inhibition of Src or PI3K signaling did not affect matrix alignment-induced anisotropy of matrix probing, cell spreading, and cell migration. Conversely, both Rac1 and FAK inhibition caused significant changes in protrusion dynamics and spreading as well as a substantial reduction in overall 3D motility. Notably, blocking Rac1 and FAK signaling completely eliminated ECM alignment-induced orientation bias during early matrix probing, spreading, and migration, indicating that Rac1 and FAK signaling are critical regulators of directional guidance of cell migration by 3D matrix alignment.
Figure 8. Regulation of 3D matrix alignment-induced morphology and migration anisotropy.

(A) Phalloidin-labelled cells (green) after 24 h of spreading in aligned collagen matrix treated as indicated. Red arrow indicates matrix alignment axis. Scale bar: 100 μm. Cell morphology maps of aspect ratio and circularity 24 h after seeding. Each data point represents an individual cell. Horizontal and vertical lines represent average aspect ratio and circularity, respectively. *, P < 0.0001 compared to Control. (B) Distributions and regression analysis of cell elongation angle for elongated cells (aspect ratio > 1.75). Elongation orientation distributions were determined and means were computed for each angular bin. Rows highlighted in red are significantly different from Control. (C) Fraction of cells (mean ± SEM) showing distinct front-rear polarization. (D) Steady state motile fraction (mean ± SEM) 12-18 h after seeding. (E) Stepwise cell migration speeds. Box and whisker plots show medians, 25th/75th, and 5th/95th percentiles and dashed line indicates threshold migration speed of 0.125 μm/min (equivalent to 15 μm per 2 h). (F) Angular distributions and regression analysis of stepwise cell migration speed. Migration speeds were binned according to their associated displacement angle and mean migration speed was computed for each bin. Only migration speeds within each treatment’s 95% confidence interval were included in this analysis. Rows highlighted in red are significantly different from Control. All data are from n = 3 independent experiments (cells per treatment: A, > 400 cells; B-D > 150 cells; E-F, 40 cells). ***, P < 0.0001 compared to Control.
Discussion
The process of 3D cell migration is fundamental to cancer invasion and metastasis.36,37 Notably, 3D migration is sensitive to extracellular regulation,2 and the interstitial connective tissue that tumor cells negotiate during invasion contains physical features including tissue interfaces, cell-scale microtracks, and well-organized fibrillar matrix that provide guidance cues and enable 3D cancer cell migration.10,11,18,26,38 Despite a longstanding historical appreciation for the effects of contact guidance and matrix alignment-induced morphological and migration anisotropy9,24,25,39 as well as more recent association of highly aligned stromal ECM with poor breast cancer patient outcome,13 the mechanisms by which cancer cells detect and respond to 3D ECM alignment remain to be determined.3 Here, we demonstrate that 3D matrix alignment induces spatial anisotropy of early 3D matrix-probing protrusions that leads to oriented cell spreading. This asymmetry of cellular morphodynamics and subsequent directed 3D migration is dependent on FAK and Rac1 signaling, implicating polarized adhesion signaling and active cell protrusion response as major drivers of 3D matrix guidance.
3D matrix alignment as an inducer of cell anisotropy
Directional cell migration results primarily from asymmetry of a cells’ extracellular cues, which can include soluble factors (chemotaxis), fluid flow (rheotaxis), stiffness (durotaxis), and adhesion ligands (haptotaxis).3 Regardless of the nature of the stimulus, directional migration requires both 1) the formation of a leading edge via establishment and maintenance of a front-rear polarization axis and 2) orientation of this front-rear axis in response to the stimulus.3,40 We show here that 3D ECM anisotropy in the form of coordinated fiber alignment is a potent inducer of directional migration in that it contributes to both leading edge formation and cell orientation. We demonstrate that 3D matrix alignment allows cells to quickly establish and orient a major axis along which they restrict much of their subsequent protrusion, spreading, and movement. Consistent with these findings, recent work has shown similar relationships between 3D cell protrusions and ECM structure and alignment.21,41 Using our unique morphodynamic analysis technique, we found here that cells in random collagen ECM eventually elongate, polarize, and begin to migrate, but ECM alignment accelerates all of these critical behaviors. Interestingly, longitudinal analysis of matrix structure surrounding spreading cells showed polarization of ECM prior to polarized cell spreading, suggesting that ECM pre-patterning by a cell may direct seemingly “random” behaviors within isotropic matrices. These findings, together with the observations that cells in aligned matrix generate fewer protrusions overall and are more migratory than those in random matrix, suggest that coordinated ECM cues such as alignment may allow cells to spread and migrate efficiently without needing to “explore” off-axis ECM features. This hypothesis is consistent with the “switching off” of protrusion we observed as migration initiated as well as the negative correlation between protrusion formation rate and migration speed we report in Fig. 2. While it remains to be determined whether this relationship applies to other modes of migration – for example, amoeboid or collective migration – our results suggest that 3D matrix alignment may promote leading edge formation and enable efficient oriented mesenchymal migration by spatially suppressing off-axis cell protrusion, thus preventing indiscriminate exploration of the pericellular space that slows 3D cell migration.
Molecular regulation of ECM alignment-induced cellular anisotropy
Studies in chemotaxing cells have revealed a critical role for polarized PI3K signaling in establishing and preserving the leading edge in response to soluble factor signaling.42 Notably, local PI3K activation results in signaling through secondary messengers that in turn activates the GTPase Rac1, which participates in regulation of cytoskeleton dynamics to drive directed migration.1,43,44 Interestingly, we show here that Rac1 activity, but not PI3K activity, is required for 3D cell spreading and the anisotropic cellular response to 3D matrix alignment, indicating that the Rac1 activation required for chemical and structural guidance of migration may be achieved through distinct mechanisms. Thus, pathways other than PI3K are likely responsible for controlling Rac1 activity that leads to protrusion, spreading, and migration in 3D matrix.44
In our screen of cell motility inhibitors, we found that only β1-integrin inhibition prevents cells from generating 3D matrix-probing protrusions. This effect is consistent with the established role of β1-integrin-ECM ligation in mediating protrusion and migration in 3D environments.35,45 Thus, while β1-integrin likely plays a critical role in the detection of and response to 3D matrix structure,46 the effect of function-blocking treatment on mesenchymal-type protrusion and spreading behavior was too destructive to allow further characterization in our model. Interestingly, despite ultimately being required for 3D migration, neither Rac1 nor FAK signaling are needed for matrix probing as both Rac1- and FAK-inhibited cells retain the ability to generate matrix-probing protrusions during early spreading. However, Rac1 and FAK inhibition completely eliminates the orientation bias of matrix-probing protrusions in aligned ECM, indicating that matrix probing is not merely an indiscriminate and random exploration of the pericellular space. Rather, our results suggest that cells regulate where 3D matrix-probing protrusions are formed and how these protrusions will behave using active Rac1- and FAK-dependent cellular feedback in response to local ECM structure.
Consistent with this model for matrix guidance of protrusions, we found that cells exhibit both transient filopodia-like projections that explore matrix pores and longer-lived protrusive structures that extend along ECM fibers. Considering the topography-sensing function of filopodia in 3D environments47 and the critical role of 3D ECM architecture in regulating cell-matrix adhesion maturation and dynamics,32,48 these observations suggest that cells interrogate their immediate matrix microenvironment using dynamic filopodia that can subsequently ligate discrete matrix fibers, resulting in adhesion maturation and signaling that locally regulates protrusion dynamics. Indeed, on 2D substrates, Rac1 can be activated by integrin-ECM ligation49 and the development of filopodia into pseudopodia requires integrin occupancy and downstream Rac1 signaling.50 Furthermore, Shibue et al. reported that filopodia-like protrusions precede and enable maturation of 3D cell-matrix adhesion plaques to trigger adhesion signaling.51 Although the authors of the previous study did not consider the role of ECM structure in physically guiding this process, recent work has shown that the structure and orientation of 3D matrix fibers adjacent to a cell can determine adhesion dynamics, size, composition, and signaling.32,48 Interestingly, Kubow et al. identified the available surface area presented by an ECM fiber as the major determinant of adhesion size and composition,32 and we found here that ECM fiber architecture adjacent to a spreading cell can spatially pre-pattern the formation of new cell-matrix adhesion sites (Fig. 7A,B). Thus, while any given fiber within random matrix likely provides adhesion substrate as a function of its angle relative to a radial cell protrusion, we propose that globally aligned ECM presents a defined axis across the cell where a high density of radially aligned fibers – with more available area for adhesion – can lead to polarized protrusion and adhesion maturation.
Three-dimensional matrix alignment produces regions of highly organized matrix fibers that likely provide physical guidance cues as well as ligand density-induced adhesion signaling.30 Additionally, since 3D matrix structure and mechanics are closely related, matrix alignment induces anisotropy of matrix mechanics52 that may guide 3D migration via durotaxis.53 It has been speculated that the cellular response to aligned 3D matrix is a combined effect of durotaxis (response to anisotropic mechanical properties) and haptotaxis (response to anisotropic ligand density).8 Interestingly, tyrosine kinase activity is required for several forms of physically directed migration including durotaxis54 and interstitial flow-induced rheotaxis,45 further implicating anisotropic adhesion signaling leading to polarization of downstream effectors as a regulator of physical cell migration guidance. The results here have led us to hypothesize that ECM alignment – through regional concentration of matrix fibers and stresses – provides local mechanochemical positive feedback at cell-matrix adhesions that serves to stabilize exploratory protrusions. Future work will directly test the hypothesis that local mechanical and structural features of the pericellular matrix predetermine 3D protrusion dynamics, cell spreading, and migration by spatially regulating adhesion signaling and its downstream effectors.
3D cell spreading as a reductionist model for mesenchymal migration
Defining the cellular and extracellular determinants of 3D cell migration will ultimately be critical to understanding how cancer cells invade and metastasize. Significant advances have been made toward a more comprehensive understanding of microenvironmental context-specific cell migration,55,56 but continued work is required to more fully explore the mechanisms of extracellular matrix guidance of migration. While the roles of ECM parameters such as dimensionality, stiffness, and pore size are increasingly appreciated, the impact of structural ECM organization on 3D cell migration is generally underappreciated. Notably, the microarchitecture of 3D cell migration microenvironments can vary widely in vitro and in vivo,57 and can be further altered through cell-induced matrix remodeling during migration.14,48,58 These observations underscore the critical need to better understand the role of a cell’s local ECM structure in determining cell behavior, but also make this problem particularly challenging. To unmask correlations between 3D matrix structure and 3D cell behavior, each of which is complex and dynamic, and each of which is constantly engaged in bidirectional interactions with the other, matrix remodeling mechanisms and matrix response mechanisms must be decoupled.
Here, we introduce a novel experimental approach to study the mechanisms of 3D cell migration by examining early 3D cell spreading within a naïve 3D ECM – that is, one that has not yet been altered by the cell being studied. Due to conserved adhesive, cytoskeletal, contractile, and proteolytic machinery between ECM response and ECM remodeling processes, it is conceivable that these processes cannot be completely decoupled. Nonetheless, we propose that our model reasonably separates response to matrix, which occurs immediately, from matrix remodeling (and subsequent response to cell-modified matrix), which occurs over longer time scales. Since cells are analyzed from a common rounded-morphology starting point and the naïve pericellular matrix architecture can be determined microscopically and experimentally tuned, many of the challenges associated with defining determinants of 3D migration – diverse cellular states, unknown cell history, and ECM properties that are locally heterogeneous, dynamic, and poorly defined59 – are alleviated. Cell migration has been described as highly coordinated cell spreading,60 and the prevailing assumption of our model is that the mechanisms underlying a given subcellular behavior during early 3D cell spreading (e.g., protrusion stabilization by matrix fibers) are reflective of the mechanisms underlying that behavior during 3D migration. Despite differences between the dynamics of cell spreading and migration, the Sheetz group and others have used similar strategies involving the time-course analysis of cell signaling and subcellular behaviors to define the rate-limiting steps of complex cell processes including 2D cell spreading and adhesion-dependent survival signaling.51,61,62 In its initial application here, we use the 3D cell spreading model to identify and study the effects of 3D ECM alignment on cell behavior. We anticipate that our reductionist model could be used to further decouple the “detection” and “response” elements of 3D matrix guidance by combining analysis of early cell signaling with the morphodynamic analysis framework presented here. Interestingly, our finding that cells can physically remodel naïve ECM to induce anisotropy prior to cell spreading raises questions regarding the role of actomyosin contraction, which has important roles during random 3D migration,26,34,63 in alignment-driven cellular processes. One working hypothesis is that aligned ECM promotes sustained adhesion foci that signal to cytoskeletal regulators such as Rac1 to form a positive feedback loop that leads to polarized elongation and migration. Since these adhesion-rich regions would mechanically couple the cytoskeleton to the ECM, they would also function in the transfer of intracellular loads to the ECM, which can result in both cell displacement and matrix remodeling.56,64,65 Interestingly, in the context of alignment-directed cell migration, the extent to which mechanical feedback in the form of active tugging on fibers66 contributes to the detection and response phases of contact guidance remains to be determined.
Broadly, the anisotropy of cell phenotype we observe within aligned matrix directly demonstrates the influence of a cell’s local ECM structure on its protrusion, spreading, and migration behaviors and suggests that the “randomness” of protrusions observed in random ECM environments may actually be a consequence of cells interacting deterministically with their randomly organized pericellular matrix. Thus, 3D cell migration that is presumed to be random may actually be directed by a “map” of micro-heterogeneities in the surrounding ECM structure that is either pre-existing or the result of cell-mediated matrix remodeling. This notion is supported by recent evidence indicating that 3D cell migration does not follow a true random walk due in part to the directional anisotropy that is characteristic of migration within 3D environments.67 Since in our 3D cell spreading experimental model, matrix alignment induces an “expected” matrix-dependent behavior (i.e., anisotropy of protrusions, spreading, and movement), our results here provide critical insight into the mechanisms by which cells detect and respond to local ECM structure. For example, since FAK and Rac1 inhibition interfere with the expected anisotropic cellular response to aligned matrix, these pathways are likely required for cells to respond to matrix structure in general.48,68
Conclusions
We find here that 3D matrix alignment induces adhesion- and Rac1-dependent anisotropy of cancer cell morphodynamics that leads to directional cell migration. Aligned ECM suppresses off-axis and promotes on-axis behaviors including early matrix-probing protrusion formation, cell elongation, and movement, resulting in the acceleration and increased efficiency of 3D migration. These findings underscore the importance of extracellular guidance of 3D cell migration and could have implications ranging from the study of 3D cell migration mechanisms in vitro to the development of therapeutic strategies targeting contact guidance-mediated cancer invasion in vivo.
Insight Box.
The tumor microenvironment is composed of a complex network of extracellular matrix fibers. Alignment of these fibers has been shown to facilitate metastatic migration, however, the molecular mechanisms driving this behavior remain unclear. Here, we engineered matrices to recapitulate the alignment of collagen found in the tumor stroma and used cell spreading as a reductionist model of cell protrusion dynamics. To understand how cells polarize and move in these matrices, time-lapse microscopy of spreading cells was employed to characterize early cell protrusion decisions in response to aligned versus random matrices. Our data indicate that aligned matrices induce FAK- and Rac1-mediated protrusion dynamics along the fibers that ultimately lead to cell polarization and directional migration.
Acknowledgements
This work was supported by the Cornell Center on the Microenvironment & Metastasis through Award Number U54CA143876 from the National Cancer Institute to C.A.R.-K. and a National Science Foundation Graduate Research Fellowship to S.P.C.
References
- 1.Ridley AJ, Schwartz MA, Burridge K, Firtel RA, Ginsberg MH, Borisy G, Parsons JT, Horwitz AR. Science. 2003;302:1704–1709. doi: 10.1126/science.1092053. [DOI] [PubMed] [Google Scholar]
- 2.Friedl P, Wolf K. J Cell Biol. 2010;188:11–19. doi: 10.1083/jcb.200909003. [DOI] [PMC free article] [PubMed] [Google Scholar]
- 3.Petrie RJ, Doyle AD, Yamada KM. Nat Rev Mol Cell Bio. 2009;10:538–549. doi: 10.1038/nrm2729. [DOI] [PMC free article] [PubMed] [Google Scholar]
- 4.Iden S, Collard JG. Nat Rev Mol Cell Bio. 2008;9:846–859. doi: 10.1038/nrm2521. [DOI] [PubMed] [Google Scholar]
- 5.Bordeleau F, Tang LN, Reinhart-King CA. Phys Biol. 2013;10:065004. doi: 10.1088/1478-3975/10/6/065004. [DOI] [PMC free article] [PubMed] [Google Scholar]
- 6.Sundararaghavan HG, Masand SN, Shreiber DI. J Neurotrauma. 2011;28:2377–2387. doi: 10.1089/neu.2010.1606. [DOI] [PMC free article] [PubMed] [Google Scholar]
- 7.Hadjipanayi E, Mudera V, Brown RA. Cell Motil Cytoskeleton. 2009;66:121–128. doi: 10.1002/cm.20331. [DOI] [PubMed] [Google Scholar]
- 8.Provenzano PP, Inman DR, Eliceiri KW, Trier SM, Keely PJ. Biophys J. 2008;95:5374–5384. doi: 10.1529/biophysj.108.133116. [DOI] [PMC free article] [PubMed] [Google Scholar]
- 9.Dickinson RB, Guido S, Tranquillo RT. Ann Biomed Eng. 1994;22:342–356. doi: 10.1007/BF02368241. [DOI] [PubMed] [Google Scholar]
- 10.Gritsenko PG, Ilina O, Friedl P. J Pathol. 2012;226:185–199. doi: 10.1002/path.3031. [DOI] [PubMed] [Google Scholar]
- 11.Lu P, Weaver VM, Werb Z. J Cell Biol. 2012;196:395–406. doi: 10.1083/jcb.201102147. [DOI] [PMC free article] [PubMed] [Google Scholar]
- 12.Beerling E, Ritsma L, Vrisekoop N, Derksen PWB, van Rheenen J. J Cell Sci. 2011;124:299–310. doi: 10.1242/jcs.072728. [DOI] [PMC free article] [PubMed] [Google Scholar]
- 13.Conklin MW, Eickhoff JC, Riching KM, Pehlke CA, Eliceiri KW, Provenzano PP, Friedl A, Keely PJ. Am J Pathol. 2011;178:1221–1232. doi: 10.1016/j.ajpath.2010.11.076. [DOI] [PMC free article] [PubMed] [Google Scholar]
- 14.Kraning-Rush CM, Carey SP, Califano JP, Smith BN, Reinhart-King CA. Phys Biol. 2011;8:015009. doi: 10.1088/1478-3975/8/1/015009. [DOI] [PMC free article] [PubMed] [Google Scholar]
- 15.Kim A, Lakshman N, Petroll WM. Exp Cell Res. 2006;312:3683–3692. doi: 10.1016/j.yexcr.2006.08.009. [DOI] [PMC free article] [PubMed] [Google Scholar]
- 16.Brownfield DG, Venugopalan G, Lo A, Mori H, Tanner K, Fletcher DA, Bissell MJ. Curr Biol. 2013;23:703–709. doi: 10.1016/j.cub.2013.03.032. [DOI] [PMC free article] [PubMed] [Google Scholar]
- 17.Shi Q, Ghosh RP, Engelke H, Rycroft CH, Cassereau L, Sethian JA, Weaver VM, Liphardt JT. Proc Natl Acad Sci U S A. 2014;111:658–663. doi: 10.1073/pnas.1311312110. [DOI] [PMC free article] [PubMed] [Google Scholar]
- 18.Provenzano PP, Eliceiri KW, Campbell JM, Inman DR, White JG, Keely PJ. BMC Med. 2006;4:38. doi: 10.1186/1741-7015-4-38. [DOI] [PMC free article] [PubMed] [Google Scholar]
- 19.Carey SP, Starchenko A, McGregor AL, Reinhart-King CA. Clin Exp Metastasis. 2013;30:615–630. doi: 10.1007/s10585-013-9565-x. [DOI] [PMC free article] [PubMed] [Google Scholar]
- 20.Gaggioli C, Hooper S, Hidalgo-Carcedo C, Grosse R, Marshall JF, Harrington K, Sahai E. Nat Cell Biol. 2007;9:1392–1400. doi: 10.1038/ncb1658. [DOI] [PubMed] [Google Scholar]
- 21.Riching KM, Cox BL, Salick MR, Pehlke C, Riching AS, Ponik SM, Bass BR, Crone WC, Jiang Y, Weaver AM, Eliceiri KW, Keely PJ. Biophys J. 2014;107:2546–2558. doi: 10.1016/j.bpj.2014.10.035. [DOI] [PMC free article] [PubMed] [Google Scholar]
- 22.Levental KR, Yu H, Kass L, Lakins JN, Egeblad M, Erler JT, Fong SFT, Csiszar K, Giaccia A, Weninger W, Yamauchi M, Gasser DL, Weaver VM. Cell. 2009;139:891–906. doi: 10.1016/j.cell.2009.10.027. [DOI] [PMC free article] [PubMed] [Google Scholar]
- 23.Wolf K, Müller R, Borgmann S, Bröcker E-B, Friedl P. Blood. 2003;102:3262–3269. doi: 10.1182/blood-2002-12-3791. [DOI] [PubMed] [Google Scholar]
- 24.Tranquillo RT, Durrani MA, Moon AG. Cytotechnology. 1992;10:225–250. doi: 10.1007/BF00146673. [DOI] [PubMed] [Google Scholar]
- 25.Weiss P. J Exp Zool. 1934;68:393–448. [Google Scholar]
- 26.Carey SP, Rahman A, Kraning-Rush CM, Romero B, Somasegar S, Torre OM, Williams RM, Reinhart-King CA. Am J Physiol Cell Physiol. 2015;308:C436–C447. doi: 10.1152/ajpcell.00225.2014. [DOI] [PMC free article] [PubMed] [Google Scholar]
- 27.Deome KB, Faulkin LJ, Bern HA, Blair PB. Cancer Res. 1959;19:515–520. [PubMed] [Google Scholar]
- 28.Carey SP, Kraning-Rush CM, Williams RM, Reinhart-King CA. Biomaterials. 2012;33:4157–4165. doi: 10.1016/j.biomaterials.2012.02.029. [DOI] [PMC free article] [PubMed] [Google Scholar]
- 29.Guo C, Kaufman LJ. Biomaterials. 2007;28:1105–1114. doi: 10.1016/j.biomaterials.2006.10.010. [DOI] [PubMed] [Google Scholar]
- 30.Provenzano PP, Inman DR, Eliceiri KW, Keely PJ. Oncogene. 2009;28:4326–4343. doi: 10.1038/onc.2009.299. [DOI] [PMC free article] [PubMed] [Google Scholar]
- 31.Cukierman E, Pankov R, Stevens DR, Yamada KM. Science. 2001;294:1708–1712. doi: 10.1126/science.1064829. [DOI] [PubMed] [Google Scholar]
- 32.Kubow KE, Conrad SK, Horwitz AR. Curr Biol. 2013;23:1607–1619. doi: 10.1016/j.cub.2013.06.053. [DOI] [PMC free article] [PubMed] [Google Scholar]
- 33.Huveneers S, Danen EHJ. J Cell Sci. 2009;122:1059–1069. doi: 10.1242/jcs.039446. [DOI] [PubMed] [Google Scholar]
- 34.Wolf K, te Lindert M, Krause M, Alexander S, te Riet J, Willis AL, Hoffman RM, Figdor CG, Weiss SJ, Friedl P. J Cell Biol. 2013;201:1069–1084. doi: 10.1083/jcb.201210152. [DOI] [PMC free article] [PubMed] [Google Scholar]
- 35.Zaman MH, Trapani LM, Sieminski AL, MacKellar D, Gong H, Kamm RD, Wells A, Lauffenburger DA, Matsudaira P. Proc Natl Acad Sci USA. 2006;103:10889–10894. doi: 10.1073/pnas.0604460103. [DOI] [PMC free article] [PubMed] [Google Scholar]
- 36.Doyle AD, Petrie RJ, Kutys ML, Yamada KM. Curr Opin Cell Biol. 2013;25:642–649. doi: 10.1016/j.ceb.2013.06.004. [DOI] [PMC free article] [PubMed] [Google Scholar]
- 37.Yamaguchi H, Wyckoff J, Condeelis J. Curr Opin Cell Biol. 2005;17:559–564. doi: 10.1016/j.ceb.2005.08.002. [DOI] [PubMed] [Google Scholar]
- 38.Alexander S, Weigelin B, Winkler F, Friedl P. Curr Opin Cell Biol. 2013;25:659–671. doi: 10.1016/j.ceb.2013.07.001. [DOI] [PubMed] [Google Scholar]
- 39.Dunn GA, Ebendal T. Exp Cell Res. 1978;111:475–479. doi: 10.1016/0014-4827(78)90196-9. [DOI] [PubMed] [Google Scholar]
- 40.Etienne-Manneville S. Oncogene. 2008;27:6970–6980. doi: 10.1038/onc.2008.347. [DOI] [PubMed] [Google Scholar]
- 41.Fraley SI, Wu P, He L, Feng Y, Krisnamurthy R, Longmore GD, Wirtz D. Sci Rep. 2015;5:14580. doi: 10.1038/srep14580. [DOI] [PMC free article] [PubMed] [Google Scholar]
- 42.Wang F. Cold Spring Harb Perspect Biol. 2009;1:1–16. doi: 10.1101/cshperspect.a002980. [DOI] [PMC free article] [PubMed] [Google Scholar]
- 43.Welch HCE, Coadwell WJ, Stephens LR, Hawkins PT. FEBS Lett. 2003;546:93–97. doi: 10.1016/s0014-5793(03)00454-x. [DOI] [PubMed] [Google Scholar]
- 44.Hall A. Science. 1998;279:509–514. doi: 10.1126/science.279.5350.509. [DOI] [PubMed] [Google Scholar]
- 45.Polacheck WJ, German AE, Mammoto A, Ingber DE, Kamm RD. Proc Natl Acad Sci. 2014;111:2447–2452. doi: 10.1073/pnas.1316848111. [DOI] [PMC free article] [PubMed] [Google Scholar]
- 46.Jokinen J, Dadu E, Nykvist P, Käpylä J, White DJ, Ivaska J, Vehviläinen P, Reunanen H, Larjava H, Häkkinen L, Heino J. J Biol Chem. 2004;279:31956–31963. doi: 10.1074/jbc.M401409200. [DOI] [PubMed] [Google Scholar]
- 47.Albuschies J, Vogel V. Sci Reports. 2013;3:1658. doi: 10.1038/srep01658. [DOI] [PMC free article] [PubMed] [Google Scholar]
- 48.Baker BM, Trappmann B, Wang WY, Sakar MS, Kim IL, Shenoy VB, Burdick JA, Chen CS. Nat Mater. 2015;14 doi: 10.1038/nmat4444. [DOI] [PMC free article] [PubMed] [Google Scholar]
- 49.Price LS, Leng J, Schwartz MA, Bokoch GM. Mol Biol Cell. 1998;9:1863–1871. doi: 10.1091/mbc.9.7.1863. [DOI] [PMC free article] [PubMed] [Google Scholar]
- 50.Guillou H, Depraz-Depland A, Planus E, Vianay B, Chaussy J, Grichine A, Albigès-Rizo C, Block MR. Exp Cell Res. 2008;314:478–488. doi: 10.1016/j.yexcr.2007.10.026. [DOI] [PubMed] [Google Scholar]
- 51.Shibue T, Brooks MW, Fatih Inan M, Reinhardt F, Weinberg RA. Cancer Discov. 2012;2:706–721. doi: 10.1158/2159-8290.CD-11-0239. [DOI] [PMC free article] [PubMed] [Google Scholar]
- 52.Roeder BA, Kokini K, Voytik-Harbin SL. J Biomech Eng. 2009;131:031004. doi: 10.1115/1.3005331. [DOI] [PubMed] [Google Scholar]
- 53.Lo CM, Wang HB, Dembo M, Wang YL. Biophys J. 2000;79:144–152. doi: 10.1016/S0006-3495(00)76279-5. [DOI] [PMC free article] [PubMed] [Google Scholar]
- 54.Wang HB, Dembo M, Hanks SK, Wang Y. Proc Natl Acad Sci U S A. 2001;98:11295–11300. doi: 10.1073/pnas.201201198. [DOI] [PMC free article] [PubMed] [Google Scholar]
- 55.Willis AL, Sabeh F, Li X-Y, Weiss SJ. J Microsc. 2013;251:250–260. doi: 10.1111/jmi.12064. [DOI] [PMC free article] [PubMed] [Google Scholar]
- 56.Carey SP, D’Alfonso TM, Shin SJ, Reinhart-King CA. Crit Rev Oncol/Hematol. 2012;83:170–183. doi: 10.1016/j.critrevonc.2011.11.005. [DOI] [PMC free article] [PubMed] [Google Scholar]
- 57.Wolf K, Alexander S, Schacht V, Coussens LM, von Andrian UH, van Rheenen J, Deryugina E, Friedl P. Semin Cell Dev Biol. 2009;20:931–941. doi: 10.1016/j.semcdb.2009.08.005. [DOI] [PMC free article] [PubMed] [Google Scholar]
- 58.Bloom RJ, George JP, Celedon A, Sun SX, Wirtz D. Biophys J. 2008;95:4077–4088. doi: 10.1529/biophysj.108.132738. [DOI] [PMC free article] [PubMed] [Google Scholar]
- 59.Snijder B, Pelkmans L. Nat Rev Mol Cell Biol. 2011;12:119–125. doi: 10.1038/nrm3044. [DOI] [PubMed] [Google Scholar]
- 60.Lauffenburger DA, Horwitz AF. Cell. 1996;84:359–369. doi: 10.1016/s0092-8674(00)81280-5. [DOI] [PubMed] [Google Scholar]
- 61.Machacek M, Hodgson L, Welch C, Elliott H, Pertz O, Nalbant P, Abell A, Johnson GL, Hahn KM, Danuser G. Nature. 2009;461:99–103. doi: 10.1038/nature08242. [DOI] [PMC free article] [PubMed] [Google Scholar]
- 62.Dubin-Thaler BJ, Hofman JM, Cai Y, Xenias H, Spielman I, Shneidman AV, David LA, Döbereiner HG, Wiggins CH, Sheetz MP. PLoS One. 2008;3:e3735. doi: 10.1371/journal.pone.0003735. [DOI] [PMC free article] [PubMed] [Google Scholar]
- 63.Sun W, Lim CT, Kurniawan NA. J R Soc Interface. 2014;11 doi: 10.1098/rsif.2014.0638. [DOI] [PMC free article] [PubMed] [Google Scholar]
- 64.Giannone G, Dubin-Thaler BJ, Rossier O, Cai Y, Chaga O, Jiang G, Beaver W, Döbereiner H-G, Freund Y, Borisy G, Sheetz MP. Cell. 2007;128:561–575. doi: 10.1016/j.cell.2006.12.039. [DOI] [PMC free article] [PubMed] [Google Scholar]
- 65.Pasapera AM, Schneider IC, Rericha E, Schlaepfer DD, Waterman CM. J Cell Biol. 2010;188:877–890. doi: 10.1083/jcb.200906012. [DOI] [PMC free article] [PubMed] [Google Scholar]
- 66.Plotnikov SV, Pasapera AM, Sabass B, Waterman CM. Cell. 2012;151:1513–1527. doi: 10.1016/j.cell.2012.11.034. [DOI] [PMC free article] [PubMed] [Google Scholar]
- 67.Wu P-H, Giri A, Sun SX, Wirtz D. Proc Natl Acad Sci U S A. 2014;111:3949–3954. doi: 10.1073/pnas.1318967111. [DOI] [PMC free article] [PubMed] [Google Scholar]
- 68.Schwarz US, Gardel ML. J Cell Sci. 2012;125:3051–3060. doi: 10.1242/jcs.093716. [DOI] [PMC free article] [PubMed] [Google Scholar]