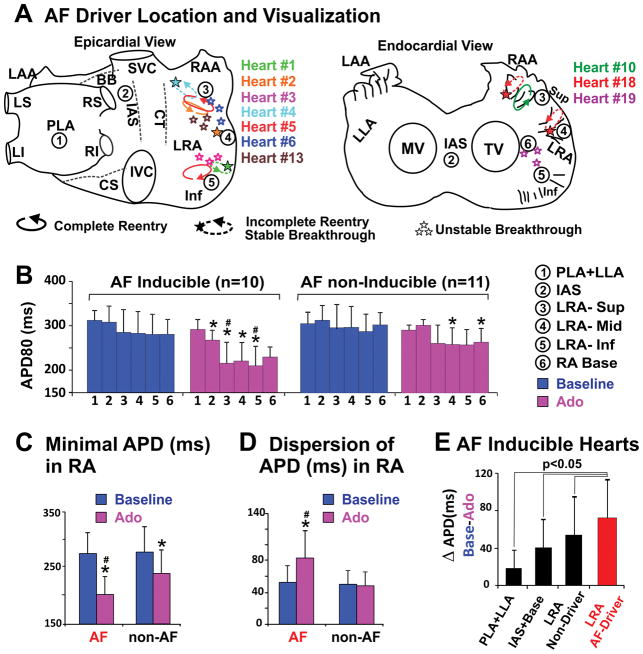
Figure 6. Distribution patterns of AF drivers and APD across the human atria.
A, Locations and visualizations of AF drivers in ten AF-inducible hearts shown on epicardial and endocardial atrial schematics. Heart number is distinguished by color, and drivers from the same heart are labeled with the corresponding color. A complete reentry pattern is denoted by a complete ellipsoidal arrow; partial reentry pattern by a dashed ellipsoidal arrow. Circled numbers 1–6 indicate the regions where APD80 was measured in panel B. B, Average APD80 of different atrial regions in AF inducible and AF non-inducible groups at baseline and adenosine perfusion. C–D, Minimal APD and APD dispersion in the RA of AF inducible and AF non-inducible preparations at baseline and adenosine perfusion. E, APD shortening in AF driver and non-driver regions. Values are presented in mean±SD. * denotes p<0.05 vs baseline, # denotes p< 0.05 vs AF non-inducible group. Abbreviations as in Figures 1–2.

