

Summary
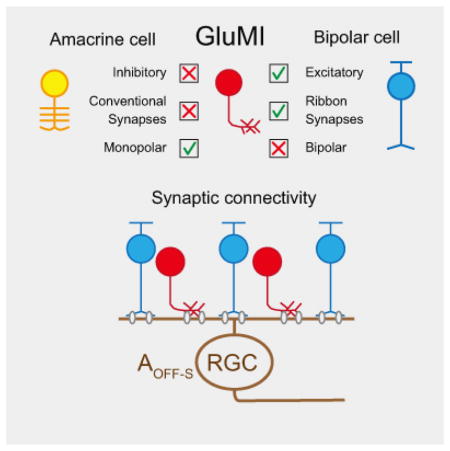
Excitatory and inhibitory neurons in the central nervous system (CNS) are distinguished by several features, including morphology, transmitter content and synapse architecture [1]. Such distinctions are exemplified in the vertebrate retina. Retinal bipolar cells are polarized glutamatergic neurons receiving direct photoreceptor input, whereas amacrine cells are usually monopolar inhibitory interneurons with synapses almost exclusively in the inner retina [2]. Bipolar but not amacrine cell synapses have presynaptic ribbon-like structures at their transmitter release sites. We discovered a monopolar interneuron in the mouse retina that resembles amacrine cells morphologically, but that is glutamatergic and unexpectedly, makes ribbon synapses. These glutamatergic monopolar interneurons (GluMIs) do not receive direct photoreceptor input and their light responses are strongly shaped by both ON- and OFF-pathway derived inhibitory input. GluMIs contact and make almost as many synapses as Type 2 OFF bipolar cells onto OFF-sustained A-type (AOFF-S) retinal ganglion cells (RGCs). However, GluMIs and Type 2 OFF bipolar cells possess functionally distinct light-driven responses and may therefore mediate separate components of the excitatory synaptic input to AOFF-S RGCs. The identification of GluMIs thus unveils a novel cellular component of excitatory circuits in the vertebrate retina, underscoring the complexity in defining cell types even in this well-characterized region of the CNS.
eTOC blurb
Della Santina et al. identified a new neuron type in the mouse retina. These cells (GluMIs) resemble inhibitory interneurons morphologically, but, make glutamatergic ribbon synapses in the inner retina. GluMIs have light-response features that are distinct from known excitatory interneurons and thus provide a novel pathway for excitation in the retina.
Results and Discussion
GluMIs are excitatory monopolar interneurons with classical features of retinal bipolar cells
Retinal bipolar cells comprise two major subclasses: ON bipolar cells depolarize, and OFF bipolar cells hyperpolarize, to light increments [3]. ON bipolar cells stratify in approximately the inner half of the inner plexiform layer (IPL) and OFF bipolar cells stratify in the outer half of the IPL. We previously labeled ON bipolar cells using the metabotropic glutamate receptor 6 (grm6) promoter to drive expression of yellow fluorescent protein, YFP, [4] and OFF bipolar cells using the promoter for Vsx1, a homeobox gene required for terminal differentiation of these bipolar cells [5,6], to drive expression of cerulean, a cyan colored fluorescent protein [7]. Neurons in the Vsx1-cerulean mouse retina are labeled sparsely [7] (Fig. 1A), allowing the morphology of individual cells to be identified (Fig. 1B). In addition to the expected labeling of all OFF bipolar cell types (Types 1–4), cerulean was expressed by a monopolar neuron stratifying within the outer sublamina of the IPL, where Type 1 and Type 2 OFF bipolar cells stratify [8] (Fig. 1A,B,C). Neurons with this morphology were also, surprisingly, found in grm6-YFP retinas in which ON bipolar cells are labeled (Fig. S1G,H). These monopolar neurons had average arbor and somal diameters of 24.3 ± 1.2 and 6.9 ± 0.1 μm, respectively (Fig. 1D). The somata and arbor size of these monopolar neurons are thus characteristic of OFF bipolar cells [7] and of narrow-field amacrine cells (<150 μm diameter) [9], which are usually inhibitory glycinergic interneurons [10].
Figure 1. A novel type of glutamatergic monopolar interneuron (GluMI) that lacks expression of amacrine cell markers.

A: Cerulean (Cer) expression in a sparse population of neurons in the retina of Vsx1- cerulean mice.
B: Side-view of the dashed area in A shows a typical OFF bipolar cell and another cell type (red dot) that does not have a dendritic arbor in the outer plexiform layer (OPL). This monopolar cell has a single arbor that stratifies within the same strata in the inner plexiform layer (IPL) as the bipolar cell.
C: En-face view of neighboring Vsx1-cerulean monopolar cells (red dots).
D: Quantification of somata size (diameter of a circle of equivalent area) and arbor size of the monopolar cell. Number of cells = 31. Error bars, S.E.M.
E–H: Retinal sections labeled for the two major GABA synthetizing enzymes, GAD67 and GAD65 (E,F), the glycine transporter, GlyT1 (G) and the pan-amacrine cell marker, syntaxin (H). The monopolar cells are indicated by the asterisks. Insets show immunoreactivity surrounding the cell body of interest (asterisk).
I: Monopolar cells (asterisks) co-labeled with the glutamate transporter, VGLUT1, found in excitatory neurons of the retina (See also Movie S1).
J: Single confocal optical section from (I) showing colocalization of VGLUT1 with the neurites of the monopolar cells. Insets show 2x-magnification of regions indicated by the arrows.
K: En-face view of a monopolar celI in the Vsx1-cerulean (maximum intensity projection of a confocal image stack). Immunolabeling for ribbons (anti-CtBP2) only within the digitized volumetric mask of the cell (cerulean signal) is shown. Inset: 2x-magnification of the boxed region (See also Movie S2).
See also Figures S1 and S2.
The Vsx1-cerulean positive monopolar cells thus most closely resemble amacrine cells. Nonetheless, these cells do not express the GABA synthesizing enzymes, GAD67 or GAD65 (Fig. 1E,F), found in GABAergic amacrine cells, nor the glycine transporter, GlyT1, expressed by glycinergic amacrine cells (Fig. 1G). Thus, these monopolar cells are not GABAergic or glycinergic neurons. In fact, they are not immunoreactive for syntaxin, a pan-amacrine cell marker [11] (Fig. 1H). Instead, we found that the monopolar cells express proteins characteristic of excitatory retinal neurons. Like bipolar cell axons, the monopolar neuron’s processes in the IPL contain vesicular glutamate transporter 1 (VGLUT1) (Fig. 1I,J and Movie S1), suggesting that they are glutamatergic interneurons. We thus name these cells glutamatergic monopolar interneurons, or GluMIs.
GluMIs observed in the Vsx1-cerulean mouse line have arbor and somata sizes that are similar to that of Type 1 and 2 OFF bipolar cells that costratify in the same sublayer of the IPL (OFF bipolar arbors: 23.6±5.4 μm, p=0.9, soma: 6.7±1.5 μm, p=0.1, Wilcoxon rank-sum test, N=19 cells compared to data in Fig. 1D). Although the arbor morphology and stratification of GluMIs resemble the axons of Type 1 and Type 2 OFF bipolar cells, GluMIs are not labeled by specific markers of these two bipolar cell types: NK3R, which labels Type 1 and 2 OFF bipolar cells, and Synaptotagmin 2, which labels Type 2 OFF bipolar cells [12] (Fig. S1A–D). Rather, they are immunoreactive for the calcium binding protein, CaBP5 (Fig. S1,E,F), a marker of Type 3 OFF, Type 5 ON cone bipolar cell types, and rod bipolar cells [13].
The resemblance of GluMIs to amacrine cells in morphology but bipolar cells in transmitter content and protein expression raises the question of whether GluMIs attain their monopolar morphology following a developmental program typical of amacrine cells or of bipolar cells. Amacrine and bipolar cells demonstrate differences in developmental timing and how they attain their characteristic morphology [14]. Amacrine cells are born earlier than bipolar cells, migrate freely to reach their final locations by birth, and then elaborate their arbors within the IPL [15]. Bipolar cells instead maintain connections to the apical and basal laminae of the retina as axonal and dendritic processes elaborate within the OPL and IPL from the apical and basal neuroepithelial-like processes. The apical and basal processes retract by postnatal day 10 (P10), and bipolar cells acquire their polarized morphology [16].
To determine how GluMIs attain their characteristic morphology, we examined Vsx1-cerulean retinas across postnatal development. At postnatal day 5 (P5), all the labeled neurons in the retinal periphery had the morphology of an immature bipolar cell (Fig. S2A; P5 periphery). However, in central retina, some cells were observed to have short, unbranching apical processes that were detached from the apical membrane, but with a terminal arbor in the IPL (Fig. S2A: P5 center, asterisk). Other neurons with an axonal arbor had an apical process that extended all the way to the external limiting membrane. By P7, most OFF bipolar cells had retracted their apical processes and elaborated some dendrites, while their axons appeared stratified and their basal processes had retracted. At the same time, some labeled neurons appeared to be in the process of retracting their entire apical process towards the cell body (Fig. S2A: P7 arrow). This retraction is more evident at P10 when some cells have only a thin apically directed process (Fig. S2A: P10 arrow). These thin processes were absent in P21 and older retina. Thus, GluMIs likely differentiate around the same time as bipolar cells and share an initial polarized morphology similar to bipolar cells. We propose that GluMIs retract their apical process completely, resulting in a monopolar form, whereas bipolar cells retract their apical process only up to their dendritic terminals (schematized in Fig. S2B).
GluMIs form ribbon synapses with postsynaptic targets in the IPL
To ascertain whether GluMIs share synaptic features that are characteristic of bipolar cells, we performed immunostaining for C–terminal binding protein 2 (CtBP2), a marker of ribbon synapses found typically in bipolar cells and photoreceptors. Indeed, GluMI processes contain CtBP2-immunopositive clusters (Fig. 1K and Movie S2; Fig. S1G,H). To confirm that this labeling unequivocally identifies synaptic ribbons in GluMIs, we carried out serial block face scanning electron microscopy (SBFSEM) of fluorescently identified GluMIs and reconstructed their synapses. Using the Vsx1-cerulean line, we first identified GluMIs and then used a titanium-sapphire laser to burn fiducial marks (boxes) above the axonal arbor and at the level of the cell body, a method called near-infrared branding [17]. These fiducial marks allowed us to identify the GluMI under SBFSEM (Fig. 2A). Two SBFSEM reconstructions confirmed that GluMIs do not possess dendrites. In these EM reconstructions, we classified processes that contained clusters of synaptic vesicles, but no ribbons, as originating from amacrine cells whereas vesicle-free processes were classified as belonging to RGCs. Both GluMIs that were reconstructed contained ribbon structures at classic ‘dyad’ arrangements in which the ribbon is apposed to two postsynaptic processes, including processes of RGCs and amacrine cells (Fig. 2B). The total number of ribbons observed within the arbor of a GluMI that was fully reconstructed by EM (72 ribbons for the cell in Fig. 2) is similar to that obtained by CtBP2 immunostaining (77 ± 29 ribbons, n= 7 cells).
Figure 2. Synapses onto and from a GluMI reconstructed by SBFSEM.

A: Top insets: Multiphoton imaging of a GluMI in the Vsx1-Cerulean line. Fiducial marks were burned around the GluMI cell body (asterisk) using an infrared laser. These burn marks enabled the GluMI cell body to be identified under SBFSEM, and is pseudocolored here in cyan. Main panel: 3D reconstruction of GluMI and its synapse distributions (ribbon synapses in yellow and synaptic input from amacrine cell (AMC) in magenta).
B: Consecutive SEM sections showing a GluMI ribbon synapse (yellow arrowhead and inset) at a dyad, as well as a reciprocal synapse from an amacrine cell (magenta arrowhead).
C: Amacrine synapses (white arrow heads) onto the GluMI (cyan) from a long-range (LR) AMC (yellow-green) and a short-range (SR) AMC (magenta). 3D reconstruction of LR- and SR-AMC processes, and the locations of their respective synapses (LR synapse, red; SR synapse, yellow).
See also Figures S2 and S3.
GluMIs receive a diversity of conventional synaptic contact but not ribbon contact
SBFSEM further revealed that GluMIs receive numerous conventional, presumed amacrine cell, synapses (Fig. 2), but no ribbon synapses. We therefore explored the possibility of alternative excitatory inputs. One candidate is the VGluT3 amacrine cell, which provides glutamatergic input to specific ganglion cell types [18–20]. However, VGluT3 amacrine stratification in the IPL does not overlap with GluMI dendrites (Fig. S3A). Likewise, OFF cholinergic starburst amacrine cells do not costratify with the GluMI neurites (Fig. S3B). It is thus unlikely that these amacrine cell types provide major synaptic input onto GluMIs.
GluMIs are heavily innervated by other amacrine cell types (Fig. 2). In fact, we counted 74 conventional synapses from long-range processes (presumed GABAergic), as well as 46 from short-range processes (presumed glycinergic) [21] (Fig. 2C). Innervation from amacrine cells could be reciprocal i.e. GluMIs can synapse onto an amacrine cell that also forms synapses on the GluMI (Fig. 2B), or non-reciprocal. Synaptic contact with both GABAergic and glycinergic amacrine cells was corroborated by the expression of GABA and glycine receptors on the arbors of GluMIs (Fig. S3C–H). Immunolabeling for GABAA subunits revealed that GluMIs are relatively rich in GABAAα1 and α3 subunits compared to GABAC receptors (Fig. S3C–E). GABAAα2 receptors were not assessed due to their localization mainly at the level of cholinergic amacrine processes [22], outside the stratification level of GluMIs in the IPL. In addition to GABA receptors, α1 and α3 but not α2 subunits of the glycine receptor were also abundant on GluMI processes (Fig. S3F–H). Therefore, similar to OFF bipolar cells [23], inhibitory synapses onto GluMIs originate from both GABAergic and glycinergic amacrine cells.
GluMIs provide a functionally distinct OFF pathway for excitatory signals to reach the inner retina
How do GluMIs fit into the retinal circuitry? Our EM observations revealed that GluMIs contact OFF RGC dendrites (Fig. 3A, B). Because the dendritic arbor of the RGC in Fig. 3A exceeded the scanned SBFSEM region of interest, we could not identify the RGC type. Thus, we biolistically labeled RGCs and their glutamatergic postsynaptic sites (by expressing YFP tagged PSD95, a scaffolding protein at glutamatergic synapses, PSD95-YFP, [24,25]) in the Vsx1-cerulean retina. We identified putative synaptic contacts between GluMIs and RGCs based on the close apposition of PSD95-YFP within the RGC dendrites and immunolabeled ribbons within GluMI processes.
Figure 3. GluMIs and Type 2 BCs form synapses with AOFF-S ganglion cells.

A: Ultrastructural reconstruction of a GluMI (cyan) and a bipolar cell (BC, green) that synapse onto the same retinal ganglion cell (RGC, brown). GluMI synapses (yellow) and BC synapse (red). From the dendrite of the RGC that was contacted by the GluMI, we traced an individual ribbon synapse back to the BC of origin, which resembles a Type 2 BC.
B: Example of a GluMI (asterisk) ribbon synapse (yellow arrow head) onto the RGC (brown). Inset shows 2x-magnification of region indicated by the arrow.
C: Side view of a postnatal day 21 AOFF-S RGC labeled biolistically (CMV-PSD95-YFP) in the Vsx1-cerulean retina. The cerulean signal as well as YFP were enhanced using anti- GFP (diffuse PSD95-YFP was thus enhanced for visualization of the RGC dendrites). A GluMI contacting the RGC is pseudocolored (yellow).
D: En-face view of the same confocal image stack. The contacting GluMI is pseudocolored in yellow.
E: Higher magnification of the GluMI neuritic terminal (magenta) and dendrites of the AOFF- S ganglion cell. Glutamatergic synaptic contacts between the two neurons (e.g. arrows 1–4) are identified by apposition of presynaptic (CtBP2, cyan) and postsynaptic (PSD95, yellow) puncta (high magnification of putative synapses shown in insets).
F: Number of synapses formed between a GluMI or a Type 2 BC (identified by Synaptotagmin 2 immunolabeling) with an AOFF-S RGC. Number in histograms = no. of cells. Error bars = S.E.M. Statistical comparison by Wilcoxon rank-sum test.
Amongst RGCs with dendritic arbors that stratified in the same sublamina as the arbors of GluMIs, we identified the AOFF-S RGC as a likely postsynaptic partner of GluMIs (Fig. 3C–E). Each GluMI formed an average of 3.7±1.4 synaptic contacts with a RGC with dendritic morphology and stratification characteristic of AOFF-S RGCs (n=7 cell pairs, 5 retinas; Fig. 3F). AOFF-S RGCs were also contacted by Type 2 OFF cone bipolar cells, identified by colocalization of PSD95-FP with Type 2 bipolar cell axons labeled with anti-Synaptotagmin 2 antibody (data not shown). We found that a Type 2 bipolar cell formed an average of 5.4 ± 1.4 synaptic contacts with a single AOFF-S RGC (n=16 cell pairs, 4 retinas; Fig. 3F). Type 2 bipolar cells provide about 45% of the excitatory synapses on the AOFF-S RGC [26]. Because the arbor sizes of GluMIs and Type 2 bipolar cells are comparable, we predict that if the GluMI arbors tile the retina, they would contribute about 30% of the total excitatory synapses onto the AOFF-S RGC.
The anatomical evidence that GluMIs and Type 2 bipolar cells comprise distinct pathways for excitatory synaptic input to the same RGC subtype motivated us to compare the visual response properties of GluMIs and Type 2 bipolar cells. To do this, we used whole-cell patch-clamp recordings to measure voltage responses evoked by spatially uniform, randomly flickering light stimuli (Gaussian noise; Fig. 4A–E). This stimulus allowed us to efficiently explore a variety of stimulus contrasts and temporal frequencies.
Figure 4. Distinct light responses of GluMIs and Type 2 cone bipolar cells.

A–B: Example maximum intensity z-projection images of a GluMI (A) and a Type 2 cone bipolar cell (B) filled with fluorescent dye via patch-pipette and imaged post-recording. GluMI or Type 2 bipolar-like morphology was confirmed by cell dye-fills for every recording, and in 4 of 6 cells, Type 2 bipolar identity was further corroborated with immunostaining for Synaptotagmin 2 after the recording.
C: Confirmation of Type 2 bipolar cell identity post-hoc by immunostaining for Synaptotagmin 2 (Syt2). Left, maximum intensity z-projection. Right, single confocal section; insets show 2x-magnification of region designated by arrow (top, both channels; bottom, Synaptotagmin 2 channel). Same cell as in (B). We successfully confirmed identity of type 2 bipolar cells using post-hoc Synaptotagmin 2 labeling in n=4/6 recordings. All scale bars in (A–C) are 10 μm.
D–E: Example GluMI (D, red trace) and Type 2 bipolar cell (E, blue trace) mean voltage responses to repeated noise stimulus (top, black traces; stimulus intensities drawn from Gaussian distribution with S.D. = 50% contrast, 0–60 Hz bandwidth). Horizontal dashed lines show resting membrane potentials in absence of light modulation. Gray lines show LN model predictions (see F–G). Note LN models were constructed from responses to non-repeated random noise stimuli.
F: GluMI (red) and Type 2 bipolar cell (blue) linear filters for cells shown in (D–E). Inset shows mean (line) ± SD (shading) peak normalized filters across all GluMI (n = 5) and type 2 bipolar cell (n = 6) recordings.
G: Static nonlinearities for cells in (D–E). Lines show cumulative Gaussian fits (see Suppl. Expt. Procedures) to data (circles). Same color scheme as (D–F). Note strong negative rectification of GluMI response versus more linear response of Type 2 bipolar cell (gray arrow). Shaded upper right quadrant corresponds to responses to negative contrast stimuli.
H: Summary data for GluMIs (n = 5 cells) and Type 2 bipolar cells (n = 6) measurements of linear filters (‘time to peak’, ‘biphasic index’), nonlinearities (‘rectification index’), and resting membrane potentials (see Suppl. Expt. Procedures). *p < 0.02; **p < 0.005; n.s. = not significant (p > 0.05), Wilcoxon rank-sum test. Error bars. S.E.M.
I: Mean excitatory synaptic current recorded in an example AOFF-S RGC to repeated noise stimulus. Gray line shows prediction from model with two linear filters, each with their own static nonlinearity (2D LN model; see J–K). Horizontal dashed line shows holding current in absence of light modulation.
J: Filters corresponding to largest (‘feature 1’, black) and smallest (‘feature 2’, gray) eigenvalues. Note time axis is reversed to facilitate comparison with (F). Inset shows mean ± SD peak normalized filters for the six AOFF-S RGCs in which we applied covariance analysis.
K: Static nonlinearities for feature 1 and feature 2. Lines show cumulative Gaussian function fits to data (circles). Shaded lower left quadrant corresponds to responses to negative contrasts. Gray arrow points to strongly rectified inward component measured for ‘feature 2’.
L: Eigenvalues for features (eigenmodes) identified by response-weighted covariance analysis.
M: Mean ± SD excitatory currents from three AOFF-S RGCs in response to brief (10 ms) decrement flashes (−80% contrast).
N: Same as M, but for increment flash stimuli (+80% contrast).
See also Figure S4.
We characterized responses to Gaussian noise stimuli using a linear-nonlinear (LN) cascade model, which describes the light response with a linear temporal filter (Fig. 4F) followed by a time-invariant nonlinearity (Fig. 4G) [27–29]. The linear filter provides an estimate of the response of the cell to a brief, incremental flash of light; the negative polarity of the primary lobe of filters for both GluMIs and Type 2 bipolar cells shows that both cell types hyperpolarize in response to light increments (OFF responses), as expected from their axonal stratification patterns. The more biphasic shape of GluMI filters vs. Type 2 bipolar cell filters (Fig. 4F, H; biphasic index=0.41 ± 0.04 vs. 0.22 ± 0.05, respectively; p=0.02, Wilcoxon rank-sum test) indicates that responses of GluMIs exhibit a greater preference for rapid vs. slow changes in light intensity than responses of Type 2 bipolar cells.
Response nonlinearities differed substantially for GluMIs and Type 2 bipolar cells. GluMIs exhibited a strong asymmetry in the shape of their nonlinearity, i.e. GluMIs responded more robustly to positive contrasts (strong hyperpolarization) compared to negative contrasts (weak depolarization) (Fig. 4G). We quantified this asymmetry with a rectification index that ranges from −1, which corresponds to a purely hyperpolarizing response, to +1, which corresponds to a purely depolarizing response (see Suppl. Expt. Procedures). Unlike the strongly rectified responses of GluMIs (rectification index = −0.50 ± 0.04; n=5 cells), Type 2 bipolar cell responses were near linear, i.e. equal and opposite responses to increments vs. decrements (rectification index = −0.02 ± 0.06 (n=6 cells); p=0.004 for comparison to GluMI, Wilcoxon rank-sum test) (Fig. 4G, H). Thus, although GluMIs and Type 2 bipolar cells are both OFF cells, their light responses clearly differ.
To examine whether differences in synaptic input contribute to the distinct voltage responses of GluMIs and Type 2 bipolar cells, we also made voltage-clamp measurements in a subset of recordings. To more easily separate ON vs. OFF pathway-derived synaptic inputs, we recorded responses to steps of light intensity in these experiments. Negative contrast steps revealed a likely explanation for the rectified voltage responses of GluMIs: although decrements elicited an increase in excitatory synaptic conductance in both cell types, the same stimuli reduced inhibitory conductance in Type 2 bipolar cells but increased inhibitory synaptic input onto GluMIs (Fig. S4A–E). This suggests that strong OFF pathway-driven (feed-forward) inhibition limits the extent to which GluMIs depolarize in response to negative contrasts, whereas increased excitatory input and decreased inhibitory input together drive robust depolarizing responses to OFF stimuli in Type 2 bipolar cells. Strong feed-forward inhibitory input to GluMIs may also contribute to the type-specific differences in response kinetics that we observed (Fig. 4F, H). In both cell types, strong hyperpolarizing responses to light increments were likely due to the combined effects of reduced excitatory drive and the recruitment of ON pathway-derived (cross-over) inhibitory input (Fig. S4A–E). Taken together with our EM data showing that multiple amacrine cell types provide synaptic input to GluMIs (Fig. 2) and our immunohistochemical evidence that GluMIs express a diverse complement of inhibitory receptor types (Fig. S3), these results indicate a critical role for inhibitory inputs in shaping the functional responses of GluMIs.
Given that we did not find ribbon synaptic contact onto GluMIs, and that both VGluT3 and cholinergic amacrine cells are unlikely to provide excitatory input to the GluMIs (Fig. S3 A, B), it was surprising to observe excitatory synaptic input to the GluMIs. However, consistent with the lack of ribbon contact (Fig. 2) and the little overlap with VGluT3 amacrine cell neurites (Fig. S3A), light step-evoked excitatory currents in GluMIs persisted in the presence of the ionotropic glutamate receptor antagonists NBQX and D-APV (Fig. S4F). Additionally, it is unlikely that GluMIs receive strong electrical synaptic input since we did not find evidence for tracer coupling when we dialyzed GluMIs with the gap junction-permeable molecule neurobiotin (Fig. S4G). For now, we can only conclude that GluMIs receive their (weak) excitatory input via an atypical OFF pathway.
The dissimilar light response properties of GluMIs and Type 2 bipolar cells (Fig. 4D–H) suggest that these cell types convey distinct glutamatergic signals to their postsynaptic targets. We therefore attempted to separate stimulus-driven excitatory input to AOFF-S RGCs into components that might reflect differential input from GluMIs vs. Type 2 bipolar cells. To do this, we measured excitatory synaptic currents in AOFF-S RGCs and used current-weighted covariance analysis to characterize responses to the same Gaussian noise stimuli we used to characterize GluMI and Type 2 bipolar cell responses (Fig. 4I–L) (see Suppl. Expt. Procedures). This approach is similar to the spike-triggered covariance techniques that have been extensively used to extract multiple stimulus dimensions contributing to the response properties of sensory neurons [30,31]. However, unlike most spike-triggered approaches, we used voltage-clamp recordings to isolate excitatory conductances. Hence, any response components revealed by current-weighted covariance analysis should reflect properties of the excitatory inputs to AOFF-S RGCs. Covariance analysis consistently revealed two features for which response-weighted stimulus variance was clearly different from the variance of the stimulus weighted by the mean response (‘prior stimulus’) (n=6/6 cells) (Fig. 4L). Thus, excitatory inputs to AOFF-S RGCs are best described by at least two temporal features with distinct kinetics (time to peak = 42.8 ± 0.5 ms vs. 78.4 ± 2.2 ms; biphasic index = 0.25 ± 0.04 vs. 0.66 ± 0.04 for ‘feature 1’ and ‘feature 2’) (Fig. 4J). Interestingly, the covariance analysis-derived features resembled AOFF-S RGC excitatory currents measured in response to brief increment or decrement flash stimuli (time to peak = 52.9 ± 2.7 vs. 76.5 ± 8.7 ms; biphasic index = 0.23 ± 0.09 vs. 0.72 ± 0.13; n = 3 cells) (Fig. 4M,N). These features may therefore correspond most closely to excitatory inputs driven by stimuli consisting primarily of increments vs. decrements in light intensity.
Strikingly, in each of six cells, the nonlinearity for ‘feature 2’ had an unusual shape in which the measured responses were restricted over a narrow range of inward (negative contrast stimuli) and outward (positive contrasts) currents (Fig. 4K). Rectification of the response to positive contrast stimuli (Fig. 4K, upper right quadrant) is expected from the nonlinear input-output properties of glutamatergic synapses, i.e. presynaptic hyperpolarization below the membrane potential at which vesicles are no longer released cannot continue to reduce postsynaptic currents. However, the limited response to negative contrast stimuli (Fig. 4K, shaded lower left quadrant; gray arrow) that we observed for ‘feature 2’ is what would be expected from the strongly rectified light responses of GluMIs, i.e. the consistently weak depolarizing response of GluMIs across a range of negative contrasts should produce a flat relationship between stimulus contrast and inward current in AOFF-S RGCs (see gray arrows Fig. 4G, K). Thus GluMIs may contribute preferentially to ‘feature 2’ of the excitatory input to AOFF-S RGCs. We do not, however, have direct evidence for this hypothesis, and other circuit features could equally well account for the shape of the nonlinearity for ‘feature 2’ – e.g. the synapses contributing to this feature could saturate at low stimulus contrasts. Nevertheless, when considered together with the clear differences in light response properties between GluMIs and Type 2 bipolar cells (Fig. 4D–H) and our anatomical evidence that both cell types provide synaptic input to AOFF-S RGCs (Fig. 3), the finding that excitatory input to AOFF-S RGCs consists of at least two distinct components supports the idea that GluMIs provide a source of excitation in the inner retina that is functionally distinct from conventional OFF bipolar cells.
Our results add to the growing list of unconventional interneurons in the vertebrate retina. For instance, nGnG [32] amacrine cells are neither GABAergic nor glycinergic, but unlike GluMIs, their neurotransmitter content remains unknown. Glutamatergic VGluT3 amacrine cells have also been identified [33,34], but these cells co-express inhibitory and excitatory markers, release inhibitory (glycine) or excitatory (glutamate) neurotransmitter in a postsynaptic target-specific manner [19,35], and do not appear to possess ribbons [36]. A large-field, somatostatin-expressing, amacrine cell that has ribbon synapses has been found in the cat retina [37], but these amacrine cells are not glutamatergic. GluMIs are unique from these previously described unconventional amacrine cells in that they closely resemble bipolar cells in many respects (e.g. express markers characteristic of bipolar, but not amacrine cells), but they do not extend a dendrite to contact photoreceptors in the outer retina. Additionally, single cell gene profiling suggests that a monopolar interneuron in the mouse retina resembling GluMI expresses molecular signatures found in bipolar cells (J. R. Sanes, personal communication). Of the ‘amacrine’ cell types in the recent electron microscopy reconstruction of mouse inner plexiform layer [38], GluMIs most closely resemble the Type 14 cell (AC17–30) in arbor morphology and cell body location in the INL. However, our results suggest that GluMIs are not likely to contact OFF starburst amacrine cells (Fig. S3B), contrary to the predictions for AC Type 14. Our current findings together with the gene profiling work of Sanes and colleagues, thus underscore the need to integrate molecular, morphological and physiological information in classifying neurons.
Supplementary Material
Highlights.
GluMIs provide a novel route of light-driven excitation to retinal ganglion cells.
GluMIs are monopolar cells but express synaptic features of bipolar cells.
GluMIs have light response properties that differ from Type 2 bipolar cells.
GluMIs and bipolar cells may provide functionally distinct input to ganglion cells.
Acknowledgments
This work was supported by the National Institute of Health (EY017101 to R.O.L.W., EY11850 to F.R. and the vision core grant EY01730) and the Howard Hughes Medical Institute (F.R.).
Medical Scientist Training Program supported K.T. provided by Government Subsidies for Management Expense of the University of Tokyo.
We thank J.M. Fritschy for kindly providing GABAA antibodies and R. Enz and H. Wässle for kindly providing GABAC antibody.
Footnotes
Author contributions:
LDS, SPK, TY, HO, MH, KT: Performed experiments and analyzed the results. SS, HO: Created the Vsx1-cerulean mouse line. LDS, HO, SPK, TY, FR, ROLW: Designed the experiments. LDS, SPK, TY, ROLW: Wrote the manuscript.
Publisher's Disclaimer: This is a PDF file of an unedited manuscript that has been accepted for publication. As a service to our customers we are providing this early version of the manuscript. The manuscript will undergo copyediting, typesetting, and review of the resulting proof before it is published in its final citable form. Please note that during the production process errors may be discovered which could affect the content, and all legal disclaimers that apply to the journal pertain.
References
- 1.Harris KM, Weinberg RJ. Ultrastructure of synapses in the mammalian brain. Cold Spring Harb Perspect Biol. 2012;4:a005587–a005587. doi: 10.1101/cshperspect.a005587. [DOI] [PMC free article] [PubMed] [Google Scholar]
- 2.Masland RH. The neuronal organization of the retina. Neuron. 2012;76:266–280. doi: 10.1016/j.neuron.2012.10.002. [DOI] [PMC free article] [PubMed] [Google Scholar]
- 3.Euler T, Haverkamp S, Schubert T, Baden T. Retinal bipolar cells: elementary building blocks of vision. Nat Rev Neurosci. 2014;15:507–519. doi: 10.1038/nrn3783. [DOI] [PubMed] [Google Scholar]
- 4.Kerschensteiner D, Morgan JL, Parker ED, Lewis RM, Wong ROL. Neurotransmission selectively regulates synapse formation in parallel circuits in vivo. Nature. 2009;460:1016–1020. doi: 10.1038/nature08236. [DOI] [PMC free article] [PubMed] [Google Scholar]
- 5.Chow RL, Volgyi B, Szilard RK, Ng D, McKerlie C, Bloomfield SA, Birch DG, McInnes RR. Control of late off-center cone bipolar cell differentiation and visual signaling by the homeobox gene Vsx1. Proc Natl Acad Sci USa. 2004;101:1754–1759. doi: 10.1073/pnas.0306520101. [DOI] [PMC free article] [PubMed] [Google Scholar]
- 6.Ohtoshi A, Wang SW, Maeda H, Saszik SM, Frishman LJ, Klein WH, Behringer RR. Regulation of retinal cone bipolar cell differentiation and photopic vision by the CVC homeobox gene Vsx1. Curr Biol. 2004;14:530–536. doi: 10.1016/j.cub.2004.02.027. [DOI] [PubMed] [Google Scholar]
- 7.Hoon M, Sinha R, Okawa H, Suzuki SC, Hirano AA, Brecha N, Rieke F, Wong ROL. Neurotransmission plays contrasting roles in the maturation of inhibitory synapses on axons and dendrites of retinal bipolar cells. Proc Natl Acad Sci USa. 2015;112:12840–12845. doi: 10.1073/pnas.1510483112. [DOI] [PMC free article] [PubMed] [Google Scholar]
- 8.Ghosh KK, Bujan S, Haverkamp S, Feigenspan A, Wässle H. Types of bipolar cells in the mouse retina. J Comp Neurol. 2004;469:70–82. doi: 10.1002/cne.10985. [DOI] [PubMed] [Google Scholar]
- 9.MacNeil MA, Heussy JK, Dacheux RF, Raviola E, Masland RH. The shapes and numbers of amacrine cells: matching of photofilled with Golgi-stained cells in the rabbit retina and comparison with other mammalian species. J Comp Neurol. 1999;413:305–326. [PubMed] [Google Scholar]
- 10.Pang JJ, Gao F, Wu SM. Physiological characterization and functional heterogeneity of narrow-field mammalian amacrine cells. J Physiol (Lond) 2012;590:223–234. doi: 10.1113/jphysiol.2011.222141. [DOI] [PMC free article] [PubMed] [Google Scholar]
- 11.Barnstable CJ, Hofstein R, Akagawa K. A marker of early amacrine cell development in rat retina. Brain Res. 1985;352:286–290. doi: 10.1016/0165-3806(85)90116-6. [DOI] [PubMed] [Google Scholar]
- 12.Wässle H, Puller C, Müller F, Haverkamp S. Cone contacts, mosaics, and territories of bipolar cells in the mouse retina. J Neurosci. 2009;29:106–117. doi: 10.1523/JNEUROSCI.4442-08.2009. [DOI] [PMC free article] [PubMed] [Google Scholar]
- 13.Rieke F, Lee A, Haeseleer F. Characterization of Ca2+-binding protein 5 knockout mouse retina. Invest Ophthalmol Vis Sci. 2008;49:5126–5135. doi: 10.1167/iovs.08-2236. [DOI] [PMC free article] [PubMed] [Google Scholar]
- 14.Voinescu PE, Emanuela P, Kay JN, Sanes JR. Birthdays of retinal amacrine cell subtypes are systematically related to their molecular identity and soma position. J Comp Neurol. 2009;517:737–750. doi: 10.1002/cne.22200. [DOI] [PMC free article] [PubMed] [Google Scholar]
- 15.Godinho L, Mumm JS, Williams PR, Schroeter EH, Koerber A, Park SW, Leach SD, Wong ROL. Targeting of amacrine cell neurites to appropriate synaptic laminae in the developing zebrafish retina. Development. 2005;132:5069–5079. doi: 10.1242/dev.02075. [DOI] [PubMed] [Google Scholar]
- 16.Morgan JL, Dhingra A, Vardi N, Wong ROL. Axons and dendrites originate from neuroepithelial-like processes of retinal bipolar cells. Nat Neurosci. 2006;9:85–92. doi: 10.1038/nn1615. [DOI] [PubMed] [Google Scholar]
- 17.Bishop D, Nikić I, Brinkoetter M, Knecht S, Potz S, Kerschensteiner M, Misgeld T. Near-infrared branding efficiently correlates light and electron microscopy. Nat Methods. 2011;8:568–570. doi: 10.1038/nmeth.1622. [DOI] [PubMed] [Google Scholar]
- 18.Kim T, Soto F, Kerschensteiner D. An excitatory amacrine cell detects object motion and provides feature-selective input to ganglion cells in the mouse retina. Elife. 2015;4:6807. doi: 10.7554/eLife.08025. [DOI] [PMC free article] [PubMed] [Google Scholar]
- 19.Lee S, Zhang Y, Chen M, Zhou ZJ. Segregated Glycine-Glutamate Co-transmission from vGluT3 Amacrine Cells to Contrast-Suppressed and Contrast-Enhanced Retinal Circuits. Neuron. 2016;90:27–34. doi: 10.1016/j.neuron.2016.02.023. [DOI] [PMC free article] [PubMed] [Google Scholar]
- 20.Krishnaswamy A, Yamagata M, Duan X, Hong YK, Sanes JR. Sidekick 2 directs formation of a retinal circuit that detects differential motion. Nature. 2015;524:466–470. doi: 10.1038/nature14682. [DOI] [PMC free article] [PubMed] [Google Scholar]
- 21.Kolb H. Amacrine cells of the mammalian retina: neurocircuitry and functional roles. Eye (Lond) 1997;11( Pt 6):904–923. doi: 10.1038/eye.1997.230. [DOI] [PubMed] [Google Scholar]
- 22.Wässle H, Koulen P, Brandstätter JH, Fletcher EL, Becker CM. Glycine and GABA receptors in the mammalian retina. Vision Res. 1998;38:1411–1430. doi: 10.1016/s0042-6989(97)00300-3. [DOI] [PubMed] [Google Scholar]
- 23.Eggers ED, Lukasiewicz PD. Multiple pathways of inhibition shape bipolar cell responses in the retina. Vis Neurosci. 2011;28:95–108. doi: 10.1017/S0952523810000209. [DOI] [PMC free article] [PubMed] [Google Scholar]
- 24.Morgan JL, Soto F, Wong ROL, Kerschensteiner D. Development of cell type-specific connectivity patterns of converging excitatory axons in the retina. Neuron. 2011;71:1014–1021. doi: 10.1016/j.neuron.2011.08.025. [DOI] [PMC free article] [PubMed] [Google Scholar]
- 25.Morgan JL, Schubert T, Wong ROL. Developmental patterning of glutamatergic synapses onto retinal ganglion cells. Neural Dev. 2008;3:8. doi: 10.1186/1749-8104-3-8. [DOI] [PMC free article] [PubMed] [Google Scholar]
- 26.Neumann S, Hüser L, Ondreka K, Auler N, Haverkamp S. Cell type-specific bipolar cell input to ganglion cells in the mouse retina. Neuroscience. 2016;316:420–432. doi: 10.1016/j.neuroscience.2015.12.051. [DOI] [PubMed] [Google Scholar]
- 27.Chichilnisky EJ. A simple white noise analysis of neuronal light responses. Network. 2001;12:199–213. [PubMed] [Google Scholar]
- 28.Kim KJ, Rieke F. Temporal contrast adaptation in the input and output signals of salamander retinal ganglion cells. J Neurosci. 2001;21:287–299. doi: 10.1523/JNEUROSCI.21-01-00287.2001. [DOI] [PMC free article] [PubMed] [Google Scholar]
- 29.Rieke F. Temporal contrast adaptation in salamander bipolar cells. J Neurosci. 2001;21:9445–9454. doi: 10.1523/JNEUROSCI.21-23-09445.2001. [DOI] [PMC free article] [PubMed] [Google Scholar]
- 30.Fairhall AL, Burlingame CA, Narasimhan R, Harris RA, Puchalla JL, Berry MJ. Selectivity for multiple stimulus features in retinal ganglion cells. J Neurophysiol. 2006;96:2724–2738. doi: 10.1152/jn.00995.2005. [DOI] [PubMed] [Google Scholar]
- 31.Schwartz O, Pillow JW, Rust NC, Simoncelli EP. Spike-triggered neural characterization. J Vis. 2006;6:484–507. doi: 10.1167/6.4.13. [DOI] [PubMed] [Google Scholar]
- 32.Kay JN, Voinescu PE, Chu MW, Sanes JR. Neurod6 expression defines new retinal amacrine cell subtypes and regulates their fate. Nat Neurosci. 2011;14:965–972. doi: 10.1038/nn.2859. [DOI] [PMC free article] [PubMed] [Google Scholar]
- 33.Lee S, Chen L, Chen M, Ye M, Seal RP, Zhou ZJ. An Unconventional Glutamatergic Circuit in the Retina Formed by vGluT3 Amacrine Cells. Neuron. 2014;84:708–715. doi: 10.1016/j.neuron.2014.10.021. [DOI] [PMC free article] [PubMed] [Google Scholar]
- 34.Grimes WN, Seal RP, Oesch N, Edwards RH, Diamond JS. Genetic targeting and physiological features of VGLUT3+ amacrine cells. Vis Neurosci. 2011;28:381–392. doi: 10.1017/S0952523811000290. [DOI] [PMC free article] [PubMed] [Google Scholar]
- 35.Tien NW, Kim T, Kerschensteiner D. Target-specific glycinergic transmission from VGluT3-expressing amacrine cells shapes suppressive contrast responses in the retina. Cell Rep. 2016;15:1369–1375. doi: 10.1016/j.celrep.2016.04.025. [DOI] [PMC free article] [PubMed] [Google Scholar]
- 36.Johnson J, Sherry DM, Liu X, Fremeau RT, Seal RP, Edwards RH, Copenhagen DR. Vesicular glutamate transporter 3 expression identifies glutamatergic amacrine cells in the rodent retina. J Comp Neurol. 2004;477:386–398. doi: 10.1002/cne.20250. [DOI] [PMC free article] [PubMed] [Google Scholar]
- 37.Chun MH, Brecha N, Wässle H. Light- and electron-microscopic studies of the somatostatin-immunoreactive plexus in the cat retina. Cell Tissue Res. 1992;267:57–66. doi: 10.1007/BF00318691. [DOI] [PubMed] [Google Scholar]
- 38.Helmstaedter M, Briggman KL, Turaga SC, Jain V, Seung HS, Denk W. Connectomic reconstruction of the inner plexiform layer in the mouse retina. 2013;500:168–174. doi: 10.1038/nature12346. [DOI] [PubMed] [Google Scholar]
Associated Data
This section collects any data citations, data availability statements, or supplementary materials included in this article.