

Abstract
Alzheimer’s disease (AD) is the leading cause of dementia and mitigating amyloid-β (Aβ) levels may serve as a rational therapeutic avenue to slow AD progression. Pharmacologic inhibition of the Rho-associated protein kinases (ROCK1 and ROCK2) is proposed to curb Aβ levels, and mechanisms that underlie ROCK2’s effects on Aβ production are defined. How ROCK1 affects Aβ generation remains a critical barrier. Here, we report that ROCK1 protein levels were elevated in mild cognitive impairment due to AD (MCI) and AD brains compared to controls. Aβ42 oligomers marginally increased ROCK1 and ROCK2 protein levels in neurons but strongly induced phosphorylation of Lim kinase 1 (LIMK1), suggesting that Aβ42 activates ROCKs. RNAi depletion of ROCK1 or ROCK2 suppressed endogenous Aβ40 production in neurons, and Aβ40 levels were reduced in brains of ROCK1 heterozygous knock-out mice compared to wild-type littermate controls. ROCK1 knockdown decreased amyloid precursor protein (APP), and treatment with bafilomycin accumulated APP levels in neurons depleted of ROCK1. These observations suggest that reduction of ROCK1 diminishes Aβ levels by enhancing APP protein degradation. Collectively, these findings support the hypothesis that both ROCK1 and ROCK2 are therapeutic targets to combat Aβ production in AD.
Keywords: Alzheimer’s disease, mild cognitive impairment, amyloid-β, Rho kinase, ROCK1, ROCK2
Summary for Schematic
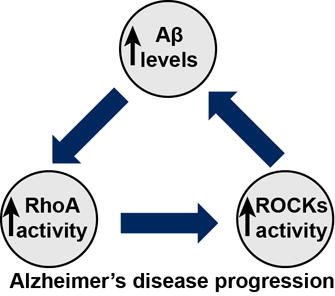
Mitigating amyloid-β (Aβ) levels is a rational strategy for Alzheimer’s disease (AD) treatment, however therapeutic targets with clinically available drugs are lacking. We hypothesize that Aβ accumulation in mild cognitive impairment due to AD (MCI) and AD activates the RhoA/ROCK pathway which in turn fuels production of Aβ. Escalation of this cycle over the course of many years may contribute to the buildup of amyloid pathology in MCI and/or AD.
Introduction
There is strong genetic, biochemical, and cell biological evidence to support the hypothesis that accumulation of amyloid-β (Aβ) is a driving factor in the development of AD (Hardy & Selkoe 2002). Proteolytic processing of the amyloid precursor protein (APP) yields Aβ, and although Aβ cannot account for all features of AD, mitigating its production and accumulation is a key therapeutic strategy. Rho-associated coiled-coil containing protein kinases (ROCK) 1 and ROCK2 are ubiquitous serine/threonine kinases that share 65% similarity in their amino acid sequences and 92% identity in their kinase domains (Nakagawa et al. 1996). Targeting ROCKs to combat Aβ production stems from studies suggesting that nonsteroidal anti-inflammatory drugs (NSAIDs) reduce Aβ levels in animal and cellular models of AD by suppressing activity of ROCKs (Zhou et al. 2003). Subsequent results indicated that statins mitigate APP processing to Aβ via ROCKs (Pedrini et al. 2005). Together, these findings supported the hypothesis that pharmacologic inhibition of ROCKs might serve as a rational avenue to curb Aβ production. However, this promising hypothesis languished for years due to the limited understanding of which ROCK isoform was responsible for these effects. Recent work demonstrated that pharmacologic inhibition of ROCK2 suppresses Aβ production in cellular and animal models of AD (Herskowitz et al. 2013). However, whether ROCK1 influences Aβ production in neurons was not addressed. Here, observations from MCI and AD brains were linked to in vitro and in vivo models to provide evidence that ROCK1 is a rational therapeutic target to curb Aβ levels in AD.
Methods
Antibodies
ROCK1 Abcam ab45171; Actin Abcam ab6276; ROCK2 Abcam ab56661; LIMK1 Cell Signaling 3842; phospho-LIMK1 (Thr508)/LIMK2 (Thr505) Cell Signaling 3841; MUNC18 Abcam ab3451; APP (22C11) Millipore MAB348.
Tissue and cell lysate preparation and immunoblotting
Postmortem human brain tissue samples were provided by the University of Washington Alzheimer’s Disease Research Center (ADRC) and its Adult Changes in Thought Study and the Johns Hopkins ADRC and the Baltimore Longitudinal Study of Aging (Table 1). The soluble (S2) fraction was prepared from each case as previously described (Donovan et al. 2012). Mouse tissue and cells were lysed in PBS plus protease inhibitor cocktail (PIC; Roche Diagnostics), Halt phosphatase inhibitor cocktail (Pierce), and lysis buffer containing 0.5% Nonidet P-40, 0.5% deoxycholate, 150 mM sodium chloride, and 50 mM Tris, pH 7.4. Tissue was homogenized (dounce homogenizer) in the PIC Halt lysis buffer. All lysates were subjected to a 13,000-rpm spin to remove nuclei and debris. Protein concentration was determined by bicinchoninic acid method (Pierce). Immunoblots were performed using standard procedures as described previously (Herskowitz et al. 2011). 50 μg protein per sample was used per lane. Actin or MUNC18 was used as a loading control. Images were captured using an Odyssey Image Station (LiCor), and band intensities were quantified using Odyssey Application Software Version 3.0 (LiCor).
Table 1.
Postmortem human brain tissue samples.
Case numbers correspond to immunoblot samples in Fig. 1. Samples were collected from prospectively studied participants in the Baltimore Longitudinal Study of Aging at the Johns Hopkins' Alzheimer’s Disease Research Center (ADRC) as well as from the University of Washington ADRC and its Adult Changes in Thought study. The case diagnosis is based on Mini Mental State Examination, Cognitive Abilities Screening Instrument (CASI) score, Consortium to Establish a Registry for Alzheimer’s disease (CERAD) score and BRAAK Staging. Cases were sanctioned into diagnostic groups which included i) cognitively normal controls without AD pathology ii) cognitively normal asymptomatic AD with moderate to severe pathology iii) MCI with moderate to severe pathology and iv) definite AD with severe pathology. If values are blank, information was not available. Notably, cases had no co-existing pathologies, such as stroke or Lewy body disease.
| Control (N=1) | |||||||
| Case | CASI | CERAD | BRAAK | Age | Gender | PMI | |
| 1 | 0 | 2 | 79 | F | |||
| 2 | 0 | 2 | 92 | F | |||
| 3 | 95 | 0 | 1 | 98 | F | ||
| 4 | 96 | 0 | 2 | 86 | M | ||
| 5 | 88 | 0 | 2 | 92 | F | ||
| 6 | 89 | 0 | 2 | 87 | M | ||
| 7 | A | 2 | 71 | F | 16 | ||
| 8 | 0 | 4 | 86 | M | 7 | ||
| 9 | 0 | 3 | 95 | M | 17 | ||
| 10 | 99 | 0 | 0 | 78 | M | ||
| 11 | 97 | 0 | 2 | 87 | F | ||
| MCI (N=9) | |||||||
| Case | CASI | CERAD | BRAAK | Age | Gender | PMI | |
| 1 | 0 | 2 | 68 | M | 10 | ||
| 2 | B | 3 | 87 | M | 20 | ||
| 3 | A | 3 | 90 | M | 14 | ||
| 4 | A | 4 | 89 | M | 16 | ||
| 5 | A | 2 | 90 | M | 14 | ||
| 6 | A | 3 | 88 | F | 14 | ||
| 7 | B | 4 | 82 | M | 5.5 | ||
| 8 | B | 4 | 78 | M | 4 | ||
| 9 | B | 4 | 101 | F | 25 | ||
| AD (N=16) | |||||||
| Case | CASI | CERAD | BRAAK | Age | Gender | PMI | |
| 1 | C | 4 | 98 | M | 20 | ||
| 2 | C | 4 | 92 | M | 7 | ||
| 3 | C | 6 | 86 | M | 15 | ||
| 4 | C | 6 | 82 | F | 6 | ||
| 5 | C | 6 | 72 | F | 10 | ||
| 6 | C | 6 | 92 | F | 19 | ||
| 7 | C | 6 | 82 | M | 23 | ||
| 8 | C | 6 | 83 | F | 11 | ||
| 9 | C | 6 | 94 | F | 17.5 | ||
| 10 | C | 6 | 91 | F | 18 | ||
| 11 | 43 | 2 | 6 | 83 | M | ||
| 12 | 78 | 3 | 6 | 89 | F | ||
| 13 | 69 | 3 | 6 | 80 | F | ||
| 14 | 41 | 3 | 5 | 92 | F | ||
| 15 | 70 | 3 | 6 | 78 | F | ||
| 16 | 83 | 3 | 6 | 85 | F | ||
| Asymptomatic AD (N=5) | |||||||
| Case | CASI | CERAD | BRAAK | Age | Gender | PMI | |
| 1 | 98 | 2 | 3 | 86 | M | ||
| 2 | 97 | 2 | 3 | 92 | F | ||
| 3 | 97 | 2 | 3 | 79 | M | ||
| 4 | 91 | 2 | 3 | 75 | F | ||
| 5 | 96 | 2 | 4 | 77 | F | ||
MCI, mild cognitive impairment due to Alzheimer’s disease; AD, Alzheimer’s disease; PMI, postmortem interval in hours; F, female; M, male.
Cell culture, transduction, and treatments
Primary cortical neurons and HEK293 cells were cultured as previously described (Herskowitz et al. 2013). 72 h post-plating, neurons were transduced with indicated lentivirus with a multiplicity of infection of 1. MG132 (carbobenzoxy-Lleucyl-L-leucyl-L-leucinal) (Sigma #C2211) or bafilomycin (Sigma #B1793) was dissolved in 100% dimethyl sulfoxide (DMSO) and used at 10 μM or 100 nM, respectively. Mock was equivalent concentration of DMSO. Aβ42 oligomers (Bachem H-1368.1000) were prepared according to published protocols (Frandemiche et al. 2014). At 14 days in vitro (DIV) primary cortical cultures were treated with 250nM Aβ42 oligomers for 6 h. Lentivirus was generated by the Emory University Viral Vector Core. Lentivirus vectors for shRNA expression were constructed as previously described (Herskowitz et al. 2012). Rodent ROCK2 shRNA sequences are previously described (Herskowitz et al. 2013). Rodent Scramble shRNA sequence: CTACTCTAGACGTATATTCAA. Rodent ROCK1 shRNA sequence: TGAAAGCAGAAGATTATTCAA.
Aβ measurements
For culture experiments, media were conditioned for 16 h, and then collected for biochemical analyses. Aβ40 was detected using ELISA (Life Technologies KMB3481) following the manufacturer’s instructions. Plates were read at 450 nm on a Spectra Max Plus plate reader (Molecular Devices).
ROCK1+/− mice
Generation of ROCK1+/− mice are described as follows: C57BL/6N-Rock1<tm1b(NCOM)Mfgc>/Tcp were made as part of the NorCOMM2 project with C57BL/6N-Rock1<tm1a(NCOM)Mfgc>/Tcp mice made from NorCOMM ES cells (Bradley et al. 2012) at the Toronto Centre for Phenogenomics. Mice were obtained from the Canadian Mouse Mutant Repository. For each genotype two males and one female were used. All experiments were conducted in compliance with the ARRIVE guidelines and under a protocol approved by the Institutional Animal Care and Use Committee at the University of Alabama at Birmingham.
HEK293 cell counting
HEK293 cells were transduced with indicated lentivirus, and 96 h later cells were plated at equivalent densities per well. 24 h later, cells were collected for immunoblot analysis or stained with 4’,6-diamidino-2-phenylindole (DAPI). Cells were counted using the Countess II Automated Cell Counter (ThermoFisher) according to manufacturer’s instructions.
qRT-PCR
RNA was prepared with Trizol (Life Technologies 15596-026) following manufacturer’s instructions. cDNA was generated with the SuperScript III First Strand Synthesis System (Life Technologies 18080-051). cDNA was quantified using LightCycler 480 Probes mastermix (Roche) and TaqMan Gene Expression Assays for rodent APP (Rn01524846_m1) and GAPDH (Hs02758991_g1). Amplification was performed on a Roche LightCycler 480. Data was quantified using the ΔΔCt method (User Bulletin 2, Applied Biosystems).
Statistical analysis
Statistical analysis was performed using Student’s t test for independent samples. Unless otherwise noted, all data are expressed as the percentage of the mean SEM with respect to the control. Error bars represent SEM. Prism software (GraphPad Software) was used for all graphs.
Results
ROCK1 is increased in MCI and AD brains
Previous studies indicated that ROCK2 protein level was increased in asymptomatic AD, mild cognitive impairment due to AD (MCI), and AD brains compared to controls (Herskowitz et al. 2013). To assess whether ROCK1 protein level is changing in AD, Brodmann area 46 prefrontal cortex tissue homogenates were prepared from 16 AD and 11 age-matched pathology-free control cases (Table 1). Homogenates were subjected to SDS-PAGE and subsequent immunoblot (Fig. 1a-c). Densitometry analysis indicated that ROCK1 levels were elevated ~57% in AD brains compared to controls (Fig. 1d). To determine if changes in ROCK1 occur early in disease progression, 9 MCI and 5 asymptomatic AD brains were analyzed. Asymptomatic AD is hypothesized to represent early disease stages between the first appearance of AD neuropathology and the onset of clinical symptoms (Sperling et al. 2011, Driscoll & Troncoso 2011), and MCI is a prodromal phase of AD. Densitometry analysis indicated that ROCK1 levels were elevated ~56% and ~54% in MCI and asymptomatic AD brains, respectively, compared to controls (Fig. 1d). These results suggest that ROCK1 levels are increased in the early stages of AD and remain elevated throughout disease progression.
Fig. 1.
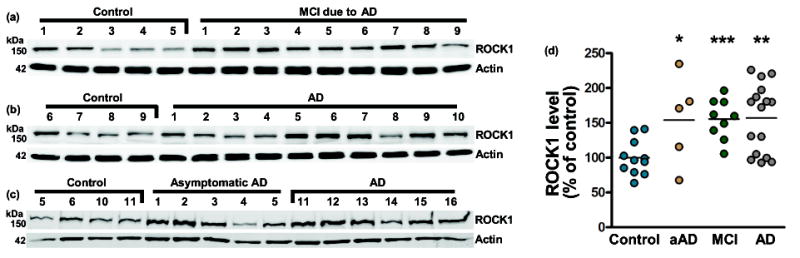
Increased ROCK1 protein level in human AD brains. (a, b, and c) Immunoblots were performed using homogenates from control, asymptomatic AD (aAD), MCI due to AD, or AD brains. Case numbers correspond to information in Table 1. (c) Densitometry analysis indicated that ROCK1 is elevated in aAD, MCI, and AD, respectively, compared to controls. *p=0.0261, ***p=0.0002, **p=0.0016. Each case is expressed as an individual data point, and lines represent the mean.
Aβ42 oligomers increase phosphorylation of LIMK
Past work suggested that ROCK2 protein level may be influenced by Aβ oligomers (Pozueta et al. 2013). Based on this and our observations that ROCK1 and ROCK2 are elevated in MCI and AD brains (Fig. 1) (Herskowitz et al. 2013), we hypothesized that Aβ oligomers increase ROCK1 and ROCK2 protein level in neurons. To test this, primary cortical neurons were incubated in the presence or absence of Aβ42 oligomers for 6 h, and then harvested for immunoblot analysis (Fig. 2a). Densitometry measurements showed higher, but not significantly increased, ROCK1 and ROCK2 protein levels in neurons treated with Aβ42 oligomers (Fig. 2b). Next, we sought to determine whether Aβ42 oligomers alter activity of ROCKs. Phosphorylation of LIM kinase-1 threonine 508 (pLIMK1), a ROCK1 or ROCK2 substrate (Ohashi et al. 2000), was increased significantly ~59% in neurons exposed to Aβ42 oligomers (Fig. 2c). These findings suggest that Aβ42 oligomers can increase activity of ROCKs in neurons.
Fig. 2.
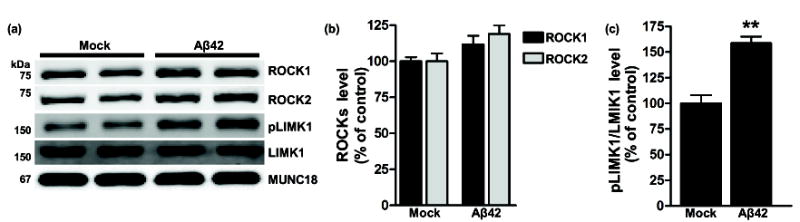
Aβ42 oligomers increase pLIMK1. (a) Representative immunoblots of neurons incubated in the presence or absence of Aβ42. (b) Densitometry analysis revealed that ROCK1 (p=0.15) and ROCK2 (p=0.0769) were marginally increased, while (c) pLIMK1 was increased significantly (**p=0.0048) in Aβ42-treated cultures. N=4 replicates per condition. All data are expressed as the percentage of the control mean ± SEM.
ROCK1 depletion reduces Aβ levels
To determine how selective depletion of ROCK1 influences Aβ generation in neurons, primary cortical cultures were transduced with lentivirus expressing ROCK1-targeted or scramble shRNA. Ninety-six hours later, levels of endogenous full-length cell-associated APP, secreted α-secretase cleaved APP (sAPPα), and Aβ40 levels were measured by immunoblot or ELISA (β-secretase cleaved APP and Aβ42 were below the limit of detection). Secreted Aβ40 levels were reduced ~56% and densitometry analysis indicated that APP and sAPPα were decreased ~37% and ~42%, respectively, from ROCK1 knockdown neurons compared to scramble controls (Fig. 3a and b). To assess ROCK1’s influence on Aβ generation in vivo, frontal cortex homogenates from adult ROCK1 heterozygous-null (ROCK1+/−) and wild-type littermate control (ROCK1+/+) mice were subjected to immunoblot or ELISA analysis. Endogenous Aβ40 levels were reduced ~26% in ROCK1+/− mice compared to ROCK1+/+ littermates (Fig. 3c). These findings are consistent with ROCK1 knockdown experiments in neurons but conflict with previous work demonstrating that ROCK1 depletion increases endogenous Aβ40 production in HEK293 cell lines (Herskowitz et al. 2013).
Fig. 3.
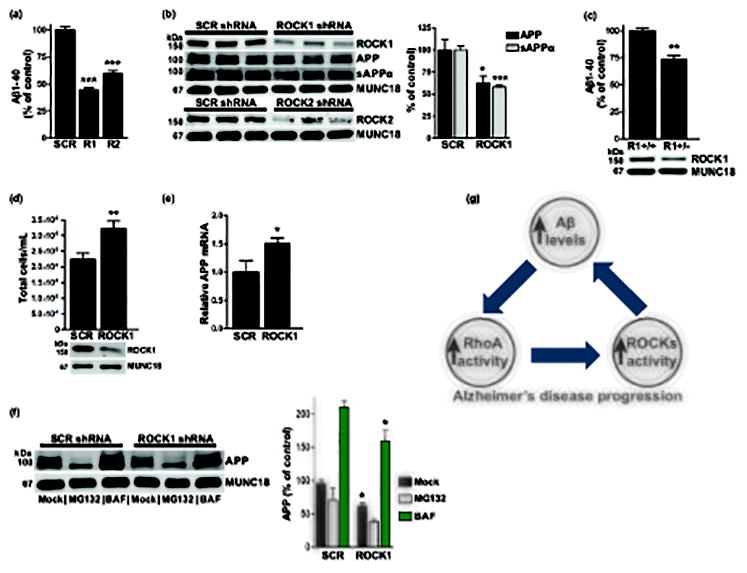
ROCK1 depletion reduces Aβ levels. (b – d, f) Representative immunoblots shown. (a) ROCK1 shRNA (R1) or ROCK2 shRNA (R2) reduced Aβ40 (***p<0.0001) compared to scramble (SCR) controls. N=4 replicates per condition. (b) Densitometry analysis revealed that APP (*p=0.0246) and sAPPα (***p=0.0008) were reduced in ROCK1-depleted neurons. N=5 replicates per condition. (c) Aβ40 was reduced (**p=0.0037) in ROCK1+/− mice (R1+/−) compared to ROCK1+/+ littermates (R1+/+). N=3 replicates per condition. (d) Cell numbers were increased (**p=0.0085) in ROCK1-depleted wells compared to SCR. N=7 replicates per condition. (e) ROCK1 knockdown increased relative APP mRNA level (*p=0.0475). N=6 replicates per condition. (f) APP is reduced in ROCK1-depleted neurons (*p=0.0158), and APP accumulates in bafilomycin (BAF) treated neurons (*p=0.0282). N=3 replicates per condition. (g) Proposed model of the interrelationship between Aβ and RhoA/ROCK activity in AD progression. All data are expressed as the percentage of the control mean ± SEM.
We hypothesized that the opposing outcomes of ROCK1 knockdown on Aβ levels in postmitotic neurons and human cell lines may be accounted for by differences in cellular proliferation. To test this, HEK293 cells were transduced with lentivirus expressing ROCK1-targeted or scramble shRNA, and 96 h later cells were harvested for immunoblots and cell counting. Analysis by the Countess II Automated Cell Counter revealed that cell number was increased significantly ~44% in wells depleted of ROCK1 (Fig. 3d), suggesting that ROCK1 knockdown enhanced cellular proliferation. This likely contributed to the increase in Aβ production that was observed following ROCK1 knockdown in HEK293 cells (Herskowitz et al. 2013).
Additionally, we sought to determine how selective depletion of ROCK2 influences Aβ generation in neurons. To test this, primary cortical cultures were transduced with lentivirus expressing ROCK2-targeted or scramble shRNA, and 96 h later, levels of endogenous Aβ40 were measured by ELISA. Secreted Aβ40 levels were reduced ~42% from ROCK2-depleted neurons compared to scramble controls (Fig. 3a and b). This supports past findings that show pharmacologic inhibition of ROCK2 diminishes Aβ production in human cells and neurons (Herskowitz et al. 2013).
RNAi depletion of ROCK1 suppressed Aβ generation (Fig. 3a). This was likely due to the reduction in APP level that was observed following ROCK1 knockdown (Fig. 3b). To determine whether the decrease in APP following ROCK1 depletion occurred at the RNA or protein level, quantitative PCR analysis was performed. Primary cortical cultures were transduced with lentivirus expressing ROCK1-targeted or scramble shRNA, and 96 h later cells were harvested for RNA. APP mRNA levels were increased in ROCK1-depleted neurons, indicating that the reduction in APP protein level was not due to decreased APP mRNA (Fig. 3e). To determine if ROCK1 depletion in neurons reduces APP protein level by enhancing APP protein degradation, ROCK1-targeted or scramble shRNA-expressing neurons were treated for 24 hours with MG132, a proteasome inhibitor, or 6 hours with Bafilomycin, an endosomal acidification inhibitor that blocks autophagosome formation (Yamamoto et al. 1998). APP protein levels were measured by immunoblot. MG132 treatment reduced APP level, whereas APP accumulated significantly in bafilomycin-treated cultures (Fig. 3f). Based on these findings, we hypothesize that reduction of ROCK1 diminishes Aβ levels by enhancing lysosomal degradation of APP.
Discussion
Mitigating Aβ levels is a rational strategy for AD treatment, however therapeutic targets with clinically available drugs are lacking. Our current findings indicate that ROCK1 is elevated in MCI and AD brains and that genetic depletion of ROCK1 reduces Aβ production. Based on this and past work (Herskowitz et al. 2013), we propose that both ROCK1 and ROCK2 are rational therapeutic targets to combat Aβ production in AD.
Whether elevated ROCK1 levels contribute to early pathogenic mechanisms of AD or affect transition from MCI to AD are important questions. It will be critical to determine whether increased ROCK1 is driven by specific cell populations, such as reactive gliosis, or a direct effect of inefficient protein degradation, enhanced gene transcription, or a combination of these mechanisms in neurons. Our results indicate that both ROCK1 and ROCK2 are elevated marginally in neurons exposed to Aβ42 (Fig. 2b), which support previous findings that show Aβ oligomers may increase ROCK2 protein level (Pozueta et al. 2013). ROCK1 and ROCK2 are principle downstream effectors of RhoA, a Rho GTPase family member (Woo & Gomez 2006, Zhang et al. 2003). Aβ oligomers activate RhoA, and it is likely that Aβ activates ROCKs via RhoA interaction with N-methyl-D-aspartate receptors (Petratos et al. 2008, Pozueta et al. 2013, Lacor et al. 2007). Results herein strongly support this hypothesis by demonstrating that pLIMK1, a direct substrate of ROCKs (Ohashi et al. 2000), was substantially increased in neurons following exposure to Aβ42 oligomers (Fig. 2c). Notably, pLIMK1 levels are increased in AD brains (Heredia et al. 2006). There is an accordant relationship between RhoA activity and Aβ generation (Zhou et al. 2003). Based on these findings, we hypothesize that Aβ accumulation in MCI and AD activates the RhoA/ROCK pathway which in turn fuels production of Aβ. Escalation of this cycle over the course of many years may contribute to the buildup of amyloid pathology in MCI and/or AD (Fig. 3g).
Pharmacologic inhibition of ROCKs can induce protein degradation pathways, including autophagy, in mammalian cells, primary neurons, and drosophila (Bauer et al. 2009, Koch et al. 2014, Gentry et al. 2016). Recent studies indicate that RNAi depletion of ROCK1 or ROCK2 in human neuroblastoma cells reduces endogenous tau by stimulating autophagy (Gentry et al. 2016). Based on this and the findings herein, we hypothesize that ROCK1 mediates Aβ production by influencing autophagic pathways that regulate APP degradation in lysosomes. Notably, APP mRNA levels were increased in ROCK1-depleted neurons (Fig. 3e). This may reflect intracellular compensatory mechanisms that were induced by the reduction in APP protein level following ROCK1 knockdown. ROCK1 or ROCK2 depletion suppresses Aβ levels in cultured neurons (Fig. 3a), and on this basis, we propose that small molecules that inhibit both ROCK1 and ROCK2 may be promising agents for amyloid-based therapeutics. To this end, Fasudil is a clinically approved ROCK inhibitor that was shown to suppress Aβ production in neurons (Shibuya et al. 2005, Herskowitz et al. 2013).
Acknowledgments
This work was supported by the National Institutes of Health through NIA AG043552-05 to J.H.H. This work was also supported by a New Investigator Research Grant 2015-NIRG-339422 from the Alzheimer’s Association to J.H.H. This research project was supported in part by the Viral Vector Core of the Emory Neuroscience NINDS Core Facilities grant, P30NS055077, the Johns Hopkins University Alzheimer’s Disease Research Center NIH AG05146 to Dr. Juan Troncoso, and AG05136 to T.J.M. We are grateful to participants in the Baltimore Longitudinal Study of Aging for their invaluable contribution. This research was supported in part by the Intramural Research Program of the NIH, National Institute on Aging. We thank Drs. James Lah, Allan Levey, and Erik Roberson for helpful discussions and Dr. Jeremy Day’s lab for technical assistance.
Abbreviations
- AD
Alzheimer’s disease
- MCI
mild cognitive impairment due to AD
- Aβ
amyloid-β
- APP
amyloid precursor protein
- ROCK
Rho-associated coiled-coil containing protein kinase
- LIMK
LIM-kinase
- NSAID
non-steroidal anti-inflammatory drug
Footnotes
conflict of interest disclosure
The authors have no conflict of interest to declare.
References
- Bauer PO, Wong HK, Oyama F, Goswami A, Okuno M, Kino Y, Miyazaki H, Nukina N. Inhibition of Rho kinases enhances the degradation of mutant huntingtin. J Biol Chem. 2009;284:13153–13164. doi: 10.1074/jbc.M809229200. [DOI] [PMC free article] [PubMed] [Google Scholar]
- Bradley A, Anastassiadis K, Ayadi A, et al. The mammalian gene function resource: the International Knockout Mouse Consortium. Mamm Genome. 2012;23:580–586. doi: 10.1007/s00335-012-9422-2. [DOI] [PMC free article] [PubMed] [Google Scholar]
- Donovan LE, Higginbotham L, Dammer EB, et al. Analysis of a membrane-enriched proteome from postmortem human brain tissue in Alzheimer’s disease. Proteomics Clin Appl. 2012;6:201–211. doi: 10.1002/prca.201100068. [DOI] [PMC free article] [PubMed] [Google Scholar]
- Driscoll I, Troncoso J. Asymptomatic Alzheimer’s disease: a prodrome or a state of resilience? Curr Alzheimer Res. 2011;8:330–335. doi: 10.2174/156720511795745348. [DOI] [PMC free article] [PubMed] [Google Scholar]
- Frandemiche ML, De Seranno S, Rush T, Borel E, Elie A, Arnal I, Lante F, Buisson A. Activity-dependent tau protein translocation to excitatory synapse is disrupted by exposure to amyloid-beta oligomers. J Neurosci. 2014;34:6084–6097. doi: 10.1523/JNEUROSCI.4261-13.2014. [DOI] [PMC free article] [PubMed] [Google Scholar]
- Gentry EG, Henderson BW, Arrant AE, Gearing M, Feng Y, Riddle NC, Herskowitz JH. Rho Kinase Inhibition as a Therapeutic for Progressive Supranuclear Palsy and Corticobasal Degeneration. J Neurosci. 2016;36:1316–1323. doi: 10.1523/JNEUROSCI.2336-15.2016. [DOI] [PMC free article] [PubMed] [Google Scholar]
- Hardy J, Selkoe DJ. The amyloid hypothesis of Alzheimer’s disease: progress and problems on the road to therapeutics. Science. 2002;297:353–356. doi: 10.1126/science.1072994. [DOI] [PubMed] [Google Scholar]
- Heredia L, Helguera P, de Olmos S, et al. Phosphorylation of actin-depolymerizing factor/cofilin by LIM-kinase mediates amyloid beta-induced degeneration: a potential mechanism of neuronal dystrophy in Alzheimer’s disease. J Neurosci. 2006;26:6533–6542. doi: 10.1523/JNEUROSCI.5567-05.2006. [DOI] [PMC free article] [PubMed] [Google Scholar]
- Herskowitz JH, Feng Y, Mattheyses AL, et al. Pharmacologic inhibition of ROCK2 suppresses amyloid-beta production in an Alzheimer’s disease mouse model. J Neurosci. 2013;33:19086–19098. doi: 10.1523/JNEUROSCI.2508-13.2013. [DOI] [PMC free article] [PubMed] [Google Scholar]
- Herskowitz JH, Offe K, Deshpande A, Kahn RA, Levey AI, Lah JJ. GGA1-mediated endocytic traffic of LR11/SorLA alters APP intracellular distribution and amyloid-beta production. Mol Biol Cell. 2012;23:2645–2657. doi: 10.1091/mbc.E12-01-0014. [DOI] [PMC free article] [PubMed] [Google Scholar]
- Herskowitz JH, Seyfried NT, Gearing M, Kahn RA, Peng J, Levey AI, Lah JJ. Rho kinase II phosphorylation of the lipoprotein receptor LR11/SORLA alters amyloid-beta production. J Biol Chem. 2011;286:6117–6127. doi: 10.1074/jbc.M110.167239. [DOI] [PMC free article] [PubMed] [Google Scholar]
- Koch JC, Tonges L, Barski E, Michel U, Bahr M, Lingor P. ROCK2 is a major regulator of axonal degeneration, neuronal death and axonal regeneration in the CNS. Cell Death Dis. 2014;5:e1225. doi: 10.1038/cddis.2014.191. [DOI] [PMC free article] [PubMed] [Google Scholar]
- Lacor PN, Buniel MC, Furlow PW, Clemente AS, Velasco PT, Wood M, Viola KL, Klein WL. Abeta oligomer-induced aberrations in synapse composition, shape, and density provide a molecular basis for loss of connectivity in Alzheimer’s disease. J Neurosci. 2007;27:796–807. doi: 10.1523/JNEUROSCI.3501-06.2007. [DOI] [PMC free article] [PubMed] [Google Scholar]
- Nakagawa O, Fujisawa K, Ishizaki T, Saito Y, Nakao K, Narumiya S. ROCK-I and ROCK-II, two isoforms of Rho-associated coiled-coil forming protein serine/threonine kinase in mice. FEBS Lett. 1996;392:189–193. doi: 10.1016/0014-5793(96)00811-3. [DOI] [PubMed] [Google Scholar]
- Ohashi K, Nagata K, Maekawa M, Ishizaki T, Narumiya S, Mizuno K. Rho-associated kinase ROCK activates LIM-kinase 1 by phosphorylation at threonine 508 within the activation loop. J Biol Chem. 2000;275:3577–3582. doi: 10.1074/jbc.275.5.3577. [DOI] [PubMed] [Google Scholar]
- Pedrini S, Carter TL, Prendergast G, Petanceska S, Ehrlich ME, Gandy S. Modulation of statin-activated shedding of Alzheimer APP ectodomain by ROCK. PLoS Med. 2005;2:e18. doi: 10.1371/journal.pmed.0020018. [DOI] [PMC free article] [PubMed] [Google Scholar]
- Petratos S, Li QX, George AJ, et al. The beta-amyloid protein of Alzheimer’s disease increases neuronal CRMP-2 phosphorylation by a Rho-GTP mechanism. Brain. 2008;131:90–108. doi: 10.1093/brain/awm260. [DOI] [PubMed] [Google Scholar]
- Pozueta J, Lefort R, Ribe EM, Troy CM, Arancio O, Shelanski M. Caspase-2 is required for dendritic spine and behavioural alterations in J20 APP transgenic mice. Nat Commun. 2013;4:1939. doi: 10.1038/ncomms2927. [DOI] [PMC free article] [PubMed] [Google Scholar]
- Shibuya M, Hirai S, Seto M, Satoh S, Ohtomo E. Effects of fasudil in acute ischemic stroke: results of a prospective placebo-controlled double-blind trial. J Neurol Sci. 2005;238:31–39. doi: 10.1016/j.jns.2005.06.003. [DOI] [PubMed] [Google Scholar]
- Sperling RA, Aisen PS, Beckett LA, et al. Toward defining the preclinical stages of Alzheimer’s disease: recommendations from the National Institute on Aging-Alzheimer’s Association workgroups on diagnostic guidelines for Alzheimer’s disease. Alzheimers Dement. 2011;7:280–292. doi: 10.1016/j.jalz.2011.03.003. [DOI] [PMC free article] [PubMed] [Google Scholar]
- Woo S, Gomez TM. Rac1 and RhoA promote neurite outgrowth through formation and stabilization of growth cone point contacts. J Neurosci. 2006;26:1418–1428. doi: 10.1523/JNEUROSCI.4209-05.2006. [DOI] [PMC free article] [PubMed] [Google Scholar]
- Yamamoto A, Tagawa Y, Yoshimori T, Moriyama Y, Masaki R, Tashiro Y. Bafilomycin A1 prevents maturation of autophagic vacuoles by inhibiting fusion between autophagosomes and lysosomes in rat hepatoma cell line, H-4-II-E cells. Cell structure and function. 1998;23:33–42. doi: 10.1247/csf.23.33. [DOI] [PubMed] [Google Scholar]
- Zhang XF, Schaefer AW, Burnette DT, Schoonderwoert VT, Forscher P. Rho-dependent contractile responses in the neuronal growth cone are independent of classical peripheral retrograde actin flow. Neuron. 2003;40:931–944. doi: 10.1016/s0896-6273(03)00754-2. [DOI] [PubMed] [Google Scholar]
- Zhou Y, Su Y, Li B, et al. Nonsteroidal anti-inflammatory drugs can lower amyloidogenic Abeta42 by inhibiting Rho. Science. 2003;302:1215–1217. doi: 10.1126/science.1090154. [DOI] [PubMed] [Google Scholar]