Abstract
The initiation of T-cell responses in lymph nodes requires T cells to integrate signals delivered by dendritic cells (DCs) during long-lasting contacts (synapses) or more transient interactions (kinapses). However, it remains extremely challenging to understand how a specific sequence of contacts established by T cells ultimately dictates T-cell fate. Here, we have coupled a computational model of T-cell migration and interactions with DCs with a real-time, flow cytometry-like representation of T-cell activation. In this model, low-affinity peptides trigger T-cell proliferation through kinapses but we show that this process is only effective under conditions of high DC densities and prolonged antigen availability. By contrast, high-affinity peptides favor synapse formation and a vigorous proliferation under a wide range of antigen presentation conditions. In line with the predictions, decreasing the DC density in vivo selectively abolished proliferation induced by the low-affinity peptide. Finally, our results suggest that T cells possess a biochemical memory of previous stimulations of at least 1–2 days. We propose that the stability of T-cell–DC interactions, apart from their signaling potency, profoundly influences the robustness of T-cell activation. By offering the ability to control parameters that are difficult to manipulate experimentally, the virtual lymph node model provides new possibilities to tackle the fundamental mechanisms that regulate T-cell responses elicited by infections or vaccines.
Naïve T lymphocytes are motile cells that survey individual lymph nodes in search of their cognate antigen. The initiation of T-cell responses requires T cells to integrate signals received during contacts with dendritic cells (DCs). Recognition of antigenic peptide presented by DCs triggers T cells to either stop, forming stable, hour-long contacts (referred to as synapses) or to only partly decelerate, establishing shorter (5–10 min), more dynamic interactions (termed kinapses).1, 2 Several studies have demonstrated that an elevated signal strength because of a high peptide density or a high T-cell receptor (TCR) ligand affinity favors synapses over kinapses3, 4, 5, 6 but that both types of contacts can result in productive signaling.5, 7 As T cells continue to collect activation signals throughout the duration of contact, synapses that last longer than kinapses are expected to deliver more signals on a per interaction basis. T-cell activation through the formation of synapses is well established and has been shown to require several hours of continuous stimulation.8, 9 Interestingly, T-cell activation and proliferation by kinapses is also possible through the ability of T cells to engage multiple DCs successively and sum signals received through these sequential interactions.10, 11 Such capacity of signal integration implies that T cells possess a biochemical memory of previous encounters that is not reset upon detachment from DCs. In support of this, in vitro studies have illustrated that T cells can sum intermittent stimulations separated by a resting period of several hours.12, 13 Several mechanisms have been proposed to explain such ability, including hysteresis in the Ras pathway,14 persistence of nuclear factor of activated T-cells (NFAT) in the nucleus15 and gradual increase in c-fos levels that can act as a stimulation counter.16
Although we have gained much insight into the regulation and signaling properties of kinapses and synapses, it remains extremely challenging to understand how the sequence of DC interactions experienced by a given T-cell dictates its ultimate fate. Indeed, T cells are sequestered in lymph nodes for 3–4 days after initial antigen encounter, a period during which they can establish several contacts of different types. Although intravital imaging approaches have been instrumental to clarify the diversity of T-cell–DC dynamics, they are typically restricted to a few hours of observation and complicated by the motile nature of T cells, precluding tracking of the entire activation process.17, 18
To tackle this important question, we have exploited a computational model of T-cell–DC interactions and subsequent activation events. In this virtual lymph node, T-cell migration, contact dynamics, signal integration and cell division are simulated with the ability to test the contribution of many parameters influencing the properties of T cells, DCs or antigen. We show that this model can recapitulate T-cell dynamics and proliferation triggered by TCR ligand of distinct affinities similar to in vivo observation and use it to test the differential requirements for T-cell proliferation mediated by kinapses and synapses.
Results
A virtual lymph node model to study T-cell activation
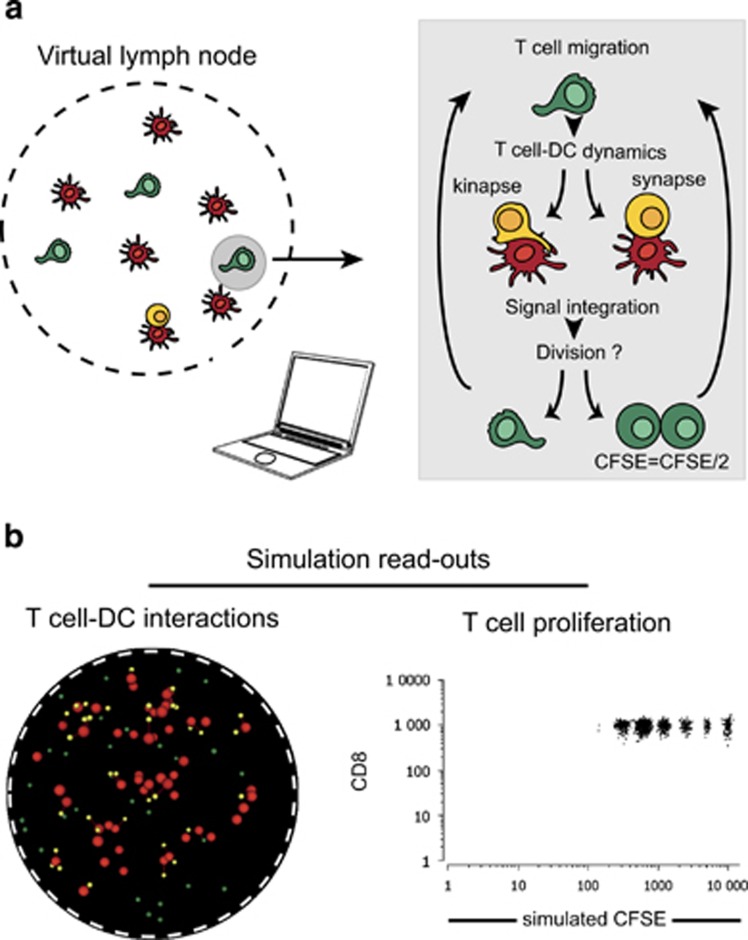
T-cell priming in the lymph node spans over 3–4 days, a period after which clonally expanded T cells egress to disseminate in peripheral organs. To better understand the parameters that influence the sequence of interactions established by T cells during this period, as well as the functional consequences of a specific sequence of contacts, we relied on a computational model of T-cell activation (referred to as the virtual lymph node model).19, 20 Briefly, the model simulates T-cell migration in a defined volume representing the T-cell zone of a lymph node, as well as cellular interactions with DCs and subsequent activation (Figure 1a). Random T-cell motility in the virtual lymph node is simulated using parameters measured by in vivo imaging experiments. DCs are considered immotile and express cognate peptide-major histocompatibility complexes (pMHC) on their surface. DC density, DC half-life, pMHC density and pMHC half-life can be adjusted to the desired value. T-cell–DC contact duration (kinapse versus synapse formation) is regulated by both TCR affinity and pMHC density to reflect the known dependence of T-cell–DC dynamics on signal strength.3, 4, 5, 6 As long as the contact is maintained, T cells collect activation signals that depend on TCR affinity and pMHC density. Upon T-cell detachment from DCs, previously collected signals persist with an adjustable decay to incorporate the ability of T cells to integrate signals. Finally, the first and subsequent T-cell divisions are triggered when the collected signals reach defined thresholds.
Figure 1.
Modeling T-cell activation using a virtual lymph node model. (a) Principle of the virtual lymph node model. The model simulates T cells randomly migrating into a virtual lymph node and interacting with DCs bearing cognate antigenic complexes. Upon encounter with a DC, T cells establish a synapse or a kinapse based on the overall signal strength. T cells collect activation signals as long as the contact is maintained and harbor a memory of collected signals allowing for signal integration upon additional encounters. T cells divide when the activation signals reach a defined threshold. CFSE dilution is simulated for individual T cells. (b) Dynamic representations of the simulated T-cell responses include time-lapse movies of T-cell–DC contacts as well as ‘real-time' flow cytometry-like dot plots.
T-cell responses can be monitored by several graphs representing the evolution of distinct variables during the course of the simulation. Importantly, we have incorporated two graphic outputs that facilitate comparison with experimental data. First, the simulation generates a time-lapse movie of T-cell–DC interactions, for comparison with two-photon data sets. Second, T-cell proliferation can be followed by a simulated carboxyfluorescein succinimidyl ester (CFSE) dilution fluorescence-activated cell sorting (FACS)-like plots, for direct comparison with flow cytometry data. Of note, as simulated FACS data can be obtained for each time point, the model can generate a time-lapse movie representing the evolution of the FACS profile during the course of the simulations. The model could easily incorporate additional parameters in the FACS representation but, in this study, we will primarily focus on CFSE dilution profiles (Figure 1b).
Modeling the formation of T-cell kinapses and synapses
We have previously shown using two-photon microscopy and the OT-I transgenic TCR model that a low-affinity peptide (V4 peptide) favors the formation of kinapses, whereas high-affinity peptide (N4) promotes full T-cell arrest and the establishment of synapses.5 As an independent approach to validate that these two peptides induced different types of contacts, we took advantage of the previously reported observation that stable interactions between T cells and DCs limit the efficacy of isolation of antigen-specific T cells from lymph node although these T cells are readily detected by immunohistochemistry.21 Consistently, when DCs pulsed with the high-affinity N4 peptide were injected together with OT-I T cells, the recovery of OT-I T cells from the draining lymph node at day 1 was limited when assessed by flow cytometry. By contrast, OT-I T cells were recovered effectively when DCs were pulsed with the low-affinity V4 peptide (Supplementary Figures S1A and B). Importantly, both DCs pulsed with N4 and V4 triggered T-cell activation as assessed by CD69 (Supplementary Figure S1C). This observation, together with our previous imaging studies, confirmed that high-affinity peptides favor the formation of stable T-cell–DC contacts.
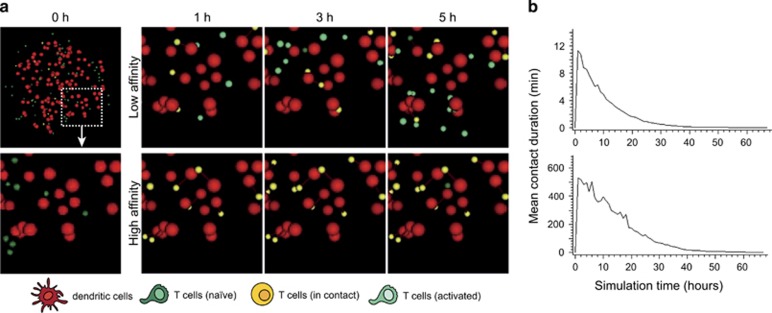
In the virtual lymph node model, T-cell–DC contact dynamics are set to be regulated by TCR-pMHC affinity. As shown in Figure 2a and Supplementary Movie S1, varying TCR affinity (and keeping other parameters unchanged) lead to drastically different sequences of T-cell–DC interactions. Low-affinity interactions resulted in the formation of kinapses during the first day of the simulation (contact duration of 5–10 min) (Figure 2b). By contrast, simulations run with high-affinity peptides induce hour lasting interactions (on average 8 h) for the majority of T cells present in the lymph node (Figure 2b). Owing to the decay in antigen load simulated in the model, stable interactions were typically lost after 1 day, a finding similar to what has been reported in vivo.22 Thus, the model can be fitted to reproduce T-cell dynamics seen in vivo with high- and low-affinity TCR ligands, offering a basis for modeling the outcome T-cell activation in responses of distinct sequences of T-cell–DC interaction.
Figure 2.
Modeling T-cell synapses and kinapses in the virtual lymph node model. (a) Time-lapse images from simulations run for T cells recognizing a low- versus a high-affinity peptide. DCs are shown in red. Naive T cells in dark green. T cells forming a productive contact with a DC (either a synapse or a kinapse) are shown in yellow. T cells that have collected activation signals are shown in light green. T cells interacting with DCs presenting the low or the high-affinity antigen results in the formation of kinapses or synapses, respectively. (b) The graphs show the mean contact duration established by T cells during the course of the simulation.
Real-time monitoring of T-cell proliferation generated by synapses and kinapses
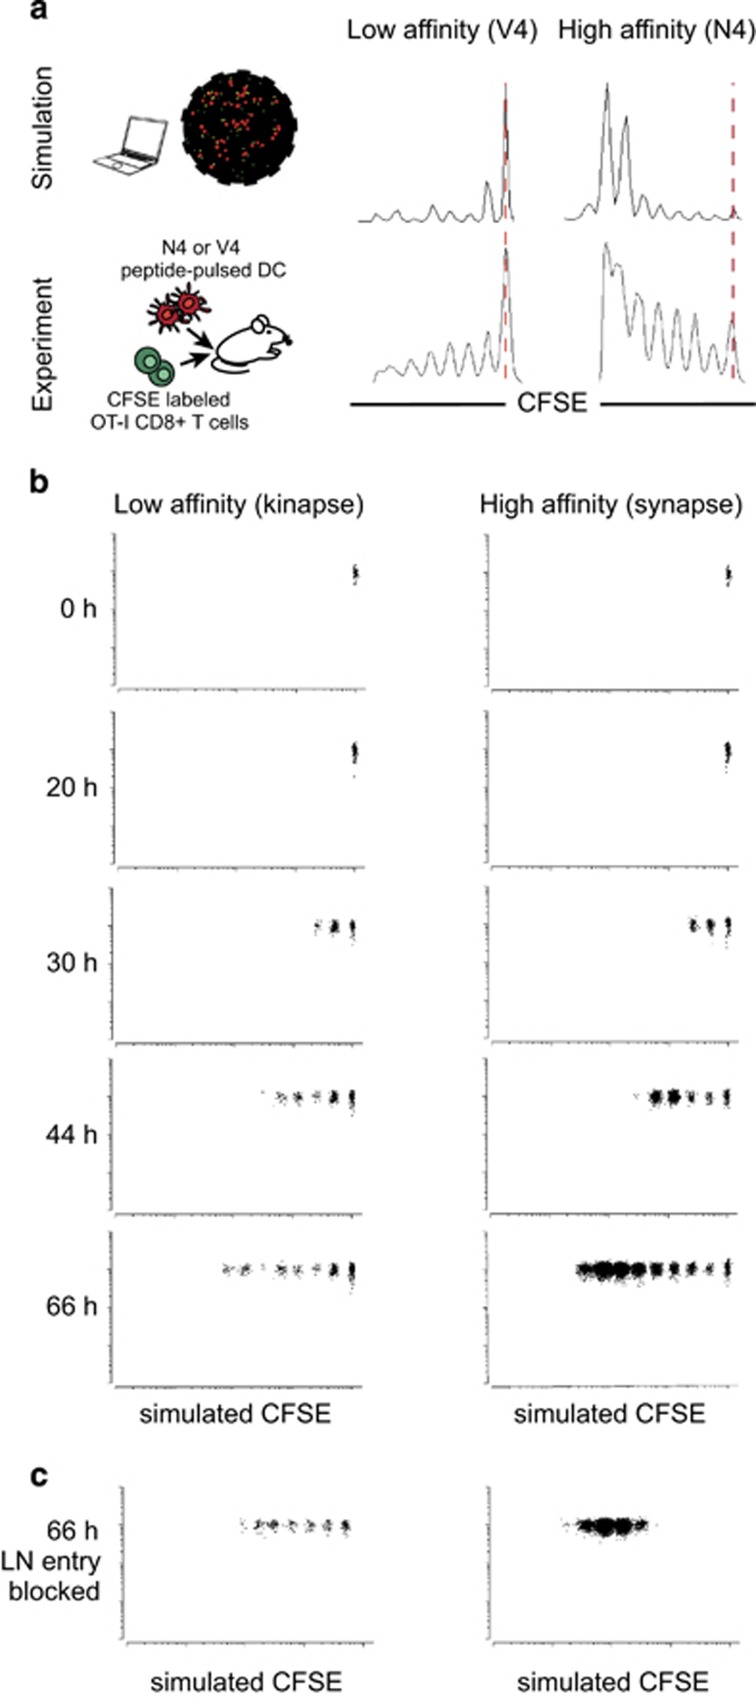
We first experimentally measured the in vivo proliferation of CFSE-labeled OT-I T cells stimulated by DCs pulsed with either V4 or N4 peptide after 66 h. In parallel, simulations corresponding to the same time point were run using the virtual lymph node model to predict T-cell proliferation. Parameter values of the model including activation threshold for proliferation and rate of division were adjusted so that the simulated CFSE profiles best fit the experimental plots (see Methods for the model fitting approach). Of note, we cannot exclude that a different set of parameter values could also provide an acceptable fit. Nevertheless, it was notable that, under our conditions, simulations run by varying solely the TCR affinity yielded CFSE profiles that were similar to the experimental CFSE data obtained with N4 and V4 peptides, in term of number of cell division, overall CFSE distribution and dominant CFSE peaks (Figure 3a).
Figure 3.
Dynamic monitoring of T-cell proliferation generated by synapses and kinapses. (a) Comparison of T-cell proliferation measured experimentally in vivo by flow cytometry or simulated using the virtual lymph node model. For in vivo experiments, N4 or V4 peptide-pulsed DCs were injected in the footpad, whereas CFSE-labeled OT-I T cells were injected intravenously. At 66 h, lymph node cells were subjected to flow cytometry. (b) CFSE dilution profiles were generated for different time points of the simulation in conditions of low- or high-affinity peptide. (c) Simulation was run in conditions where T-cell entry into the lymph node is blocked.
As shown in Figure 3b and Supplementary Movie S2, time-lapse movies of simulated CFSE dilution provided an overview of the temporal dynamics of T-cell priming under each simulated condition. T-cell proliferation started after a day for both high- and low-affinity peptides. However, more T cells committed to division and sustained their proliferation under high-affinity peptide condition. As observed in experimental conditions, a substantial proportion of T cells had not divided or undergone only 1–2 cell divisions. This population could represent cells that had quickly stopped proliferating or, alternatively, T cells that arrived at a later time point in the lymph node. To test the latter hypothesis, we ran simulations where we blocked T-cell entry in the lymph node. In these conditions, we significantly reduced the fraction of low dividing cells (Figure 3c), suggesting that heterogeneity in the timing of lymph node entry contributes to the shaping of CFSE profiles.
T-cell proliferation triggered by kinapses requires an elevated density of antigen-presenting DCs and prolonged antigen availability
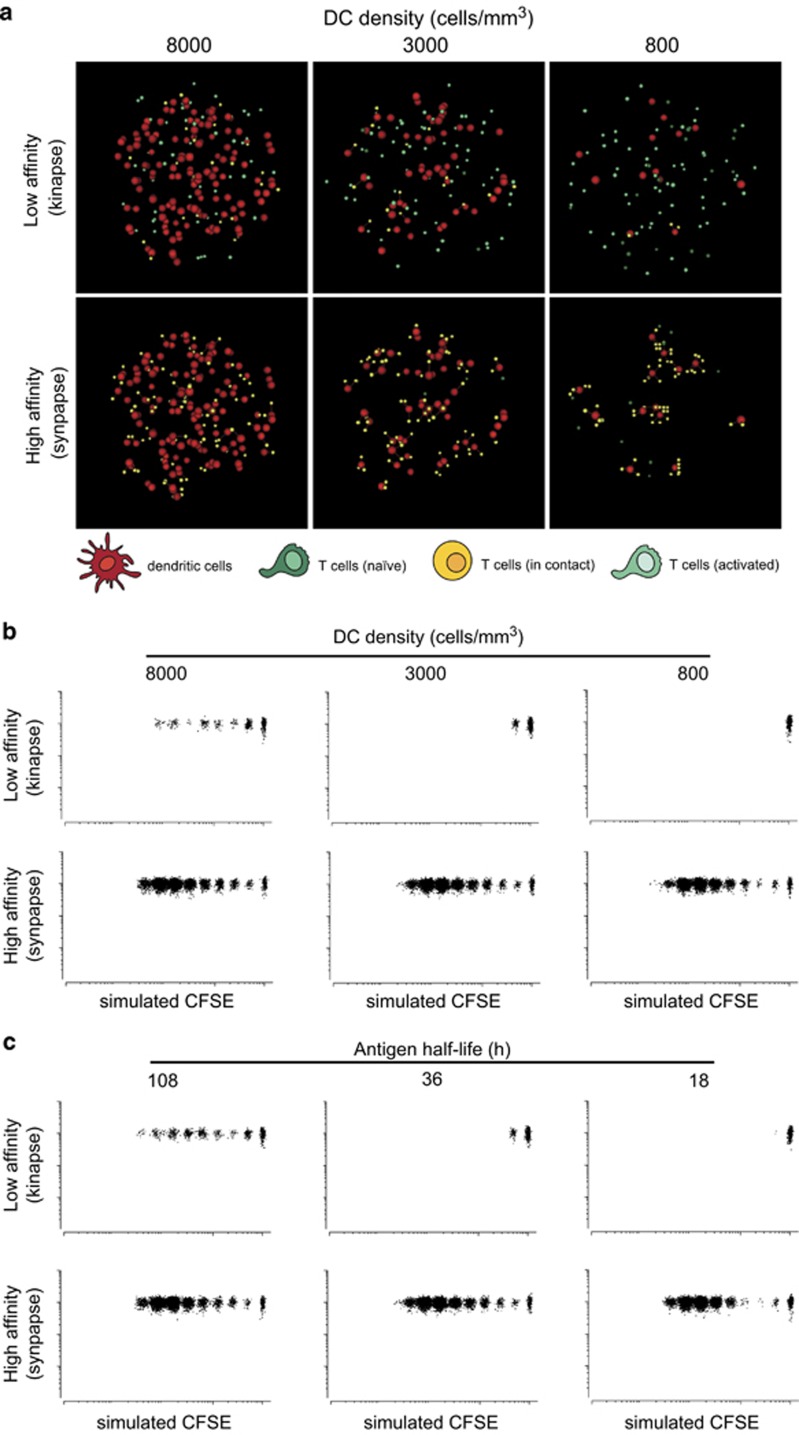
We next used our model to test the requirements for T-cell activation by kinapses. In particular, we asked how the density of DCs regulates kinapse-mediated T-cell activation by influencing the probability of T-cell–DC encounters and hence T-cell ability to integrate signals. Simulations were performed for three distinct DC densities (8000, 3000 and 800 cells per mm3) under low- and high-affinity peptide conditions. Interestingly, synapse-based T-cell activation mediated by the high-affinity peptide was largely unaffected by DC density (Figure 4a and Supplementary Movie S3). In fact, T-cell motility enabled T cells to find rare DCs and establish long-lasting contacts. Under low DC density condition, more T cells were clustered around each individual DC, a consequence matching experimental observations we made in a previous study.23 By contrast, in condition of low-affinity peptide, decreasing DC density substantially reduced T-cell probability to interact with a DC at a given time point (Figure 4a and Supplementary Movie S3) as they needed more time to travel from one kinapse to another. Consistently, although CFSE dilution profiles generated in the context of high-affinity peptide were very similar for all three DC densities tested, kinapse-triggered proliferation elicited by the low-affinity peptide dropped drastically for DC densities below 8000 cells per mm3 (Figure 4b and Supplementary Movie S4). Therefore, our model provides a quantitative estimate supporting the intuitive idea that T-cell proliferation can be induced by kinapses but only in conditions of high DC density.
Figure 4.
Role of DC density and antigen persistence on kinapse- or synapse-driven T-cell activation. (a) T-cell contacts were simulated for distinct densities of DCs presenting a low- or high-affinity peptide. (b) Simulated CFSE profiles at 66 h analyzed for three different DC densities for DC presenting either a low- or high-affinity peptides. (c) Simulated CFSE profiles at 66 h were analyzed for an intermediate value of DC density (3000 cells/mm3) presenting either a low- or high-affinity peptide with the indicated values of antigen half-life.
Our results suggested that, in the context of low-affinity peptide, T cells fail to proliferate when the DC density is low because T cells may not sum enough signals before antigen levels drop. We therefore sought to measure the extent to which T-cell activation by low-affinity peptide could be enhanced by increasing antigen persistence and hence the period for signal collection. Simulations were performed in the condition of intermediate DC density (3000 cells per mm3) and showed that a threefold increase in antigen half-life on the surface of DCs had a major impact on T-cell activation by kinapses but had minimal effects on T-cell activation by synapses (Figure 4c and Supplementary Movie S5). Overall, our results support the idea that a combination of high DC density and long antigen half-life are required for kinapse-mediated T-cell proliferation.
In vivo proliferation assay confirmed the critical role of DC density in kinapse-based T-cell activation
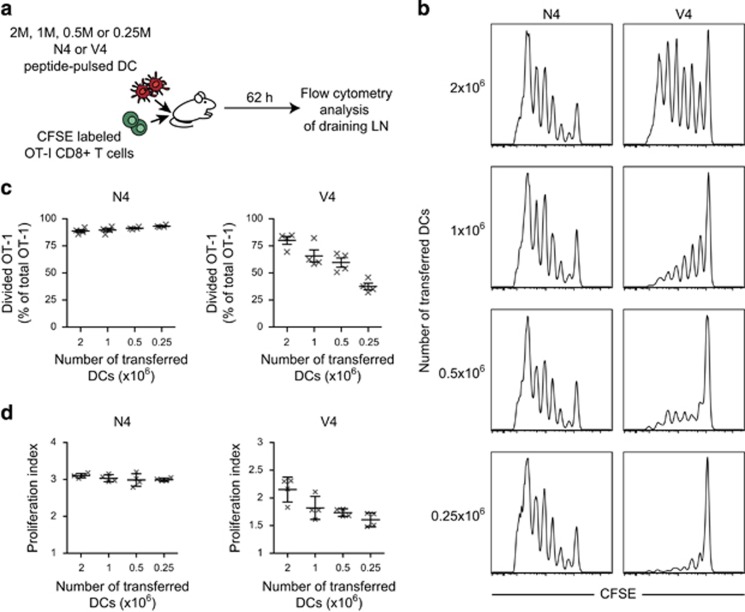
Guided by the model predictions, we sought to test the relative importance of DC density during kinapse- or synapse-based T-cell activation in vivo. Mice were then injected with graded numbers of DCs pulsed with N4 or V4 peptides and with CFSE-labeled OT-1 T cells (Figure 5a). At 62 h, in vivo T-cell proliferation was measured by flow cytometry. T-cell proliferation triggered by the high-affinity peptide was, by and large, unaffected by a decrease in DC density. In contrast, T-cell proliferation induced by the low-affinity peptide was only efficient at high DC density and dropped rapidly when the number of transferred DCs decreased (Figures 5b and c). These results emphasis the predictive potential of the virtual lymph node model and its value for suggesting specific hypothesis-driven experiments.
Figure 5.
Testing the model prediction on the influence of DC density for kinapse- versus synapse-based T-cell proliferation. (a) Experimental set-up. Recipient mice were injected with various numbers of N4 or V4 peptide-pulsed DCs in the footpad and with CFSE-labeled OT-I T cells intravenously. At 62 h, lymph node cells were subjected to flow cytometry. (b) CFSE profiles of OT-I T cells in recipient mice transferred with the indicated number of DCs and pulsed with either N4 or V4 peptide. Profiles are representative of four distinct lymph nodes per condition. (c) Graph shows the percentage of divided T cells among the total OT-I T-cell population. (d) The proliferation index is graphed for the indicated conditions.
Assessing T-cell biochemical memory of past DC encounters
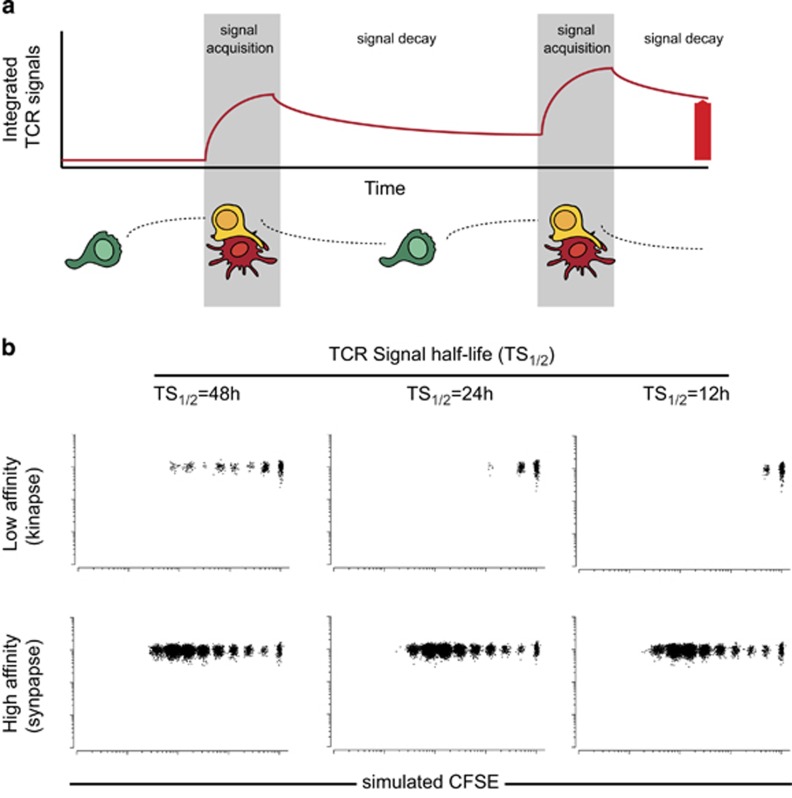
We also use the virtual lymph node model as an opportunity to test how T-cell activation is influenced by T-cell capacity to remember signals received during past DC encounters. The model incorporates the ability to define the rate at which collected signals decay once T cells detach from the DCs by controlling TCR signal half-life (Figure 6a). In this context, a short half-life would reflect a poor ability to retain accumulated signals. Synapse-mediated T-cell proliferation was by and large independent of the half-life of TCR signals, reflecting the fact that a single (or very few) contact is sufficient to drive proliferation (Figure 6b and Supplementary Movie S6). Kinapse-driven T-cell activation was more stringently dependent on this parameter. Interestingly, our results suggest that such T-cell biochemical memory should last for 48 h (Figure 6b) or more, to explain the observed ability of kinapses to trigger proliferation.10, 11
Figure 6.
T-cell proliferation by low-affinity peptides requires long half-lives for previously collected TCR signals. (a) Scheme illustrating the integration of TCR signals collected by T cells over successive interactions. Note that the model allows for the control of TCR signal decay once T cells have detached from the DC. (b) T-cell responses were simulated for various half-lives of TCR signals. Simulated CFSE profiles at 66 h are shown.
The kinapse mode of T-cell activation limits T-cell responses to low-affinity peptide
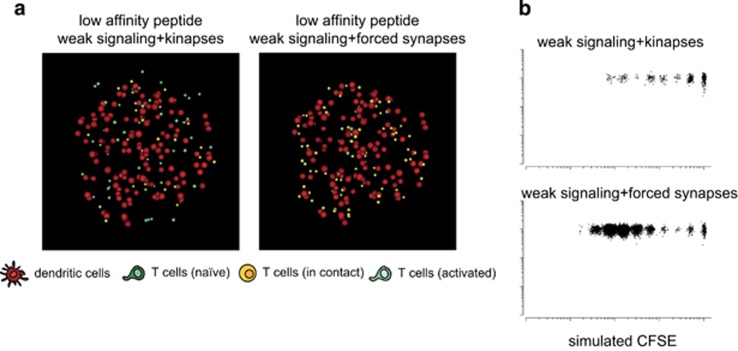
Low-affinity peptide potentially limits T-cell responses by at least two means: (i) by delivering weak TCR signals during antigen recognition, and (ii) by favoring the formation of shorter contacts (kinapses over synapses). To test whether the kinapse mode of T-cell activation strongly dampens T-cell proliferation triggered by low-affinity peptide, we simulated an artificial situation in which a low-affinity peptide still delivers weak TCR signals but triggers synapses instead of kinapses (forced synapses) (Figure 7a). For this, we decreased the threshold for synapse formation so that even a weak stimulation induced long-lasting contacts. As shown in Figure 7b, vigorous T-cell proliferation was observed in conditions of forced synapses and low-affinity peptide, suggesting that the kinapse mode of activation represents a major limitation for T-cell responses to low-affinity antigen, apart from weak levels of TCR signaling. Taken together, our results support the idea that the regulation of T-cell–DC contact duration by signal strength is a key mechanism for controlling the robustness of T-cell activation.
Figure 7.
The regulation of synapse versus kinapse formation by peptide affinity has a major effect on T-cell proliferation. Simulations were performed so that low-affinity peptides trigger synapse formation but still deliver weak TCR signals. (a) Images of simulated T-cell–DC interactions at 6 h and (b) proliferative profiles corresponding to conditions under which low-affinity peptides trigger kinapses or are forced to induce synapses.
Discussion
We aimed here to introduce a versatile computational methodology designed to help delineate basic mechanisms of T-cell activation in vivo. Computational models can help interpret the complex orchestration of immune reactions. In particular, the modeling of cellular dynamics has provided important insights into T-cell migration24 and search strategies25, 26, 27, 28 and into the efficiency of T-cell activation.29, 30, 31, 32 Notably, recent experimental evidence that signal strength controls the duration of T-cell–DC interactions3, 5 and that T cells have the ability to sum-up intermittent signals10, 12, 13, 33 have substantially modified our perception of T-cell activation in vivo. Our virtual lymph node model was designed in part to incorporate these two key mechanisms and make quantitative estimate of the outcome of T-cell activation in vivo. In addition, the flow cytometry-like representations incorporated in our model are intended to facilitate comparison with published experimental data and could be extended in the future to track other parameters, for example to model T-cell differentiation. Side-by-side comparison of experimental data and simulations will also serve to further calibrate and improve the model.
By providing reductionist views of complex systems, models help identify the key rules regulating biological processes. We suggest that four simple rules are sufficient to mimic many aspects of T-cell proliferation: (i) the randomness of T-cell migration, (ii) the regulation of T-cell–DC contact duration by signal strength, (iii) the integration of signals during T-cell–DC contacts, (iv) the short-term memory of previously collected signals. Models are also useful to make predictions and explore or generate new hypotheses. As a proof-of-concept, we used the virtual lymph node model to test the requirements for T-cell activation by synapses and kinapses. Our results suggest that T-cell activation through kinapses is possible but only under conditions of high DC densities and prolonged antigen availability. In line with the model prediction, we could confirm experimentally that kinapse-based T-cell proliferation is highly sensitive to the density of DCs in the lymph node. Our results also imply that kinapse-based activation requires T cells to possess a biochemical memory of past encounters that exceed 1 day, a prediction consistent with published experiments.12 It will be interesting to include in future versions of the model other parameters such as cytokine signals that may significantly influence T-cell proliferation.34 We propose that low-affinity peptides trigger weak T-cell responses not only because of their low stimulatory capacity but mostly because they trigger kinapses that limit signal integration. The virtual lymph node model should constitute an interesting resource for immunologists to test new paradigms by modulating factors that are impossible to manipulate in vivo and help predict key parameters optimizing T-cell responses.
Methods
In vivo T-cell activation
C57BL/6 mice were purchased from Charles River Laboratories (Wilmington, MA, USA). Rag1−/− OT-I TCR transgenic mice were bred in our animal facility. All mice were housed in our animal facility under specific pathogen-free conditions. Animal experiments were performed in accordance to the guidelines of Institut Pasteur for animal care and use. DCs were purified from the spleen of C57BL/6 mice using a CD11c-negative isolation kit (Miltenyi Biotec, Bergisch Glasbach, Germany) and loaded with 10−7m OVA257-264 wild-type N4 (SIINFEKL) and V4 (SIIVFEKL) peptides (purchased from Polypeptide Group, Strasbourg, France) for 30 min at 37 °C in complete RPMI. The indicated numbers of DCs were adoptively transferred in the footpad of recipient C57BL/6 mice. Eighteen hours later, 2 × 10⁶ OT-I CD8+ T cells obtained from the lymph nodes of Rag1−/− OT-I mice and labeled with 2 μM CFSE (Invitrogen, Waltham, MA, USA) were adoptively transferred by intravenous injection. Twenty-four or 66 h after T-cell transfer, mice were killed, and cell suspensions were prepared from draining and non-draining lymph nodes by mashing the lymph nodes through 70 μm cell strainers in complete RPMI without collagenase. Proliferation was assessed by CFSE dilution analyzed on a FACS Canto II (BD Biosciences, Le Pont de Claix, France). Data were analyzed with the FlowJo software (version 9.1, Tree Star, Ashland, OR, USA). Proliferation index is defined as the average number of cell divisions for divided T cells and was calculated using FlowJo.
Computational modeling of T-cell activation
The virtual lymph node model refers to an improved version of an agent-based model we described previously.20 The main additions to the model include a new treatment of T-cell–DC dynamics and a graphical representation of T-cell proliferation in the form of virtual FACS profiles (both aspects are detailed below). The model is lattice based with T cells moving on a regular rectangular lattice. The spacing of the lattice grid is such that each lattice site can accommodate one T cell. The spacing Δx is chosen in such a way that when all the sites in a volume are occupied by a cell the density of cells matches the specified volume fraction occupied by T cells in a lymph node. This volume fraction Vf is an input parameter. If the average T-cell radius is RTC, the lattice grid spacing is given by:
A DC occupies seven lattice sites, and other cells are strictly excluded from these sites. DCs are considered immotile, display a given level of antigen that decay over time. Although the volume of seven lattice sites approximates to the volume of a DC soma, the region within which a DC can be contacted extends beyond this, with DCs possessing a sphere of influence corresponding to the region within which a DC dendrite may encounter a T cell. For a T cell to move, it must jump to one of the neighboring sites on the lattice. Using the Moore neighborhood, there are 26 neighbor sites. The motility behavior observed by intravital microscopy is reproduced in the model by associating different probabilities with different jump directions.35 The computation of these probabilities is carried out for each cell at each time step, and takes into account the direction of the cell's previous jump (as the ‘random walk' behavior observed is not completely random but exhibits a tendency for cells to continue to move in the same direction). The motility model is controlled by two input parameters influencing the mean speed and the persistence of direction. By specifying the values of the two motility parameters appropriately it is possible to reproduce the range of cell motion that has been measured experimentally.
T cells may initiate a contact when entering the sphere of influence of a DC.19 During DC contact, the applicable normalized stimulation rate dSn/dt is calculated from the T cell's TCR affinity A and the DC's antigen density D. The density of antigen presented by a DC is initially assigned as a lognormal variate described by two input parameters (median and shape), and decays at a rate determined by the input antigen half-life parameter. Similarly, a naïve T cell's TCR affinity is generated from a lognormal distribution described by two input parameters. When a T cell divides, the progeny cells inherit the parent's TCR affinity. The normalized stimulation rate, a value in the range (0, 1), is simply the product of the normalized affinity and the normalized antigen density:
 |
If dSn/dt is below a threshold value Sthr the contact is treated as effectively non-cognate. T cell integrates the stimulation signal it receives when in contact with DCs, and the level of integrated signal Sn determines the cell's subsequent behavior. The stimulation level Sn is at all times subject to a rate of decay determined by the specified half-life parameter, and while the cell is in cognate contact with a DC Sn is boosted at the rate dSn/dt, up to a maximum level Smax that is an input parameter. In the previous version of the model, T-cell activation was simulated using the stage-wise scheme described by Miller et al.36, in which cells progress through stages labeled as ‘Transient', ‘Clusters', ‘Swarms' and ‘Proliferation'. The new model includes the addition of an alternate treatment of T-cell activation, in which the duration of T-cell binding to a DC depends on the rate of TCR stimulation, together with the introduction of the normalized stimulation rate described above. In this new model, stages of activation are not specified explicitly. After making cognate contact with a DC, a T-cell maintains contact for a duration TB that is a modified Hill function of the normalized stimulation rate (x=dSn/dt):
Here tn is the normalized bind time (0, 1) and TBmax is the maximum allowed bind time. CU, NU and TBmax are input parameters that characterize the bind time for the sub-model, together with the parameters that determine the normalized stimulation rate. Parameters were set here so that weak signals induced contacts of few minutes (kinapses) and strong stimuli triggered hour-long interactions (synapses up to 12 h). When the stored signal attains the threshold for full activation, cell proliferation is triggered and maintained as long as the accumulated signal does not drop below a given threshold. The list parameter values (fixed or varied) used in the simulations is shown in Supplementary Table S1. The simulated volume corresponded to a sphere of radius 160 μm and comprised a starting number of 64 cognate T cells.
To fit the model, we chose to fix first several of the model parameters according to averaged values found in the literature. These parameters were antigen half-life=36 h, DC half-life=2 days, relative affinity=1 (high affinity), 0.35 (low affinity), rate of proliferation=7 h).5, 37, 38, 39 Second, we adjusted the function linking TCR signals and contact duration (parameters of an Hill function) to reproduce the typical duration of kinapses and synapses observed in vivo (10 min for kinapses, 8 h for synapses). Finally, we tested different signal thresholds for T-cell division to match the simulated proliferation to the in vivo CFSE profiles for both low- and high-affinity peptides. In total, we ran >100 simulations and chose the set of parameters that provided the best compromise for both T-cell dynamics and proliferation in low- and high-affinity peptide conditions.
Graphical output of in silico T-cell activation
Simulated T-cell–DC contacts can be visualized in the form of time-lapse movies. Naïve T cells are shown in dark green. T cells that have already received TCR signals are shown in light green and are designated as ‘activated T cells'. T cells forming a contact with a DC (kinapse or synapse) are shown in yellow. The functional outcome of the simulations is now reported in the form of a time-lapse virtual FACS plot. In this study, T cells are initially assigned a value for CFSE content and CD8 expression level. The CFSE content of a dividing cell is shared between the two progeny cells in a way that introduces some variability. One cell receives a fraction of CFSE that is a generated random number drawn from a Gaussian distribution with mean 0.5 and s.d. 0.025, whereas the other cell receives the balance of the CFSE. Movies corresponding to different simulated conditions were combined using ImageJ, NIH, Bethesda, MD, USA.
Acknowledgments
We thank the members of the Bousso laboratory for comments on the manuscript. This work was supported by Institut Pasteur, Inserm, the Fondation pour la Recherche Médicale and by a European Research Council starting grant (LymphocyteContacts). GB acknowledges the support of the Auckland Bioengineering Institute and of the Maurice Wilkins Centre for Molecular Biodiscovery.
The authors declare no conflict of interest.
Footnotes
The Supplementary Information that accompanies this paper is available on the Immunology and Cell Biology website (http://www.nature.com/icb)
Supplementary Material
References
- Dustin ML. T-cell activation through immunological synapses and kinapses. Immunol Rev 2008; 221: 77–89. [DOI] [PubMed] [Google Scholar]
- Moreau HD, Bousso P. Visualizing how T cells collect activation signals in vivo. Curr Opin Immunol 2014; 26: 56–62. [DOI] [PubMed] [Google Scholar]
- Skokos D, Shakhar G, Varma R, Waite JC, Cameron TO, Lindquist RL et al. Peptide-MHC potency governs dynamic interactions between T cells and dendritic cells in lymph nodes. Nat Immunol 2007; 8: 835–844. [DOI] [PubMed] [Google Scholar]
- Henrickson SE, Mempel TR, Mazo IB, Liu B, Artyomov MN, Zheng H et al. T cell sensing of antigen dose governs interactive behavior with dendritic cells and sets a threshold for T cell activation. Nat Immunol 2008; 9: 282–291. [DOI] [PMC free article] [PubMed] [Google Scholar]
- Moreau HD, Lemaitre F, Terriac E, Azar G, Piel M, Lennon-Dumenil AM et al. Dynamic in situ cytometry uncovers T cell receptor signaling during immunological synapses and kinapses in vivo. Immunity 2012; 37: 351–363. [DOI] [PubMed] [Google Scholar]
- Pace L, Tempez A, Arnold-Schrauf C, Lemaitre F, Bousso P, Fetler L et al. Regulatory T cells increase the avidity of primary CD8+ T cell responses and promote memory. Science 2012; 338: 532–536. [DOI] [PubMed] [Google Scholar]
- Friedman RS, Beemiller P, Sorensen CM, Jacobelli J, Krummel MF. Real-time analysis of T cell receptors in naïve cells in vitro and in vivo reveals flexibility in synapse and signaling dynamics. J Exp Med 2010; 207: 2733–2749. [DOI] [PMC free article] [PubMed] [Google Scholar]
- Huppa JB, Gleimer M, Sumen C, Davis MM. Continuous T cell receptor signaling required for synapse maintenance and full effector potential. Nat Immunol 2003; 4: 749–755. [DOI] [PubMed] [Google Scholar]
- Celli S, Lemaitre F, Bousso P. Real-time manipulation of T cell-dendritic cell interactions in vivo reveals the importance of prolonged contacts for CD4+ T cell activation. Immunity 2007; 27: 625–634. [DOI] [PubMed] [Google Scholar]
- Gunzer M, Schafer A, Borgmann S, Grabbe S, Zanker KS, Brocker EB et al. Antigen presentation in extracellular matrix: interactions of T cells with dendritic cells are dynamic, short lived, and sequential. Immunity 2000; 13: 323–332. [DOI] [PubMed] [Google Scholar]
- Scholer A, Hugues S, Boissonnas A, Fetler L, Amigorena S. Intercellular adhesion molecule-1-dependent stable interactions between T cells and dendritic cells determine CD8(+) T cell memory. Immunity 2008; 28: 258–270. [DOI] [PubMed] [Google Scholar]
- Munitic I, Ryan PE, Ashwell JD. T cells in G1 provide a memory-like response to secondary stimulation. J Immunol 2005; 174: 4010–4018. [DOI] [PubMed] [Google Scholar]
- Faroudi M, Zaru R, Paulet P, Muller S, Valitutti S. Cutting edge: T lymphocyte activation by repeated immunological synapse formation and intermittent signaling. J Immunol 2003; 171: 1128–1132. [DOI] [PubMed] [Google Scholar]
- Das J, Ho M, Zikherman J, Govern C, Yang M, Weiss A et al. Digital signaling and hysteresis characterize ras activation in lymphoid cells. Cell 2009; 136: 337–351. [DOI] [PMC free article] [PubMed] [Google Scholar]
- Marangoni F, Murooka TT, Manzo T, Kim EY, Carrizosa E, Elpek NM et al. The transcription factor NFAT exhibits signal memory during serial T cell interactions with antigen-presenting cells. Immunity 2013; 38: 237–249. [DOI] [PMC free article] [PubMed] [Google Scholar]
- Clark CE, Hasan M, Bousso P. A role for the immediate early gene product c-fos in imprinting T cells with short-term memory for signal summation. PLoS ONE 2011; 6: e18916. [DOI] [PMC free article] [PubMed] [Google Scholar]
- Cahalan MD, Parker I. Choreography of cell motility and interaction dynamics imaged by two-photon microscopy in lymphoid organs. Annu Rev Immunol 2008; 26: 585–626. [DOI] [PMC free article] [PubMed] [Google Scholar]
- Bousso P. T-cell activation by dendritic cells in the lymph node: lessons from the movies. Nat Rev Immunol 2008; 8: 675–684. [DOI] [PubMed] [Google Scholar]
- Bogle G, Dunbar PR. Agent-based simulation of T-cell activation and proliferation within a lymph node. Immunol Cell Biol 2010; 88: 172–179. [DOI] [PubMed] [Google Scholar]
- Bogle G, Dunbar PR. On-lattice simulation of T cell motility, chemotaxis, and trafficking in the lymph node paracortex. PLoS ONE 2012; 7: e45258. [DOI] [PMC free article] [PubMed] [Google Scholar]
- Maxwell JR, Rossi RJ, McSorley SJ, Vella AT. T cell clonal conditioning: a phase occurring early after antigen presentation but before clonal expansion is impacted by Toll-like receptor stimulation. J Immunol 2004; 172: 248–259. [DOI] [PubMed] [Google Scholar]
- Mempel TR, Henrickson SE, Von Andrian UH. T-cell priming by dendritic cells in lymph nodes occurs in three distinct phases. Nature 2004; 427: 154–159. [DOI] [PubMed] [Google Scholar]
- Bousso P, Robey E. Dynamics of CD8+ T cell priming by dendritic cells in intact lymph nodes. Nat Immunol 2003; 4: 579–585. [DOI] [PubMed] [Google Scholar]
- Beltman JB, Maree AF, Lynch JN, Miller MJ, de Boer RJ. Lymph node topology dictates T cell migration behavior. J Exp Med 2007; 204: 771–780. [DOI] [PMC free article] [PubMed] [Google Scholar]
- Textor J, Henrickson SE, Mandl JN, von Andrian UH, Westermann J, de Boer RJ et al. Random migration and signal integration promote rapid and robust T cell recruitment. PLoS Comput Biol 2014; 10: e1003752. [DOI] [PMC free article] [PubMed] [Google Scholar]
- Vroomans RM, Maree AF, de Boer RJ, Beltman JB. Chemotactic migration of T cells towards dendritic cells promotes the detection of rare antigens. PLoS Comput Biol 2012; 8: e1002763. [DOI] [PMC free article] [PubMed] [Google Scholar]
- Celli S, Day M, Muller AJ, Molina-Paris C, Lythe G, Bousso P. How many dendritic cells are required to initiate a T-cell response? Blood 2012; 120: 3945–3948. [DOI] [PubMed] [Google Scholar]
- Harris TH, Banigan EJ, Christian DA, Konradt C, Tait Wojno ED, Norose K et al. Generalized Levy walks and the role of chemokines in migration of effector CD8+ T cells. Nature 2012; 486: 545–548. [DOI] [PMC free article] [PubMed] [Google Scholar]
- Zheng H, Jin B, Henrickson SE, Perelson AS, von Andrian UH, Chakraborty AK. How antigen quantity and quality determine T-cell decisions in lymphoid tissue. Mol Cell Biol 2008; 28: 4040–4051. [DOI] [PMC free article] [PubMed] [Google Scholar]
- Locasale JW. Computational investigations into the origins of short-term biochemical memory in T cell activation. PLoS ONE 2007; 2: e627. [DOI] [PMC free article] [PubMed] [Google Scholar]
- Catron DM, Itano AA, Pape KA, Mueller DL, Jenkins MK. Visualizing the first 50 hr of the primary immune response to a soluble antigen. Immunity 2004; 21: 341–347. [DOI] [PubMed] [Google Scholar]
- Gong C, Mattila JT, Miller M, Flynn JL, Linderman JJ, Kirschner D. Predicting lymph node output efficiency using systems biology. J Theor Biol 2013; 335: 169–184. [DOI] [PMC free article] [PubMed] [Google Scholar]
- Celli S, Garcia Z, Bousso P. CD4 T cells integrate signals delivered during successive DC encounters in vivo. J Exp Med 2005; 202: 1271–1278. [DOI] [PMC free article] [PubMed] [Google Scholar]
- Marchingo JM, Kan A, Sutherland RM, Duffy KR, Wellard CJ, Belz GT et al. T cell signaling. Antigen affinity, costimulation, and cytokine inputs sum linearly to amplify T cell expansion. Science 2014; 346: 1123–1127. [DOI] [PubMed] [Google Scholar]
- Bogle G, Dunbar PR. Simulating T-cell motility in the lymph node paracortex with a packed lattice geometry. Immunol Cell Biol 2008; 86: 676–687. [DOI] [PMC free article] [PubMed] [Google Scholar]
- Miller MJ, Safrina O, Parker I, Cahalan MD. Imaging the single cell dynamics of CD4+ T cell activation by dendritic cells in lymph nodes. J Exp Med 2004; 200: 847–856. [DOI] [PMC free article] [PubMed] [Google Scholar]
- Nopora A, Brocker T. Bcl-2 controls dendritic cell longevity in vivo. J Immunol 2002; 169: 3006–3014. [DOI] [PubMed] [Google Scholar]
- Yoon H, Kim TS, Braciale TJ. The cell cycle time of CD8+ T cells responding in vivo is controlled by the type of antigenic stimulus. PLoS ONE 2010; 5: e15423. [DOI] [PMC free article] [PubMed] [Google Scholar]
- Harndahl M, Rasmussen M, Roder G, Dalgaard Pedersen I, Sorensen M, Nielsen M et al. Peptide-MHC class I stability is a better predictor than peptide affinity of CTL immunogenicity. Eur J Immunol 2012; 42: 1405–1416. [DOI] [PubMed] [Google Scholar]
Associated Data
This section collects any data citations, data availability statements, or supplementary materials included in this article.


