

Our antibiotic arsenal is becoming depleted, in part, because bacteria have the ability to rapidly adapt and acquire resistance to our best agents. The SOS pathway, a widely conserved DNA damage stress response in bacteria, is activated by many antibiotics and has been shown to play central role in promoting survival and the evolution of resistance under antibiotic stress. As a result, targeting the SOS response has been proposed as an adjuvant strategy to revitalize our current antibiotic arsenal. However, the optimal molecular targets and partner antibiotics for such an approach remain unclear. In this study, focusing on the two key regulators of the SOS response, LexA and RecA, we provide the first comprehensive assessment of how to target the SOS response in order to increase bacterial susceptibility and reduce mutagenesis under antibiotic treatment.
KEYWORDS: DNA damage, LexA, RecA, SOS pathway, adjuvant therapy, antibiotic resistance, mutagenesis
ABSTRACT
The bacterial SOS response is a DNA damage repair network that is strongly implicated in both survival and acquired drug resistance under antimicrobial stress. The two SOS regulators, LexA and RecA, have therefore emerged as potential targets for adjuvant therapies aimed at combating resistance, although many open questions remain. For example, it is not well understood whether SOS hyperactivation is a viable therapeutic approach or whether LexA or RecA is a better target. Furthermore, it is important to determine which antimicrobials could serve as the best treatment partners with SOS-targeting adjuvants. Here we derived Escherichia coli strains that have mutations in either lexA or recA genes in order to cover the full spectrum of possible SOS activity levels. We then systematically analyzed a wide range of antimicrobials by comparing the mean inhibitory concentrations (MICs) and induced mutation rates for each drug-strain combination. We first show that significant changes in MICs are largely confined to DNA-damaging antibiotics, with strains containing a constitutively repressed SOS response impacted to a greater extent than hyperactivated strains. Second, antibiotic-induced mutation rates were suppressed when SOS activity was reduced, and this trend was observed across a wider spectrum of antibiotics. Finally, perturbing either LexA or RecA proved to be equally viable strategies for targeting the SOS response. Our work provides support for multiple adjuvant strategies, while also suggesting that the combination of an SOS inhibitor with a DNA-damaging antibiotic could offer the best potential for lowering MICs and decreasing acquired drug resistance.
IMPORTANCE Our antibiotic arsenal is becoming depleted, in part, because bacteria have the ability to rapidly adapt and acquire resistance to our best agents. The SOS pathway, a widely conserved DNA damage stress response in bacteria, is activated by many antibiotics and has been shown to play central role in promoting survival and the evolution of resistance under antibiotic stress. As a result, targeting the SOS response has been proposed as an adjuvant strategy to revitalize our current antibiotic arsenal. However, the optimal molecular targets and partner antibiotics for such an approach remain unclear. In this study, focusing on the two key regulators of the SOS response, LexA and RecA, we provide the first comprehensive assessment of how to target the SOS response in order to increase bacterial susceptibility and reduce mutagenesis under antibiotic treatment.
INTRODUCTION
The rapid rise of antibiotic resistance in bacterial pathogens is a major global health crisis. In the United States alone, resistant bacteria are associated with approximately 2 million infections and 23,000 deaths per year, with an economic burden upwards of $55 billion (1). In the past decade, the frequency of multidrug-resistant strains has rapidly risen, and even sensitive organisms are requiring higher MICs for effective therapy (2, 3). Efforts to address the problem of resistance have traditionally focused on modifying the scaffolds of existing antibiotics in order to circumvent the molecular mechanisms conferring resistance (4). While such efforts can offer a respite, resistance often rapidly follows, as existing resistance determinants adapt to the new agents (5). As a result, alternative strategies are being pursued, such as mining for previously inaccessible natural products, potentiating the host immune response, and targeting bacterial virulence pathways (6–10).
One of the new strategies proposed to combat resistance is to target the bacterial DNA damage stress response pathway, also known as the SOS response (11–14). The SOS response is a widely conserved DNA damage repair network that enables bacteria to survive genotoxic damage, but is also strongly associated with elevated mutagenesis and acquired resistance (15–17). The SOS pathway consists of a set of genes (SOS genes), which are defined to be under the control of the RecA and LexA proteins (18, 19). LexA is a dual-function repressor protease that blocks the transcription of the SOS genes in the absence of stress. When bacteria experience genotoxic stress, RecA, acting as a sensor molecule, polymerizes along exposed single-stranded DNA (ssDNA), forming activated nucleoprotein filaments (RecA*). RecA*, in turn, stimulates LexA to undergo autoproteolysis (self-cleavage), leading to the derepression of SOS effector genes.
The induced SOS effector genes can play roles in adaptation to antibiotic stress, acquired resistance, or pathogenicity. One such effector, sulA, encodes an inhibitor of cell division, which has been proposed to serve as a DNA damage checkpoint during the response (20). Other SOS effectors facilitate high-fidelity DNA damage repair, such as uvrA, which is involved in nucleotide excision repair (21), and recA itself, which participates in homologous recombination (22). However, under higher levels of damage, lower-fidelity processes emerge and can predominate in the response. Chief among these error-prone SOS effectors are umuDC and dinB, which encode translesion DNA polymerases that are able to replicate over genomic lesions, but do so at the expense of increased mutagenesis (17, 23). In addition, SOS activation has also been shown to trigger the expression of integrases that mediate transfer of resistance genes. On a phenotypic level, the response is also implicated in biofilm formation, induction of persister states, and expression of virulence factors (24–27). Thus, SOS activation serves to promote DNA damage tolerance and survival under genotoxic stress, while also increasing the likelihood of acquiring antibiotic resistance.
Many antibiotics trigger the SOS response, either directly through DNA damage (e.g., fluoroquinolones) or indirectly through alternative activation pathways (e.g., β-lactams) (28–30). Given its role in adaptation and acquired resistance, the SOS response has therefore been proposed as an attractive therapeutic target that might potentiate our current antibiotic arsenal. Various lines of genetic evidence support this possibility. Extensive historical studies have shown that mutations in recA and lexA can increase bacterial sensitivity to DNA-damaging agents such as UV radiation (31–33), and these findings also extend to medically relevant antibiotics. For example, in a murine thigh infection model, Cirz et al. demonstrated that inactivating LexA autoproteolysis reduces both the viability and acquired resistance of Escherichia coli treated with either ciprofloxacin or rifampin (12); likewise, Thi et al. showed that E. coli strains with recA deleted exhibit increased antibiotic sensitivity and reduced mutagenesis under a wide range of drug treatments (34).
The ramifications of hyperactivating the SOS response are less well understood, but could also offer potential therapeutic avenues. Early work on E. coli with a mutant lexA gene that resulted in a constitutive SOS activation showed heightened resistance to UV radiation and elevated mutation levels (35, 36). However, the effects of constitutive SOS activation on antibiotic susceptibility remain, to our knowledge, less well defined. Since the SOS response is part of a complex network of genes (37, 38), an overactive response could disrupt coordination of DNA damage repair and increase sensitivity to antimicrobials. Further, increased expression of some SOS effectors could enhance the effect of some antibiotics. For example, in E. coli and other bacterial species, deletion of the lexA gene is lethal to the cell, because constitutive expression of sulA permanently arrests cell division (20, 39). Additionally, a higher mutagenic burden associated with expression of error-prone SOS effectors could compromise fitness, analogous to lethal mutagenesis strategies utilized to combat some viruses (40).
Despite the strong genetic data implicating the SOS response as critical for survival and adaption of bacteria under stress, significant questions remain regarding targeting of the SOS response. What is the best strategy for perturbing the SOS regulatory network, and which antibiotics would serve as the best partners for SOS-targeting adjuvants? What is the relative viability of targeting RecA versus LexA? What are the implications of hyperactivating versus inhibiting the SOS pathway? To address these questions, we generated E. coli mutants that exhibit a spectrum of SOS activities, ranging from constitutively repressed to constitutively active (Fig. 1). These strains provided us with the tools to systematically measure bacterial susceptibility and induced mutation rates to different classes of antibiotics. Our comprehensive analysis offers guidance for strategies to combat drug resistance by targeting the SOS response.
FIG 1 .

Engineered lexA and recA variants in E. coli displaying a range of SOS activities. The LexA protein is represented by blue ovals, and the various LexA cleavage mutants are labeled in blue. RecA is shown as red ovals, and variants are labeled in red. Five LexA variants and two RecA variants allow for examination of the spectrum of SOS activation. Activated RecA filaments lead to cleavage of LexA and inducible expression of SOS genes in the WT strain. Inactivation of LexA self-cleavage (S119A) or deletion of recA (ΔrecA) inactivates the response. Mutations in the LexA protein can either decrease (G80A) or increase (E86P) the rate of self-cleavage relative to the WT strain and thus affect the level of SOS induction. Deletion of lexA (Delta) or hyperactivation of RecA (recA730) leads to constitutive expression of SOS genes.
RESULTS
Generation of recA and lexA mutant strains in E. coli.
While isolated studies using strains with inactivated lexA or deleted recA have validated the SOS pathway as a therapeutic target, a systematic comparison across the entire spectrum of SOS activity could help guide therapeutic strategies. Toward this goal, we derived a series of MG1655 E. coli strains that enabled us to systematically examine the consequences of altered SOS activity. We aimed to engineer strains with lexA variations that would span from a constitutively inactive to a constitutively active SOS response and also mimic the extreme phenotypes with alterations to recA (Fig. 1).
As deletion of lexA is lethal in sulA+ E. coli strains, we generated congenic strains in the ΔsulA background that only differ in the proficiency of the LexA protein to undergo self-cleavage. To access one extreme, the constitutively active SOS pathway, we first constructed a ΔlexA strain in the SulA-null background (defined as the Delta strain). This Delta strain was subsequently used as the parent for genetic recombineering at the lexA locus to yield four previously described LexA cleavage rate variants: a “hyperactive” E86P mutant, the reconstituted wild-type (WT) enzyme, a “hypoactive” G80A mutant, and finally the SOS-inactive S119A mutant, which is completely incompetent in self-cleavage (41, 42). The relative in vitro self-cleavage activities of these LexA variants were confirmed in biochemical assays, with G80A ~5-fold reduced and E86P ~10-fold enhanced relative to WT LexA and with S119A unable to self-cleave under both base- and RecA-mediated conditions (see Fig. S1 in the supplemental material). Together these five congenic strains provide the full spectrum of SOS activities, spanning from constitutively repressed (S119A) to constitutively active (Delta).
LexA mutants display a spectrum of cleavage activities. (A) Base-mediated cleavage activity of S119A (red), G80A (gray), WT (blue), and E86P (purple) LexA. The fraction of full-length protein remaining over time was fit to a first-order exponential decay, and the rate constant (k) was calculated. (B) RecA*-induced LexA cleavage. The left panel shows a RecA* titration cleavage assay of the mutants (0.3 µM 32P-labeled S119A, G80A, and WT LexA, and 2.5 µM of unlabeled E86P LexA). The right panel shows a reaction time course of the four mutants under 2.5 µM RecA* stimulation. The formation of free NTD (product) was monitored over time. The data symbol indicates the mean of 2 replicates, and the error bars denote the range of the observations. Download Figure S1, PDF file, 0.4 MB (399.1KB, pdf) .
Copyright © 2016 Mo et al.
This content is distributed under the terms of the Creative Commons Attribution 4.0 International license.
We also sought to simultaneously compare the effect of perturbing lexA with alterations to recA. For comparison to Delta, we generated a congenic strain containing the recA730 allele, which encodes a DNA recombination and coprotease-proficient RecA variant, the E38K strain, which forms nucleoprotein filaments in the absence of DNA damage and constitutively activates the SOS response through constant LexA cleavage (41, 43). For comparison to the S119A strain, we used a strain containing a recA deletion. Together, these recA mutants, along with the lexA mutants described above, are the main focus in our subsequent MIC, fitness, and mutagenesis experiments. However, we recognized that the sulA deletion in the Delta strain could in principle impact bacterial susceptibility and mutagenesis. We therefore also restored sulA in the S119A, G80A, and E86P variants to allow for comparison to the reference MG1655 strain (summarized in Table 1).
TABLE 1 .
List of E. coli strains used in this study
| Strain | Relevant genotype | Description | Source or reference |
|---|---|---|---|
| MG1655 | lexA+ sulA+ | Used as WT LexA and sulA+ control in MIC and fluctuation analyses | Yale E. coli Genetic Stock Center CGSC 7740 |
| JW0941 | ΔsulA::(FRT-kan-FRT) | Strain source of ΔsulA | Keio collection (70) |
| SAMP02 | MG1655 ΔsulA::FRT | Parent strain for ΔlexA strain | This study |
| JW3470 | ΔrecA::(FRT-kan-FRT) | Strain source of ΔrecA | Keio collection (70) |
| ΔrecA variant | MG1655 ΔrecA::FRT | Used as the recA knockout strain | This study |
| Delta variant (SAMP04) | MG1655 ΔlexA::(Cm-I-SceI) ΔsulA::FRT | Parent strain for recombineering; lexA knockout | This study |
| WT | MG1655 lexA+ ΔsulA::FRT | Strain with WT LexA cleavage | This study |
| S119A variant | MG1655 lexA(S119A) ΔsulA::FRT | Strain with catalytically inactive LexA | This study |
| G80A variant | MG1655 lexA(G80A) ΔsulA::FRT | Strain with slow-cleaving LexA | This study |
| E86P variant | MG1655 lexA(E86P) ΔsulA::FRT | Strain with fast-cleaving LexA | This study |
| SS4247 | TetR recA730 srlC300::Tn10 | Strain source of recA730 | Steven J. Sandler, unpublished |
| recA730 variant | MG1655 lexA+ ΔsulA recA730 TetR srlC300::Tn10 | Strain with WT LexA cleavage and constitutive RecA activity | This study |
| recA730(S119A) variant | MG1655 lexA(S119A) ΔsulA recA730 TetR srlC300::Tn10 | Strain with catalytically inactive LexA and constitutive RecA activity | This study |
| MMR102 | MG1655 sulA+ ΔtorT::(FRT-kan-FRT) | Strain source of sulA | Goulian lab stock |
| S119A (sulA+) variant | MG1655 lexA(S119A) sulA+ ΔtorT::FRT | Strain with inactive LexA and sulA | This study |
| G80A (sulA+) variant | MG1655 lexA(G80A) sulA+ ΔtorT::FRT | Strain with slow-cleaving LexA and sulA | This study |
| E86P (sulA+) variant | MG1655 lexA(E86P) sulA+ ΔtorT::FRT | Strain with fast-cleaving LexA and sulA | This study |
MICs of the mutant strains under various antibiotic stress.
With our spectrum of SOS variant strains established, we first aimed to survey their sensitivity to a broad range of different antimicrobials and DNA-damaging agents. We selected 12 drugs spanning different mechanistic classes and compared the resulting MIC for each drug-strain combination to that of the WT strain (Fig. 2; see Table S1 in the supplemental material). For mitomycin C, a DNA alkylator that is known to induce the SOS response through formation of intrastrand DNA cross-links, we observed 16-fold and 4-fold reductions of the MIC for the ΔrecA and S119A strains, respectively. We also observed reductions in the E86P, Delta, and recA730 strains to a lesser extent, indicating that SOS hyperactivation can also increase susceptibility to DNA damage. A similar trend in the MICs was observed with several antibiotics known to damage DNA and activate the SOS response. For the fluoroquinolones, which target DNA gyrase and induce double-stranded DNA breaks, treatment of the SOS-inactivating lexA and recA mutant strains with either ciprofloxacin or levofloxacin resulted in a ≥4-fold reduction in MIC, while the two SOS-constitutive mutants exhibited more modest decreases (between 2- and 4-fold). Finally, we observed similar susceptibility patterns with nitrofurantoin, which is associated with oxidative DNA damage (44). In comparing alterations to lexA versus recA, the sensitivities of recA730 and Delta were generally similar to one another, while ΔrecA had slightly enhanced sensitivity relative to the S119A strain. In particular, the ΔrecA strain exhibits a 32-fold reduction in MIC with nitrofurantoin, the greatest change in sensitivity across strains and antibiotics evaluated.
FIG 2 .
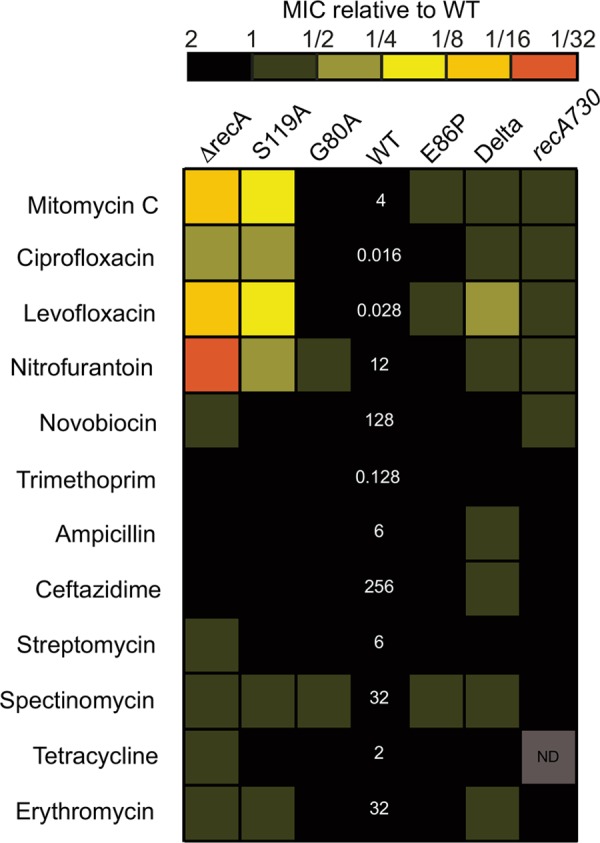
Heat map of relative MICs of different SOS variants with various antibiotics. The MIC values of the WT strain, shown in white numbers, are listed in micrograms per milliliter. MIC values represent the average from at least four independent determinations performed on separate days. “ND” represents a condition and strain in which the MIC was not determined. The raw MIC values of all strains are shown in Table S1 in the supplemental material.
MICs for drug-E. coli strain combinations. Download Table S1, PDF file, 0.1 MB (92.9KB, pdf) .
Copyright © 2016 Mo et al.
This content is distributed under the terms of the Creative Commons Attribution 4.0 International license.
For the remaining antibiotics tested, we saw more modest changes in susceptibility in the strains. With novobiocin, an agent that inhibits DNA gyrase without inducing double-stranded DNA (dsDNA) breaks (45, 46), sensitivity was generally unchanged, with the exception of a 2-fold reduction in the MIC of the ΔrecA strain. The novobiocin results suggest that the generation of dsDNA breaks by fluoroquinolines, and not gyrase inhibition alone, is needed for synergy with SOS perturbation. Although dihydrofolate reductase inhibitors, aminoglycosides, and β-lactams have been proposed to induce the SOS response, we observed ≤2-fold changes in MICs across strains. Similarly, with non-SOS-inducing antibiotics, the macrolide erythromycin, or aminoglycosides, we observed ≤2-fold changes in sensitivity at SOS extremes.
To determine whether the sulA deletion impacts the MIC differences, we examined antibiotic sensitivity with our corresponding sulA+ strains (which by necessity exclude the Delta and recA730 strains). For some antibiotics, such as levofloxacin and nitrofurantoin, the MIC of the WT (sulA+) strain was reduced compared to that of the WT (ΔsulA) strain. However, the trend in MIC reduction between the different sulA+ strains remained consistent with the trend in ΔsulA SOS variants (see Fig. S2 and Table S1 in the supplemental material). Thus, we conclude that sulA status may alter susceptibility for a given antibiotic, but this does not change the relative impact of perturbing SOS regulation.
MIC values for sulA-null and sulA+ strains. The left panel is a heat map of the sulA+ strains’ MICs relative to MG1655. The MIC values of the MG1655 strain are shown as white numbers in micrograms per milliliter. The right panel shows analogous data in the ΔsulA background, and shows a subset of the data from Fig. 2 in the main text. Download Figure S2, PDF file, 0.3 MB (357.6KB, pdf) .
Copyright © 2016 Mo et al.
This content is distributed under the terms of the Creative Commons Attribution 4.0 International license.
Impact of hypo- and hyperactive SOS variants on bacterial fitness.
In our MIC analysis, we noticed that only minor differences were evident between the G80A, WT, and E86P strains. We next wanted to ascertain if these intermediate SOS variants display any detectable changes in fitness to antibiotic-induced stress. We first confirmed that altering LexA cleavage activities perturbed levels of SOS induction in the predicted manner. To do this, we employed a green fluorescent protein (GFP) reporter plasmid in which gfp is placed under the control of the SOS-inducible recA promoter (47). We measured GFP fluorescence in each lexA variant strain in the presence of sublethal doses of mitomycin C, ciprofloxacin, or nitrofurantoin. The GFP fluorescence profiles of the strains correlated with the rate of self-cleavage for each LexA cleavage rate variant, thus confirming differences in extent of SOS activation across strains (see Fig. S3 in the supplemental material).
Bacterial SOS induction directly correlates with in vitro LexA cleavage rates. (A) GFP fluorescence normalized by optimal density of the lexA strains during a 180-min exposure to no stress or sublethal doses of ciprofloxacin, mitomycin C, and nitrofurantoin. The data are represented as the means from 3 independent measurements, and the error bars reflect the standard errors from the 3 replicates. (B) Mean GFP induction under mitomycin C, nitrofurantoin, and streptomycin stress after 16 h evaluated by flow cytometry. The data bars represent the averages from two independent measurements, and error bars denote the ranges of observed values. Download Figure S3, PDF file, 0.4 MB (453.7KB, pdf) .
Copyright © 2016 Mo et al.
This content is distributed under the terms of the Creative Commons Attribution 4.0 International license.
Although we did not detect large changes in MICs between the intermediate SOS variant strains, we considered whether these strains might have relative growth deficits compared to one another. To this end, we measured exponential growth in the presence or absence of sublethal antibiotic stress across all five strains (Fig. 3; see Fig. S4 in the supplemental material). In the absence of any antibiotic stress, all strains displayed similar growth rates. However, when the strains were treated with ciprofloxacin at sublethal levels, growth was significantly perturbed for the S119A and Delta strains, as expected. As ciprofloxacin approached the MIC, E86P had a reduction in growth rate, while G80A remained similar to the WT (Fig. 3A). For mitomycin C and nitrofurantoin, the S119A and Delta strains were again compromised, the G80A strain showed minor growth reductions, and the E86P strain remained similar to the WT (see Fig. S4).
FIG 3 .

Impact of lexA variants on cell growth under sublethal doses of stress. (A) Growth curves of the strains exposed to increasing, yet sublethal, levels of ciprofloxacin stress. The data are represented as the mean of 3 independent measurements, and the error bars reflect the standard errors of the 3 replicates. Growth curves under mitomycin C and nitrofurantoin stress are shown in Fig. S4 in the supplemental material. (B) Estimated fitness of the variant strains relative to the WT strain under different types of antibiotic stress. The mean fitness of each strain relative to the WT strain was calculated from 3 independent competition experiments. Error bars represent the standard errors from the three trials. For strains in which no colonies were detected for the variant strain, the top of the error bar represents the limit of detection. Significant P values are noted (*, <0.05; **, <0.005).
Growth curves of variant E. coli stains under mitomycin C and nitrofurantoin stress. The top panel is the same no-stress growth curve shown in Fig. 3. The data are represented as the means from 3 independent measurements, and the error bars reflect the standard errors from the 3 replicates. Download Figure S4, PDF file, 0.3 MB (361.2KB, pdf) .
Copyright © 2016 Mo et al.
This content is distributed under the terms of the Creative Commons Attribution 4.0 International license.
To directly compare the strains, we next performed pairwise fitness competitions between the WT and SOS variant strains (Fig. 3B). In the absence of antibiotics, there were no fitness defects observed in any competition experiments. In the presence of DNA-damaging antibiotics, the two extreme lexA variants, the S119A and Delta strains, had significantly reduced fitness, as expected given the MIC results. Specifically, in the presence of mitomycin C and ciprofloxacin, the wild-type strain entirely outcompeted both the S119A and Delta strains, with no colonies detected after growth. In the presence of nitrofurantoin, at the end of competition, there were no detectable colonies with the S119A strain, while the Delta strain showed a significant reduction in fitness. In contrast to the large fitness alterations observed with the S119A and Delta strains, we detected only small fitness defects for the intermediate strains relative to the WT strain, and the defect depended on the antimicrobial agent. With mitomycin C, we observed a statistically significant decrease in relative fitness for both the G80A and E86P strains. With ciprofloxacin, we observed a trend in favor of the WT over the variant strains that did not achieve statistical significance, while the levels of fitness of the G80A and E86P variants were similar to those of the WT in the presence of nitrofurantoin. Thus, we conclude that although MICs are generally unchanged for the intermediate SOS variant strains, partial reduction or enhancement of the SOS response could manifest as small changes in bacterial growth and fitness during antimicrobial stress.
Mutagenesis under antibiotic stress.
Aside from altering antibiotic sensitivity, perturbing the SOS response has been shown to alter the likelihood of acquired antibiotic resistance (12, 34). To address the impact of SOS inhibition or activation on mutagenesis, we next applied a fluctuation analysis protocol, which utilizes rifampin selection to examine the impact of antibiotic-induced stress on the mutation rates of the strains. Unlike mutation frequencies, which can be biased by growth rates and the overall size of a population, measurement of the mutation rate by fluctuation analysis allows for an unbiased assessment of the number of mutations per generation. After bacterial growth in the presence of the stressor antibiotic, the number of mutants that acquire resistance to rifampin are counted and compared to the total CFU. The use of an orthogonal antibiotic for selection of mutants enables the estimation of the overall mutation rate of the strain under the growth conditions.
In the absence of antimicrobial stress, all strains displayed similar mutation rates, aside from the two constitutive SOS mutants, the Delta and recA730 strains, which displayed approximately 7- and 20-fold more mutations per generation, respectively (Fig. 4A; see Table S2 in the supplemental material). When we introduced the noncleavable lexA(S119A) allele into the recA730 strain [recA730(S119A)], the mutation rate was reduced back to WT levels, validating that recA730 largely mediates mutagenesis in a LexA-dependent manner (see Fig. S5 in the supplemental material).
FIG 4 .

Impact of the SOS activities on E. coli mutation rates. (A) Mutation rates of strains grown under no stress or after exposure to sublethal doses of ciprofloxacin. Circles and squares represent the maximum likelihood mutation rate calculated from 6 replicate cultures, and the error bars represent the 95% confidence intervals. (B) Heat map of relative mutation rates across strains and antibiotic stressors. The heat map captures the reduction or increase in the mutation rate relative to the WT strain under that antibiotic. Values listed for the WT are the mutation rate (×10−9) per generation under each condition. Black boxes represent conditions where no resistant colonies could be detected. (C) Mutation rates of strains across a wide panel of antimicrobial agents. Data are the same as in panel B, with values shown to offer a complementary perspective for comparison between antibiotics. The squares represent individual mutation rates, and the black bars represent the mean of mutation rates under the conditions tested; error bars were removed for clarity and included in Fig. S5 in the supplemental material, with raw values listed in Table S2 in the supplemental material. Strains that did not show resistant colonies under a particular antibiotic stress are marked with an asterisk in the color of that antibiotic. The attributed values of the asterisked strain denote the mutation rate detection limit under those conditions and were excluded from the calculation of the mean mutation rate.
Mutation rate for drug-E. coli strain combinations. Download Table S2, PDF file, 0.1 MB (137.5KB, pdf) .
Copyright © 2016 Mo et al.
This content is distributed under the terms of the Creative Commons Attribution 4.0 International license.
Mutation rates of the lexA mutants and recA mutants under different types of antibiotic stress. In each plot, the stressed strains (color) are shown in comparison to the nonstressed control (black), which is the same across all conditions. Ciprofloxacin data are replicated from Fig. 4A to allow for ease of comparison. The symbol denotes the mean mutation rate, while the error bars span the 95% confidence interval derived from 6 independent measurements. Strains that did not show resistant colonies under a particular antibiotic stress are marked with an asterisk in the color of that antibiotic. The attributed value of the asterisked strain denotes the mutation rate detection limit under those conditions. Download Figure S5, PDF file, 0.5 MB (537.4KB, pdf) .
Copyright © 2016 Mo et al.
This content is distributed under the terms of the Creative Commons Attribution 4.0 International license.
Next, we subjected the SOS variant strains to sublethal doses of ciprofloxacin. In the absence of antibiotic stress, the WT strain displays a mutation rate of 3 × 10⁻⁹ per replicative generation. However, in the presence of ciprofloxacin, the mutation rate increases 7-fold. Across the other strains, we observed a pattern of changes to mutation rates that correlated with the LexA cleavage rates (Fig. 4A). Mutagenesis was not induced in the S119A strain, and the mutation rate increased only 1.3-fold for the hypoactive G80A strain relative to the unstressed condition. Compared to the 7-fold induction of mutagenesis in the WT strain, we observed an approximately 13-fold increase with the hyperactive E86P variant. Notably, even in the Delta strain, we found a 3-fold enhancement of mutation rate with ciprofloxacin, suggesting that mutagenesis is enhanced by the combination of antibiotic stress with a constitutively active SOS pathway. The ciprofloxacin-induced mutation rates were similar whether lexA or recA is perturbed on the two extremes: the ΔrecA and S119A strains showed mutation rates of 5 × 10⁻⁹ and 4 × 10⁻⁹, respectively, and the recA730 and Delta strains displayed rates of 6 × 10⁻⁸ and 7 × 10⁻⁸, respectively.
We then examined a broader range of antibiotic stressors and found that LexA cleavage rates impact mutation rates across many different antibiotic classes. For each variant strain, we plotted the mutation rate relative to the WT (Fig. 4B). For clarity, the individual mutation rate plots are also shown in Fig. S5 and the raw values are summarized in Table S2 in the supplemental material. Across most antibiotics examined, we generally observed that SOS attenuated strains have reduced mutation rates relative to the WT, while SOS hyperactive strains have higher mutation rates. The gradation of induced mutagenesis extended to mitomycin C, nitrofurantoin, β-lactams, and trimethoprim, but was less apparent with the ribosomal inhibitor streptomycin, which can potentially impact the translation of SOS effectors, and with novobiocin, which has been reported to potentially antagonize the SOS response (48). Integrating across the series of antibiotics with different mechanisms of action, the average rate of induced mutagenesis is correlated with increased levels of SOS activation (Fig. 4C). This trend contrasts with the MIC data, where MICs tended to peak with the WT strain and were reduced when the SOS pathway was either inactive or hyperactive.
Notably, the S119A and ΔrecA strains showed reductions in induced mutagenesis across multiple different agents beyond ciprofloxacin. With these strains, we were unable to select for rifampin-resistant mutants with mitomycin stress and observed 15-fold or greater reductions with nitrofurantoin and smaller reductions with ampicillin. This result indicates that inhibition of the SOS response could plausibly slow acquired drug resistance to multiple antimicrobial agents.
To account for the effects of the sulA deletion, we performed the same set of fluctuation analyses on the four sulA+ strains and compared mutation rates across strains (see Fig. S5 and Table S2 in the supplemental material). In the absence of antibiotic stress, the four strains displayed mutation rates comparable to that of the ΔsulA strains. While minor differences were observed in the extent of induced mutagenesis across strains, the trend of increasing mutation rate with increasing LexA cleavage rate was preserved within both the sulA+ and the ΔsulA background.
DISCUSSION
Given the role of the SOS pathway in adaptation and acquired resistance to antibiotics, targeting its two major regulators—LexA and RecA—has been proposed as a viable strategy to increase bacterial sensitivity to antibiotics and combat the rise of resistance. Prior studies examining antibiotic efficacy have largely focused on the loss of normal recA or lexA function in isolation (12, 34, 49–51). These studies validated the SOS response as an interesting target and motivated our effort to explore the consequences of the various different approaches that could be taken to target LexA or RecA proteins. To this end, our study attempted to profile the full spectrum of SOS activation, including parallel comparisons of partial or complete SOS activation or repression, to help provide a road map for several key issues relevant to future inhibitor discovery efforts.
Bacterial susceptibility to antibiotics.
Our study provides evidence that either inhibition or activation of the SOS pathway can synergize with specific antimicrobial agents to reduce MICs to various extents. With constitutive SOS inactivation, the MIC data of the S119A and ΔrecA mutants are in agreement with previous studies: relative to the WT, both strains show enhanced sensitivity to some DNA-damaging agents, such as mitomycin C, fluoroquinolones, and nitrofurantoin (34, 52, 53). However, this increased sensitivity is largely abolished when the level of SOS induction is merely attenuated by a slow-cleaving LexA variant, the G80A strain, which shows similar MIC and only minor defects in fitness competition relative to the WT. With antimicrobials with other mechanisms of action, we see only minor changes in sensitivity relative to the WT strain, even in the SOS-inactive S119A or ΔrecA strain. Thus, we conclude that potent inhibition of the SOS pathway in concert with particular DNA-damaging agents, including fluoroquinolones and nitrofurantoin, offers the best options for potential synergy.
Proposals to target the SOS response have largely focused on inhibiting the pathway, and to our knowledge, little data exists on how SOS overactivation affects bacterial sensitivity to antibiotics. In our study, we observed that, as with SOS-inhibited strains, strains with a constitutively active SOS response have decreased fitness relative to the wild-type strain. The reduced MICs of the Delta and recA730 strains suggest that an overactive SOS pathway can also increase antimicrobial susceptibility, albeit to a lesser extent than observed with constitutive inhibition. DNA-damaging agents that were effectively enhanced by SOS inhibition appear to achieve the highest levels of synergy in SOS overactive strains as well, while other drugs show lesser effects. One important caveat to our result is that we were unable to experimentally examine the effects of sulA-mediated lethality during constitutive SOS expression, given that the ΔlexA and recA730 strains require sulA deletion. Small molecules that disrupt LexA binding to SOS genes or activate RecA could potentially show greater synergy than we observed in the presence of sulA. Furthermore, even if resistance were to arise to SOS-hyperactivating agents through the deletion of sulA, our results with sulA-null strains suggest that synergy would still be anticipated to some degree.
Together our data indicate that the native function of the SOS pathway is important for bacterial adaptation to antibiotics. Both an inactivated SOS response and constitutively active SOS response can reduce bacterial viability in concert with antimicrobials that cause DNA damage. While our work does not address the mechanisms involved in altered antibiotic sensitivity, several plausible hypotheses can be considered. Because the SOS response functions primarily in DNA damage repair, perturbing the network likely prohibits bacteria from repairing the genotoxic damage caused by these agents: in the case of SOS inhibition, the DNA repair mechanisms are silenced, while with disinhibition, the processes might be uncoordinated, energetically costly, and/or promote genetic instability.
Bacterial mutagenesis during antibiotic treatment.
Our study also informs efforts to slow mutagenesis and acquired resistance by targeting the SOS pathway. While the most significant reductions in MICs were noted at both extremes of SOS activity, the mutation rates across strains displayed a trend of continual increase, with the constitutively inactive and active SOS variants showing the lowest and highest antibiotic-induced mutation rates, respectively. Our results with constitutively inactive and active variants are consistent with more limited comparisons carried out in previous reports (12, 49, 51, 54, 55). Furthermore, we show that partial SOS pathway attenuation (G80A) or hyperactivation (E86P) results in changes to the mutation rate. Our data are also consistent with a recent report that used a mutation accumulation whole-genome sequencing approach to show that the mutation rate is strongly correlated with the dose of fluoroquinolone stress, which presumably results in different levels of SOS induction (56). We speculate that the tunable behavior for mutagenesis could be due to the regulation of the error-prone DNA polymerases, whose basal levels and stress-induced levels are likely altered by changes to LexA and RecA protein levels. Importantly, from a therapeutic angle, our data suggest that reducing LexA’s cleavage rate has the potential to attenuate mutagenesis under a range of different types of antibiotic stressors, not simply DNA-damaging antibiotics. While our study focuses on inducible mutagenesis controlled by the SOS pathway, the results also hold implications for constitutive hypermutators, which may make important clinical contributions to acquired antibiotic resistance (57). Activation of the SOS pathway may provide a mechanism for acquiring mutations that “fix” hypermutation, such as inactivating mutations in mismatch repair enzymes (58).
Targeting LexA versus RecA.
Both RecA and LexA have been proposed as therapeutic targets to perturb SOS induction. While small molecules that target LexA have not yet been reported to our knowledge, several agents that target RecA both in vitro and in bacteria have been reported (59–63). Our results suggest that the effects of the SOS-inactive mutant (ΔrecA and S119A) strains largely mimic one another in both synergy and acquired resistance, although a slightly greater degree of sensitivity is seen with the ΔrecA strain, particularly with nitrofurantoin. Constitutive activation of the SOS pathway has similar effects in the Delta and recA730 strains, with a slight degree of higher sensitivity seen with the Delta strain. Overall, we conclude that agents that target LexA, RecA, or their interface would all be similarly viable strategies to pursue.
Although our data suggest targeting either RecA or LexA might be of interest, it is worth noting that each likely presents its own distinctive challenges. RecA, unlike LexA, has important human homologues (Rad51 family), making specificity a particularly important requirement for targeting RecA; indeed, some high-throughput screening efforts have yielded compounds that readily target both RecA and Rad51 (64). Although protein interfaces can be challenging to target, the RecA oligomerization interface may be a valuable molecular target, particularly since RecA’s ATPase activity is thought to be nonessential for SOS activities (65). For LexA, the self-cleavage reaction of the protein’s catalytic domain makes it a difficult target for competitive inhibition, given the high local concentration of the cleavage loop “substrate” around the LexA active site. We therefore speculate that allosteric inhibitors of LexA or compounds that disrupt the LexA-RecA interface will likely offer more promise. Finally, the selection pressures for acquired resistance might also be very different for these two targets. It is reassuring that deletion of the lexA gene is also associated with altered sensitivity to some antibiotics, as this result implies that resistance to anti-LexA agents is less likely to arise from simple inactivating mutations.
Strategies for targeting the SOS response.
In aggregate, our results provide a framework for developing strategies to target the SOS pathway. Regarding the question of whether to inhibit or hyperactivate the SOS response, in line with known aspects of SOS function, we suggest that inhibiting the pathway is the more feasible strategy, since it can reduce bacterial viability while also tempering stress-induced mutagenesis. Although forcing constitutive SOS induction does reduce fitness, it comes at a cost of increased mutagenesis, thus increasing the likelihood of acquired resistance. As noted, one limitation to our conclusion is that we were unable to explore the effects of SOS disinhibition in the presence of sulA; however, we speculate that sulA-dependent toxicity would likely lead to rapid inactivation of sulA, as its deletion does not appear to cause a strong fitness burden. With regard to the mechanism of action, our data suggest that reducing mutagenesis may offer more therapeutic opportunities with different classes of existing antibiotics. We found that numerous antibiotics can increase the mutation rate and that induced mutagenesis is decreased with loss of SOS induction. Even attenuation of the SOS pathway with the G80A strain is associated with reduced mutagenesis. While the effects on the mutation rate are modest relative to those of hypermutator strains of bacteria that lack mismatch repair, such strains with “intermediate” mutation rates may in fact be more likely to evolve multidrug resistance (66). It is also important to note that we limited our analysis to the effect on MIC and acquired resistance; however, it is possible that targeting the SOS pathway could have other benefits. In diverse species, including Clostridium difficile, Vibrio cholerae, and Staphylococcus aureus, the SOS pathway has been linked to pathogenic processes, including persistence, horizontal gene transfer, and expression of toxins or virulence factors (26, 27, 50, 67–69). Our data taken as a whole suggest that although many alternative strategies may be viable, the addition of an SOS inhibitor targeting RecA or LexA with a DNA-damaging antibiotic such as a fluoroquinolone could be an optimal approach to both increase susceptibility as well as decrease acquired resistance in important bacterial pathogens.
MATERIALS AND METHODS
Congenic strain generation.
The ΔrecA::(FRT-kan-FRT) and ΔsulA::(FRT-kan-FRT) E. coli strains (JW3470 and JW0941, respectively) were obtained from the Keio collection (70). (In each of these strains, “FRT” represents the flippase [Flp] recombination target.) The recA and sulA genes were deleted from MG1655 using T4GT7 bacteriophage transduction (71), or P1vir transduction (72), respectively, followed by Flp-mediated removal of the kan cassette using plasmid pCP-20 (73). The resulting ΔrecA strain (MG1655 ΔrecA::FRT) was subsequently used in experiments, while the ΔsulA strain (SAMP02 [MG1655 ΔsulA::FRT]) served as the parent for further genetic engineering at the lexA locus.
In the ΔsulA background of SAMP02, a ΔlexA::(Cm-I-SceI) cassette was introduced into the native lexA locus by recombineering, resulting in strain SAMP04 [MG1655 ΔlexA::(Cm-I-SceI) ΔsulA::FRT], which we refer to as the Delta strain. In brief, the chloramphenicol cassette and I-SceI restriction site were generated by PCR using the plasmid pWRG100 as the template. PCR primers have a 5′ region of homology to lexA, allowing for double recombination of the cassette. The Delta strain was used for recombineering-based scarless mutagenesis (74). Overlap extension was used to generate cassettes containing 1-kb regions upstream and downstream of the lexA gene, along with the desired lexA variant (the S119A, G80A, WT, and E86P strains) (75). These cassettes were transformed into the Delta strain, and counterselection yielded the desired transformants as previously described (74). These strains, which are all derivatives of the Delta strain containing the sulA deletion, will be referred to as the S119A, G80A, WT, and E86P strains. The recA730 allele was introduced into the S119A and WT strains by P1vir transduction using SS4247 as a donor strain followed by selection with tetracycline.
For experiments examining the effect of sulA deletion in our strains, we reengineered the sulA gene into the S119A, G80A, and E86P strains by transduction using a P1vir lysate derived from MMR102, which contains ΔtorT::(FRT-kan-FRT) at a locus neighboring sulA (72). The kan cassette was subsequently removed by Flp-mediated recombination using plasmid pCP20 (73) to yield strains S119A (sulA+), G80A (sulA+), and E86P (sulA+). For comparison to these sulA+ strains, we used MG1655 as a reference with native lexA.
All strains were confirmed by PCR and sequenced at relevant loci. Strain names and relevant genotypes are summarized in Table 1. Primer sequences or strains are available upon request.
Measuring the MIC of strains.
MICs were determined using a resazurin-based assay (76) using serial 2-fold dilutions of the drug and following previously published guidelines (77). The reported MICs represent the average of four independent measurements performed on separate days.
Measuring strain growth rates.
Overnight cultures of the strains were diluted 106-fold into fresh LB. One hundred microliters of diluted culture was distributed into a 96-well, round-bottom, transparent plate. One hundred microliters of LB with sublethal doses of antibiotic agent was then added to the cultures, and the plates were sealed with transparent tape. The cultures were incubated at 37°C with cycled agitation (3-mm orbital shaking, 450 rpm) for 16 h on a Tecan plate reader. Optical density at 595 nm (OD595) measurements were obtained every 30 min. We noted that these plate-based growth conditions result in an approximately 5% increase in doubling times compared to culture conditions with larger volumes in aerated 15-ml culture tubes (unpublished data). However, these conditions permit continuous measurement, and the results obtained parallel those from competition experiments (detailed below), which were performed under conditions with more significant aeration.
Competition experiments.
For the competition experiments, a constitutively active GFP expression plasmid, pMS pRev-GFP (see Text S1 in the supplemental material), was transformed into the WT strain using standard chemical transformation techniques. The same vector with constitutively repressed GFP expression (pMS pAra-GFP) was transformed into the four other variant strains. Competition assay procedures were adapted from established protocols (78). In brief, overnight cultures in LB containing kanamycin for plasmid maintenance were grown. The next morning, cocultures were started by inoculating 3 ml of LB containing kanamycin with equal amounts (106 dilutions) of the WT and a mutant strain in either the absence or presence of an additional antibiotic stressor. The coculture was then incubated at 37°C with aeration for 24 h. To determine the starting and final CFU of the strains, culture samples were taken before and after the 24-h growth period, plated onto LB agar (with kanamycin selection), and incubated overnight at 37°C. The next day, WT colonies on the plate were distinguished from the variant colonies by visualizing GFP fluorescence on a Bio-Rad GelDoc XR+ imager with UV illumination through an XcitaBlue conversion screen (Bio-Rad). Quantifying population numbers (N), we estimated the relative fitness (W) of the variant strain relative to the WT strain by calculating the change in the relative abundances between the initial (i) and final (f) samples (78):
When no rifampin-resistant colonies could be detected, we calculated the lower limit of detection by assuming one resistant colony was present and determining the mutation rate based on the CFU detected under those conditions. We used a two-sided paired t test to assess for statistical significance between the fitness of each variant strain compared to the WT strain and interpreted a P value of <0.05 as a significant difference.
Supplemental experimental procedures. Download Text S1, PDF file, 0.1 MB (112.2KB, pdf) .
Copyright © 2016 Mo et al.
This content is distributed under the terms of the Creative Commons Attribution 4.0 International license.
Fluctuation analysis of bacterial mutation rates.
Fluctuation analysis was performed using an adapted version of established protocols (79). Briefly, six replicate 30-ml cultures in LB (containing either no antibiotic or a sublethal level of antibiotic) were inoculated with a 3.3 × 10⁸ dilution of overnight LB broth culture. The concentration of antibiotic used in each case was a fixed level below the MIC (as provided in Table S2 in the supplemental material). The concentration of stressor antibiotic selected was the highest concentration that permitted sufficient viable CFU to allow for fluctuation analysis to be performed—typically 1.5- to 8-fold below the MIC. Cultures were grown to saturation at 37°C for 48 h. After 48 h, to determine the total CFU, appropriate dilutions were plated onto nonselective LB agar plates. To determine the number of mutant colonies, 300 µl of culture was separately spun down, washed with 100 µl of 5% NaCl solution, and plated onto 100 µg/ml of rifampin. The rifampin plates were incubated at 37°C for a total of 48 h; resistant colonies were counted once after 24 h and a second time after 48 h. The numbers of total cells and resistant colonies were then entered into the MutRateCalc software to perform maximum likelihood analysis, which yields the mutation rate and associated confidence intervals (79).
ACKNOWLEDGMENTS
We thank Jeffrey Faust (Wistar Institute) for help with the flow cytometry experiments, Mitra Eghbal (Penn Biology) for advice on fluctuation analysis, Kiran Gajula for help with the MIC determination, and other members of the Kohli laboratory for helpful discussions and comments. We also want to thank Steven Sandler (University of Massachusetts, Amherst) for generously providing bacterial strains.
This work was funded by the National Institutes of Health (New Innovator Award DP2-GM105444 to R.M.K., training support T32 GM7229 for C.Y.M., and T32 AR007442 for M.J.C.), the Edward J. Mallinckrodt, Jr., Foundation (Mallinckrodt Scholar Award to R.M.K.), and the Doris Duke Charitable Foundation (Clinical Scientist Development Award to R.M.K.).
The authors declare they have no conflicts of interest.
Funding Statement
The funders had no role in study design, data collection and interpretation, or the decision to submit the work for publication.
REFERENCES
- 1.Centers for Disease Control and Prevention 2013. Antibiotic resistance threats in the United States, 2013. Centers for Disease Control and Prevention, U.S. Department of Health and Human Services, Atlanta, GA. http://www.cdc.gov/drugresistance/pdf/ar-threats-2013-508.pdf. [Google Scholar]
- 2.Prabaker K, Weinstein RA. 2011. Trends in antimicrobial resistance in intensive care units in the United States. Curr Opin Crit Care 17:472–479. doi: 10.1097/MCC.0b013e32834a4b03. [DOI] [PubMed] [Google Scholar]
- 3.Centers for Disease Control and Prevention 2014. National Antimicrobial Resistance Monitoring System for Enteric Bacteria (NARMS): human isolates final report, 2012. Centers for Disease Control and Prevention, U. S. Department of Health and Human Services, Atlanta, GA: http://www.cdc.gov/narms/pdf/2012-annual-report-narms-508c.pdf. [Google Scholar]
- 4.Fischbach MA, Walsh CT. 2009. Antibiotics for emerging pathogens. Science 325:1089–1093. doi: 10.1126/science.1176667. [DOI] [PMC free article] [PubMed] [Google Scholar]
- 5.Walsh C. 2000. Molecular mechanisms that confer antibacterial drug resistance. Nature 406:775–781. doi: 10.1038/35021219. [DOI] [PubMed] [Google Scholar]
- 6.Hancock RE, Nijnik A, Philpott DJ. 2012. Modulating immunity as a therapy for bacterial infections. Nat Rev Microbiol 10:243–254. doi: 10.1038/nrmicro2745. [DOI] [PubMed] [Google Scholar]
- 7.Thaker MN, Wang W, Spanogiannopoulos P, Waglechner N, King AM, Medina R, Wright GD. 2013. Identifying producers of antibacterial compounds by screening for antibiotic resistance. Nat Biotechnol 31:922–927. doi: 10.1038/nbt.2685. [DOI] [PubMed] [Google Scholar]
- 8.Clatworthy AE, Pierson E, Hung DT. 2007. Targeting virulence: a new paradigm for antimicrobial therapy. Nat Chem Biol 3:541–548. doi: 10.1038/nchembio.2007.24. [DOI] [PubMed] [Google Scholar]
- 9.Donia MS, Cimermancic P, Schulze CJ, Wieland Brown LC, Martin J, Mitreva M, Clardy J, Linington RG, Fischbach MA. 2014. A systematic analysis of biosynthetic gene clusters in the human microbiome reveals a common family of antibiotics. Cell 158:1402–1414. doi: 10.1016/j.cell.2014.08.032. [DOI] [PMC free article] [PubMed] [Google Scholar]
- 10.Czaplewski L, Bax R, Clokie M, Dawson M, Fairhead H, Fischetti VA, Foster S, Gilmore BF, Hancock RE, Harper D, Henderson IR, Hilpert K, Jones BV, Kadioglu A, Knowles D, Ólafsdóttir S, Payne D, Projan S, Shaunak S, Silverman J, Thomas CM, Trust TJ, Warn P, Rex JH. 2016. Alternatives to antibiotics—a pipeline portfolio review. Lancet Infect Dis 16:239–251. doi: 10.1016/S1473-3099(15)00466-1. [DOI] [PubMed] [Google Scholar]
- 11.Culyba MJ, Mo CY, Kohli RM. 2015. Targets for combating the evolution of acquired antibiotic resistance. Biochemistry 54:3573–3582. doi: 10.1021/acs.biochem.5b00109. [DOI] [PMC free article] [PubMed] [Google Scholar]
- 12.Cirz RT, Chin JK, Andes DR, de Crécy-Lagard V, Craig WA, Romesberg FE. 2005. Inhibition of mutation and combating the evolution of antibiotic resistance. PLoS Biol 3:e00163-16. doi: 10.1371/journal.pbio.0030176. [DOI] [PMC free article] [PubMed] [Google Scholar]
- 13.Smith PA, Romesberg FE. 2007. Combating bacteria and drug resistance by inhibiting mechanisms of persistence and adaptation. Nat Chem Biol 3:549–556. doi: 10.1038/nchembio.2007.27. [DOI] [PubMed] [Google Scholar]
- 14.Blázquez J, Couce A, Rodríguez-Beltrán J, Rodríguez-Rojas A. 2012. Antimicrobials as promoters of genetic variation. Curr Opin Microbiol 15:561–569. doi: 10.1016/j.mib.2012.07.007. [DOI] [PubMed] [Google Scholar]
- 15.Michel B. 2005. After 30 years of study, the bacterial SOS response still surprises us. PLoS Biol 3:e00163-16. doi: 10.1371/journal.pbio.0030255. [DOI] [PMC free article] [PubMed] [Google Scholar]
- 16.Foster PL. 2007. Stress-induced mutagenesis in bacteria. Crit Rev Biochem Mol Biol 42:373–397. doi: 10.1080/10409230701648494. [DOI] [PMC free article] [PubMed] [Google Scholar]
- 17.Sutton MD, Smith BT, Godoy VG, Walker GC. 2000. The SOS response: recent insights into umuDC-dependent mutagenesis and DNA damage tolerance. Annu Rev Genet 34:479–497. doi: 10.1146/annurev.genet.34.1.479. [DOI] [PubMed] [Google Scholar]
- 18.Erill I, Campoy S, Barbé J. 2007. Aeons of distress: an evolutionary perspective on the bacterial SOS response. FEMS Microbiol Rev 31:637–656. doi: 10.1111/j.1574-6976.2007.00082.x. [DOI] [PubMed] [Google Scholar]
- 19.Fernández De Henestrosa AR, Ogi T, Aoyagi S, Chafin D, Hayes JJ, Ohmori H, Woodgate R. 2000. Identification of additional genes belonging to the LexA regulon in Escherichia coli. Mol Microbiol 35:1560–1572. [DOI] [PubMed] [Google Scholar]
- 20.Huisman O, D’Ari R. 1981. An inducible DNA replication-cell division coupling mechanism in E. coli. Nature 290:797–799. doi: 10.1038/290797a0. [DOI] [PubMed] [Google Scholar]
- 21.Kenyon CJ, Walker GC. 1981. Expression of the E. coli uvrA gene is inducible. Nature 289:808–810. doi: 10.1038/289808a0. [DOI] [PubMed] [Google Scholar]
- 22.Chen Z, Yang H, Pavletich NP. 2008. Mechanism of homologous recombination from the RecA-ssDNA/dsDNA structures. Nature 453:489–494. doi: 10.1038/nature06971. [DOI] [PubMed] [Google Scholar]
- 23.Tippin B, Pham P, Goodman MF. 2004. Error-prone replication for better or worse. Trends Microbiol 12:288–295. doi: 10.1016/j.tim.2004.04.004. [DOI] [PubMed] [Google Scholar]
- 24.Guerin E, Cambray G, Sanchez-Alberola N, Campoy S, Erill I, Da Re S, Gonzalez-Zorn B, Barbé J, Ploy MC, Mazel D. 2009. The SOS response controls integron recombination. Science 324:1034. doi: 10.1126/science.1172914. [DOI] [PubMed] [Google Scholar]
- 25.Gotoh H, Kasaraneni N, Devineni N, Dallo SF, Weitao T. 2010. SOS involvement in stress-inducible biofilm formation. Biofouling 26:603–611. doi: 10.1080/08927014.2010.501895. [DOI] [PubMed] [Google Scholar]
- 26.Dörr T, Vulić M, Lewis K. 2010. Ciprofloxacin causes persister formation by inducing the TisB toxin in Escherichia coli. PLoS Biol 8:e00163-16. doi: 10.1371/journal.pbio.1000317. [DOI] [PMC free article] [PubMed] [Google Scholar]
- 27.Ubeda C, Maiques E, Knecht E, Lasa I, Novick RP, Penadés JR. 2005. Antibiotic-induced SOS response promotes horizontal dissemination of pathogenicity island-encoded virulence factors in staphylococci. Mol Microbiol 56:836–844. doi: 10.1111/j.1365-2958.2005.04584.x. [DOI] [PubMed] [Google Scholar]
- 28.Maiques E, Ubeda C, Campoy S, Salvador N, Lasa I, Novick RP, Barbé J, Penadés JR. 2006. Beta-lactam antibiotics induce the SOS response and horizontal transfer of virulence factors in Staphylococcus aureus. J Bacteriol 188:2726–2729. doi: 10.1128/JB.188.7.2726-2729.2006. [DOI] [PMC free article] [PubMed] [Google Scholar]
- 29.Miller C, Thomsen LE, Gaggero C, Mosseri R, Ingmer H, Cohen SN. 2004. SOS response induction by beta-lactams and bacterial defense against antibiotic lethality. Science 305:1629–1631. doi: 10.1126/science.1101630. [DOI] [PubMed] [Google Scholar]
- 30.Kohanski MA, Dwyer DJ, Hayete B, Lawrence CA, Collins JJ. 2007. A common mechanism of cellular death induced by bactericidal antibiotics. Cell 130:797–810. doi: 10.1016/j.cell.2007.06.049. [DOI] [PubMed] [Google Scholar]
- 31.Mount DW, Low KB, Edmiston SJ. 1972. Dominant mutations (lex) in Escherichia coli K-12 which affect radiation sensitivity and frequency of ultraviolet light-induced mutations. J Bacteriol 112:886–893. [DOI] [PMC free article] [PubMed] [Google Scholar]
- 32.Witkin EM. 1976. Ultraviolet mutagenesis and inducible DNA repair in Escherichia coli. Bacteriol Rev 40:869–907. [DOI] [PMC free article] [PubMed] [Google Scholar]
- 33.Schlacher K, Goodman MF. 2007. Lessons from 50 years of SOS DNA-damage-induced mutagenesis. Nat Rev Mol Cell Biol 8:587–594. doi: 10.1038/nrm2198. [DOI] [PubMed] [Google Scholar]
- 34.Thi TD, López E, Rodríguez-Rojas A, Rodríguez-Beltrán J, Couce A, Guelfo JR, Castañeda-García A, Blázquez J. 2011. Effect of recA inactivation on mutagenesis of Escherichia coli exposed to sublethal concentrations of antimicrobials. J Antimicrob Chemother 66:531–538. doi: 10.1093/jac/dkq496. [DOI] [PubMed] [Google Scholar]
- 35.Mount DW. 1977. A mutant of Escherichia coli showing constitutive expression of the lysogenic induction and error-prone DNA repair pathways. Proc Natl Acad Sci U S A 74:300–304. doi: 10.1073/pnas.74.1.300. [DOI] [PMC free article] [PubMed] [Google Scholar]
- 36.Pacelli LZ, Edmiston SH, Mount DW. 1979. Isolation and characterization of amber mutations in the lexA gene of Escherichia coli K-12. J Bacteriol 137:568–573. [DOI] [PMC free article] [PubMed] [Google Scholar]
- 37.Al Mamun AA, Lombardo MJ, Shee C, Lisewski AM, Gonzalez C, Lin D, Nehring RB, Saint-Ruf C, Gibson JL, Frisch RL, Lichtarge O, Hastings PJ, Rosenberg SM. 2012. Identity and function of a large gene network underlying mutagenic repair of DNA breaks. Science 338:1344–1348. doi: 10.1126/science.1226683. [DOI] [PMC free article] [PubMed] [Google Scholar]
- 38.Courcelle J, Khodursky A, Peter B, Brown PO, Hanawalt PC. 2001. Comparative gene expression profiles following UV exposure in wild-type and SOS-deficient Escherichia coli. Genetics 158:41–64. [DOI] [PMC free article] [PubMed] [Google Scholar]
- 39.Huisman O, D’Ari R, Gottesman S. 1984. Cell-division control in Escherichia coli: specific induction of the SOS function SfiA protein is sufficient to block septation. Proc Natl Acad Sci U S A 81:4490–4494. doi: 10.1073/pnas.81.14.4490. [DOI] [PMC free article] [PubMed] [Google Scholar]
- 40.Loeb LA, Essigmann JM, Kazazi F, Zhang J, Rose KD, Mullins JI. 1999. Lethal mutagenesis of HIV with mutagenic nucleoside analogs. Proc Natl Acad Sci U S A 96:1492–1497. doi: 10.1073/pnas.96.4.1492. [DOI] [PMC free article] [PubMed] [Google Scholar]
- 41.Lin LL, Little JW. 1988. Isolation and characterization of noncleavable (Ind-) mutants of the LexA repressor of Escherichia coli K-12. J Bacteriol 170:2163–2173. [DOI] [PMC free article] [PubMed] [Google Scholar]
- 42.Mo CY, Birdwell LD, Kohli RM. 2014. Specificity determinants for autoproteolysis of LexA, a key regulator of bacterial SOS mutagenesis. Biochemistry 53:3158–3168. doi: 10.1021/bi500026e. [DOI] [PMC free article] [PubMed] [Google Scholar]
- 43.Witkin EM, McCall JO, Volkert MR, Wermundsen IE. 1982. Constitutive expression of SOS functions and modulation of mutagenesis resulting from resolution of genetic instability at or near the recA locus of Escherichia coli. Mol Gen Genet 185:43–50. doi: 10.1007/BF00333788. [DOI] [PubMed] [Google Scholar]
- 44.McOsker CC, Fitzpatrick PM. 1994. Nitrofurantoin: mechanism of action and implications for resistance development in common uropathogens. J Antimicrob Chemother 33(Suppl A):23–30. doi: 10.1093/jac/33.suppl_A.23. [DOI] [PubMed] [Google Scholar]
- 45.Sugino A, Higgins NP, Brown PO, Peebles CL, Cozzarelli NR. 1978. Energy coupling in DNA gyrase and the mechanism of action of novobiocin. Proc Natl Acad Sci U S A 75:4838–4842. doi: 10.1073/pnas.75.10.4838. [DOI] [PMC free article] [PubMed] [Google Scholar]
- 46.Gellert M, O’Dea MH, Itoh T, Tomizawa J. 1976. Novobiocin and coumermycin inhibit DNA supercoiling catalyzed by DNA gyrase. Proc Natl Acad Sci U S A 73:4474–4478. doi: 10.1073/pnas.73.12.4474. [DOI] [PMC free article] [PubMed] [Google Scholar]
- 47.Zaslaver A, Bren A, Ronen M, Itzkovitz S, Kikoin I, Shavit S, Liebermeister W, Surette MG, Alon U. 2006. A comprehensive library of fluorescent transcriptional reporters for Escherichia coli. Nat Methods 3:623–628. doi: 10.1038/nmeth895. [DOI] [PubMed] [Google Scholar]
- 48.Schröder W, Goerke C, Wolz C. 2013. Opposing effects of aminocoumarins and fluoroquinolones on the SOS response and adaptability in Staphylococcus aureus. J Antimicrob Chemother 68:529–538. doi: 10.1093/jac/dks456. [DOI] [PubMed] [Google Scholar]
- 49.Cirz RT, Jones MB, Gingles NA, Minogue TD, Jarrahi B, Peterson SN, Romesberg FE. 2007. Complete and SOS-mediated response of Staphylococcus aureus to the antibiotic ciprofloxacin. J Bacteriol 189:531–539. doi: 10.1128/JB.01464-06. [DOI] [PMC free article] [PubMed] [Google Scholar]
- 50.Baharoglu Z, Mazel D. 2011. Vibrio cholerae triggers SOS and mutagenesis in response to a wide range of antibiotics: a route towards multiresistance. Antimicrob Agents Chemother 55:2438–2441. doi: 10.1128/AAC.01549-10. [DOI] [PMC free article] [PubMed] [Google Scholar]
- 51.Cirz RT, Romesberg FE. 2006. Induction and inhibition of ciprofloxacin resistance-conferring mutations in hypermutator bacteria. Antimicrob Agents Chemother 50:220–225. doi: 10.1128/AAC.50.1.220-225.2006. [DOI] [PMC free article] [PubMed] [Google Scholar]
- 52.Da Re S, Garnier F, Guérin E, Campoy S, Denis F, Ploy MC. 2009. The SOS response promotes qnrB quinolone-resistance determinant expression. EMBO Rep 10:929–933. doi: 10.1038/embor.2009.99. [DOI] [PMC free article] [PubMed] [Google Scholar]
- 53.Butala M, Klose D, Hodnik V, Rems A, Podlesek Z, Klare JP, Anderluh G, Busby SJ, Steinhoff HJ, Zgur-Bertok D. 2011. Interconversion between bound and free conformations of LexA orchestrates the bacterial SOS response. Nucleic Acids Res 39:6546–6557. doi: 10.1093/nar/gkr265. [DOI] [PMC free article] [PubMed] [Google Scholar]
- 54.Fijalkowska IJ, Dunn RL, Schaaper RM. 1997. Genetic requirements and mutational specificity of the Escherichia coli SOS mutator activity. J Bacteriol 179:7435–7445. [DOI] [PMC free article] [PubMed] [Google Scholar]
- 55.Kohanski MA, DePristo MA, Collins JJ. 2010. Sublethal antibiotic treatment leads to multidrug resistance via radical-induced mutagenesis. Mol Cell 37:311–320. doi: 10.1016/j.molcel.2010.01.003. [DOI] [PMC free article] [PubMed] [Google Scholar]
- 56.Long H, Miller SF, Strauss C, Zhao C, Cheng L, Ye Z, Griffin K, Te R, Lee H, Chen CC, Lynch M. 2016. Antibiotic treatment enhances the genome-wide mutation rate of target cells. Proc Natl Acad Sci U S A 113:E2498–E2505. doi: 10.1073/pnas.1601208113. [DOI] [PMC free article] [PubMed] [Google Scholar]
- 57.Oliver A, Cantón R, Campo P, Baquero F, Blázquez J. 2000. High frequency of hypermutable Pseudomonas aeruginosa in cystic fibrosis lung infection. Science 288:1251–1254. doi: 10.1126/science.288.5469.1251. [DOI] [PubMed] [Google Scholar]
- 58.Mao EF, Lane L, Lee J, Miller JH. 1997. Proliferation of mutators in a cell population. J Bacteriol 179:417–422. [DOI] [PMC free article] [PubMed] [Google Scholar]
- 59.Sexton JZ, Wigle TJ, He Q, Hughes MA, Smith GR, Singleton SF, Williams AL, Yeh LA. 2010. Novel inhibitors of E. coli RecA ATPase activity. Curr Chem Genomics 4:34–42. doi: 10.2174/1875397301004010034. [DOI] [PMC free article] [PubMed] [Google Scholar]
- 60.Wigle TJ, Sexton JZ, Gromova AV, Hadimani MB, Hughes MA, Smith GR, Yeh LA, Singleton SF. 2009. Inhibitors of RecA activity discovered by high-throughput screening: cell-permeable small molecules attenuate the SOS response in Escherichia coli. J Biomol Screen 14:1092–1101. doi: 10.1177/1087057109342126. [DOI] [PMC free article] [PubMed] [Google Scholar]
- 61.Wigle TJ, Lee AM, Singleton SF. 2006. Conformationally selective binding of nucleotide analogues to Escherichia coli RecA: a ligand-based analysis of the RecA ATP binding site. Biochemistry 45:4502–4513. doi: 10.1021/bi052298h. [DOI] [PubMed] [Google Scholar]
- 62.Nautiyal A, Patil KN, Muniyappa K. 2014. Suramin is a potent and selective inhibitor of Mycobacterium tuberculosis RecA protein and the SOS response: RecA as a potential target for antibacterial drug discovery. J Antimicrob Chemother 69:1834–1843. doi: 10.1093/jac/dku080. [DOI] [PubMed] [Google Scholar]
- 63.Alam MK, Alhhazmi A, DeCoteau JF, Luo Y, Geyer CR. 2016. RecA inhibitors potentiate antibiotic activity and block evolution of antibiotic resistance. Cell Chem Biol 23:381–391. doi: 10.1016/j.chembiol.2016.02.010. [DOI] [PubMed] [Google Scholar]
- 64.Huang F, Motlekar NA, Burgwin CM, Napper AD, Diamond SL, Mazin AV. 2011. Identification of specific inhibitors of human Rad51 recombinase using high-throughput screening. ACS Chem Biol 6:628–635. doi: 10.1021/cb100428c. [DOI] [PMC free article] [PubMed] [Google Scholar]
- 65.Gruenig MC, Renzette N, Long E, Chitteni-Pattu S, Inman RB, Cox MM, Sandler SJ. 2008. RecA-mediated SOS induction requires an extended filament conformation but no ATP hydrolysis. Mol Microbiol 69:1165–1179. doi: 10.1111/j.1365-2958.2008.06341.x. [DOI] [PMC free article] [PubMed] [Google Scholar]
- 66.Denamur E, Tenaillon O, Deschamps C, Skurnik D, Ronco E, Gaillard JL, Picard B, Branger C, Matic I. 2005. Intermediate mutation frequencies favor evolution of multidrug resistance in Escherichia coli. Genetics 171:825–827. doi: 10.1534/genetics.105.045526. [DOI] [PMC free article] [PubMed] [Google Scholar]
- 67.Walter BM, Cartman ST, Minton NP, Butala M, Rupnik M. 2015. The SOS response master regulator LexA is associated with sporulation, motility and biofilm formation in Clostridium difficile. PLoS One 10:e00163-16. doi: 10.1371/journal.pone.0144763. [DOI] [PMC free article] [PubMed] [Google Scholar]
- 68.Dörr T, Lewis K, Vulić M. 2009. SOS response induces persistence to fluoroquinolones in Escherichia coli. PLoS Genet 5:e00163-16. doi: 10.1371/journal.pgen.1000760. [DOI] [PMC free article] [PubMed] [Google Scholar]
- 69.Modi SR, Lee HH, Spina CS, Collins JJ. 2013. Antibiotic treatment expands the resistance reservoir and ecological network of the phage metagenome. Nature 499:219–222. doi: 10.1038/nature12212. [DOI] [PMC free article] [PubMed] [Google Scholar]
- 70.Baba T, Ara T, Hasegawa M, Takai Y, Okumura Y, Baba M, Datsenko KA, Tomita M, Wanner BL, Mori H. 2006. Construction of Escherichia coli K-12 in-frame, single-gene knockout mutants: the Keio collection. Mol Syst Biol 2:2006.0008. doi: 10.1038/msb4100050. [DOI] [PMC free article] [PubMed] [Google Scholar]
- 71.Plakidou S, Moffat KG, Salmond GP, Mackinnon G. 1984. Convenient transduction of recA with bacteriophage T4GT7. J Bacteriol 159:1072–1073. [DOI] [PMC free article] [PubMed] [Google Scholar]
- 72.Miller JH. 1992. A short course in bacterial genetics: a laboratory manual and handbook for Escherichia coli and related bacteria. Cold Spring Harbor Laboratory Press, Plainview, NY. [Google Scholar]
- 73.Datsenko KA, Wanner BL. 2000. One-step inactivation of chromosomal genes in Escherichia coli K-12 using PCR products. Proc Natl Acad Sci U S A 97:6640–6645. doi: 10.1073/pnas.120163297. [DOI] [PMC free article] [PubMed] [Google Scholar]
- 74.Blank K, Hensel M, Gerlach RG. 2011. Rapid and highly efficient method for scarless mutagenesis within the Salmonella enterica chromosome. PLoS One 6:e00163-16. doi: 10.1371/journal.pone.0015763. [DOI] [PMC free article] [PubMed] [Google Scholar]
- 75.Heckman KL, Pease LR. 2007. Gene splicing and mutagenesis by PCR-driven overlap extension. Nat Protoc 2:924–932. doi: 10.1038/nprot.2007.132. [DOI] [PubMed] [Google Scholar]
- 76.Sarker SD, Nahar L, Kumarasamy Y. 2007. Microtitre plate-based antibacterial assay incorporating resazurin as an indicator of cell growth, and its application in the in vitro antibacterial screening of phytochemicals. Methods 42:321–324. doi: 10.1016/j.ymeth.2007.01.006. [DOI] [PMC free article] [PubMed] [Google Scholar]
- 77.Clinical and Laboratory Standards Institute 2006. Methods for dilution antimicrobial susceptibility tests for bacteria that grow aerobically; approved standard M7-A7, 7th ed Clinical and Laboratory Standards Institute, Wayne, PA. [Google Scholar]
- 78.Lenski RE, Rose MR, Simpson SC, Tadler SC. 1991. Long-term experimental evolution in Escherichia coli. I. Adaptation and divergence during 2,000 generations. Am Nat 138:1315–1341. doi: 10.1086/285289. [DOI] [Google Scholar]
- 79.Gerrish P. 2008. A simple formula for obtaining markedly improved mutation rate estimates. Genetics 180:1773–1778. doi: 10.1534/genetics.108.091777. [DOI] [PMC free article] [PubMed] [Google Scholar]
Associated Data
This section collects any data citations, data availability statements, or supplementary materials included in this article.
Supplementary Materials
LexA mutants display a spectrum of cleavage activities. (A) Base-mediated cleavage activity of S119A (red), G80A (gray), WT (blue), and E86P (purple) LexA. The fraction of full-length protein remaining over time was fit to a first-order exponential decay, and the rate constant (k) was calculated. (B) RecA*-induced LexA cleavage. The left panel shows a RecA* titration cleavage assay of the mutants (0.3 µM 32P-labeled S119A, G80A, and WT LexA, and 2.5 µM of unlabeled E86P LexA). The right panel shows a reaction time course of the four mutants under 2.5 µM RecA* stimulation. The formation of free NTD (product) was monitored over time. The data symbol indicates the mean of 2 replicates, and the error bars denote the range of the observations. Download Figure S1, PDF file, 0.4 MB (399.1KB, pdf) .
Copyright © 2016 Mo et al.
This content is distributed under the terms of the Creative Commons Attribution 4.0 International license.
MICs for drug-E. coli strain combinations. Download Table S1, PDF file, 0.1 MB (92.9KB, pdf) .
Copyright © 2016 Mo et al.
This content is distributed under the terms of the Creative Commons Attribution 4.0 International license.
MIC values for sulA-null and sulA+ strains. The left panel is a heat map of the sulA+ strains’ MICs relative to MG1655. The MIC values of the MG1655 strain are shown as white numbers in micrograms per milliliter. The right panel shows analogous data in the ΔsulA background, and shows a subset of the data from Fig. 2 in the main text. Download Figure S2, PDF file, 0.3 MB (357.6KB, pdf) .
Copyright © 2016 Mo et al.
This content is distributed under the terms of the Creative Commons Attribution 4.0 International license.
Bacterial SOS induction directly correlates with in vitro LexA cleavage rates. (A) GFP fluorescence normalized by optimal density of the lexA strains during a 180-min exposure to no stress or sublethal doses of ciprofloxacin, mitomycin C, and nitrofurantoin. The data are represented as the means from 3 independent measurements, and the error bars reflect the standard errors from the 3 replicates. (B) Mean GFP induction under mitomycin C, nitrofurantoin, and streptomycin stress after 16 h evaluated by flow cytometry. The data bars represent the averages from two independent measurements, and error bars denote the ranges of observed values. Download Figure S3, PDF file, 0.4 MB (453.7KB, pdf) .
Copyright © 2016 Mo et al.
This content is distributed under the terms of the Creative Commons Attribution 4.0 International license.
Growth curves of variant E. coli stains under mitomycin C and nitrofurantoin stress. The top panel is the same no-stress growth curve shown in Fig. 3. The data are represented as the means from 3 independent measurements, and the error bars reflect the standard errors from the 3 replicates. Download Figure S4, PDF file, 0.3 MB (361.2KB, pdf) .
Copyright © 2016 Mo et al.
This content is distributed under the terms of the Creative Commons Attribution 4.0 International license.
Mutation rate for drug-E. coli strain combinations. Download Table S2, PDF file, 0.1 MB (137.5KB, pdf) .
Copyright © 2016 Mo et al.
This content is distributed under the terms of the Creative Commons Attribution 4.0 International license.
Mutation rates of the lexA mutants and recA mutants under different types of antibiotic stress. In each plot, the stressed strains (color) are shown in comparison to the nonstressed control (black), which is the same across all conditions. Ciprofloxacin data are replicated from Fig. 4A to allow for ease of comparison. The symbol denotes the mean mutation rate, while the error bars span the 95% confidence interval derived from 6 independent measurements. Strains that did not show resistant colonies under a particular antibiotic stress are marked with an asterisk in the color of that antibiotic. The attributed value of the asterisked strain denotes the mutation rate detection limit under those conditions. Download Figure S5, PDF file, 0.5 MB (537.4KB, pdf) .
Copyright © 2016 Mo et al.
This content is distributed under the terms of the Creative Commons Attribution 4.0 International license.
Supplemental experimental procedures. Download Text S1, PDF file, 0.1 MB (112.2KB, pdf) .
Copyright © 2016 Mo et al.
This content is distributed under the terms of the Creative Commons Attribution 4.0 International license.