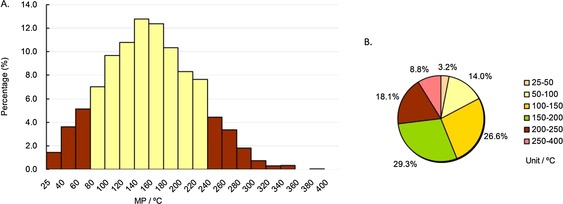
Figure 4.

MP distributions of all drugs in our approved‐drug database. Column diagram (A), pie chart (B). Temperature ranges include the higher value but not the lower value, except for 25–40 °C and 25–50 °C, which include both (e.g., 40–60 °C contains 60 °C, but not 40 °C).
