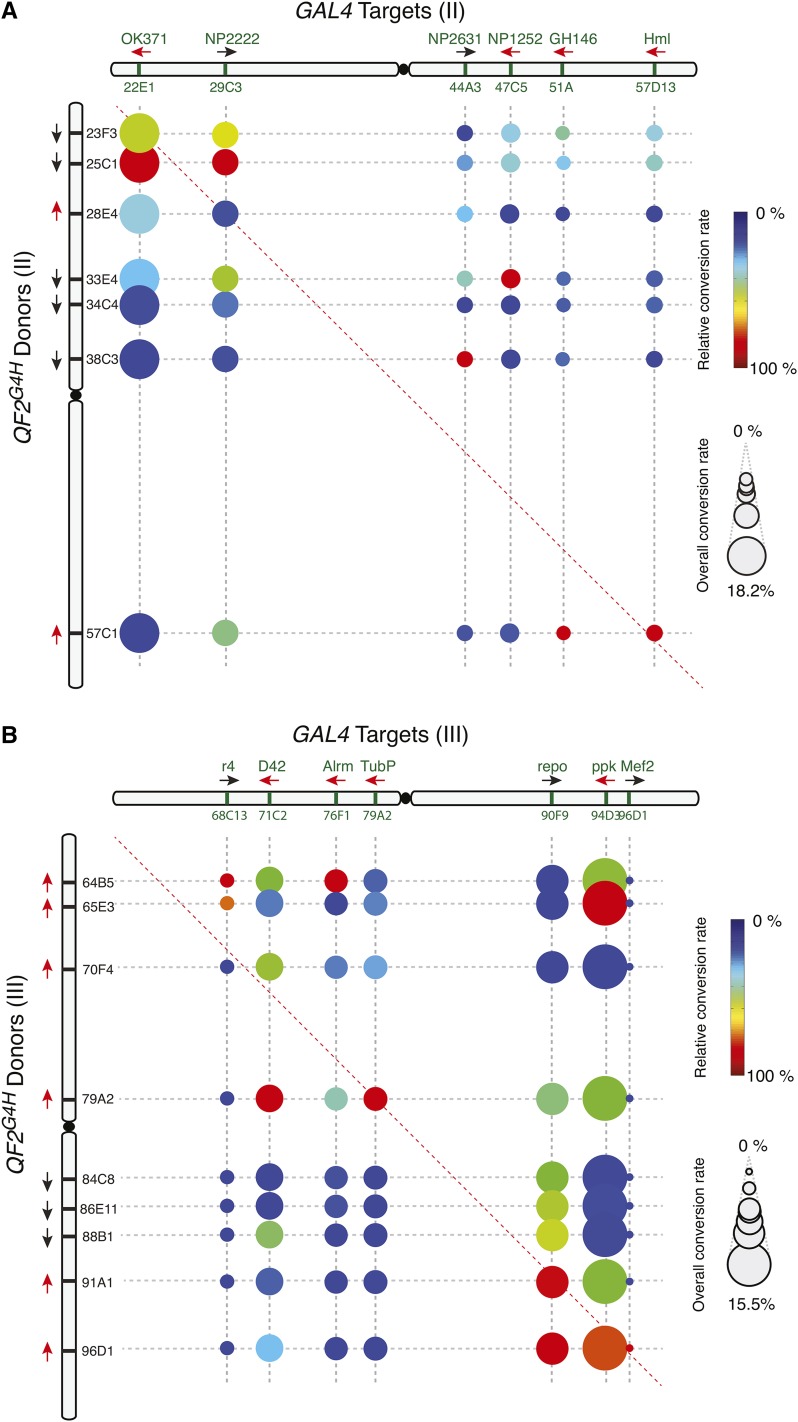
Figure 4.
HACK efficiencies across the second and third chromosome. (A–B) Conversion frequencies were tested for each donor and target pair on the (A) second or (B) third chromosome. The size of the circle represents the overall conversion rate of the target GAL4 line to all tested donor lines. Larger circles represent target GAL4 sites that were easier to convert (hot spots), while smaller circles represent target GAL4 sites that demonstrated low conversions (cold spots). For example, 18.2% of all F2 progeny of crosses from OK371-GAL4 and all seven second chromosome donors demonstrated conversions. The color indicates the relative conversion rate of the donor normalized to the highest conversion rate for the corresponding GAL4 lines. Thus colors indicate which donor line is most efficient for driving QF2G4H HACK conversions for a particular GAL4 line. For example, for OK371-GAL4, QF2G4H donor at 25C1 was the most effective (relative conversion rate 100%), and QF2G4H at 23F3 roughly two-thirds as effective (relative conversion rate 67%). Black and red arrows indicate the inserted transgene is in the forward and reverse orientation, respectively, relative to the reference Drosophila genome (Flybase R6.10).

