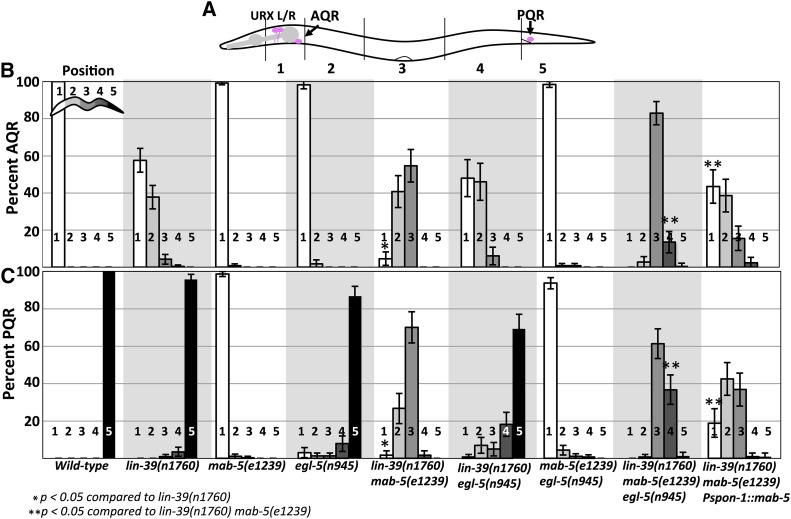
Figure 2.
AQR and PQR migration defects in lin-39, mab-5, and egl-5. (A) Schematic of an animal with scoring zones indicated (see Materials and Methods). The wild-type positions of AQR (position 1) and PQR (position 5) are indicated. (B and C) Percent of AQR and PQR residing at each position in adult animals as visualized by lqIs58[Pgcy-32::cfp]. Error bars represent 2× standard error of the proportion. Fisher’s exact test was used to determine significance of difference. Genotypes with the Pspon-1::mab-5 transgene represent combined results from two independently derived arrays with similar effects.

