Abstract
Objective
A large number of cases are needed in the patient-specific modeling of intracranial aneurysms to establish the statistical significance due to individual variation of risk factors that are difficult to account for. However, these risk factors are critical in hemorrhage risk as demonstrated in large clinical studies. Rupture risks for aneurysms in an individual are easier to compare because these aneurysms are under the same physiological environment, and their only differences are the local hemodynamic factors associated with their anatomic locations.
Methods
Eight small aneurysms (< 7 mm) from one individual were analyzed using patient-specific hemodynamic modeling. Four scenarios with different perfusion assumptions were performed to account for the flow rate at two smaller communicating arteries. Wall shear stresses (WSS) at these aneurysms were compared to determine their relationship with the aneurysm size.
Results
Each of the three largest aneurysms is either the most proximal or distal aneurysm in a given artery so that blood pressure does not have a direct influence on aneurysm size. No wall shear stress-derived hemodynamic variables are found to be related to aneurysm size.
Discussion
A study of multiple aneurysms from one individual offers a unique opportunity to examine various hemodynamic factors without selection biases. Aneurysms greater than 4 mm (Group 1) have a higher product of maximum WSS and area of low WSS; aneurysms smaller than 4 mm (Group 2) have a lower product of maximum WSS and area of low WSS. In addition, aneurysm size is linearly correlated with the flow rate at the parent artery in each group.
Keywords: aneurysms, hemodynamics, circle of willis
Introduction
Hemodynamics plays an important role in the formation, growth, and rupture of intracranial aneurysms [1-3]. Patient-specific aneurysm modeling allows us to assess the hemodynamic influences on rupture risk of aneurysms that cannot be accomplished in simplified idealized geometry [4], and results of these analyses permit an examination of various hypotheses on the role of wall shear stress (WSS) in the formation, growth, and rupture of aneurysms [5]. A hemodynamic analysis of growing aneurysms can reveal the conditions that predispose aneurysms for growth [6]; a comparison of hemodynamic variables between ruptured and unruptured aneurysms provides an insight on the level and pattern of WSS leading to rupture [7-8]. Castro, et al. showed a greater maximum WSS in ruptured aneurysms [9-10]; however, Boussel, et al. observed a lower WSS at the region where aneurysms grew [11]. Other hemodynamic variables have also been studied [8, 12-13].
There has been no consensus on whether the low or high WSS contributes to aneurysm rupture despite international collaboration and considerable improvement of numerical techniques. To fully examine a hypothesis, a large number of cases is needed to avoid selection biases [10, 12]. In addition, any conclusion from a study is valid only from a statistical viewpoint and does not apply to two aneurysms on different individuals because the hemodynamics could be outweighed by other risk factors [14-16]. For example, smoking and hypertension could raise the rupture risk of an individual considerably and compromise the validity of a hemodynamic study. A comparison of bilateral mirrored aneurysms is less biased [17-18], but these aneurysms are not frequently encountered and are often limited to certain anatomic locations.
Multiple aneurysms exist in approximately 25% of patients with intracranial aneurysms [19-20]. Multiplicity raises the risk of subarachnoid hemorrhage; treatment of one aneurysm may also trigger a de novo aneurysm elsewhere [21] or lead to bleeding of another aneurysm. Therefore, understanding of the relative risk of each aneurysm in an individual with multiple aneurysms is critical for aneurysm management and treatment. Eight small aneurysms of various sizes (< 7 mm) were incidentally discovered in one individual, and these aneurysms were located at almost every anatomical location where aneurysms are often expected [22]. We seek to evaluate hemodynamic variables and relate these variables to their aneurysm sizes because the anatomical location is the only factor that distinguishes these aneurysms from each other.
Materials and methods
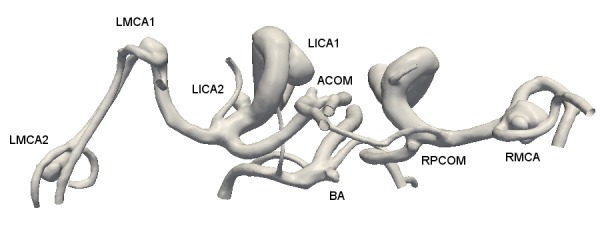
A 72-year-old female was identified incidentally with eight small unruptured intracranial aneurysms during MRI workup for dizziness. She was hypertensive and a lifetime smoker with no previous family history of subarachnoid hemorrhage. Her aneurysms ranged from 1.9 to 6.3 mm. in size. Two were located on the left internal carotid artery (ICA), two on the left middle cerebral artery (MCA), one at the tip of the basilar artery (BA), one at the anterior communicating artery (ACOM), one on the right posterior communicating artery (PCOM), and a multi-lobulated aneurysm at the right MCA bifurcation. The three largest aneurysms were successfully embolized by flow diverters without incidents.
The 3D rotational angiographic images were obtained by a Siemens AXIOM Artis imaging system (Siemens, Erlangen, Germany), and these images were co-registered together to form the circle of Willis. The subject did not have a complete circle of Willis due to the lack of the right posterior cerebral artery (PCA). The combined images then were processed by Volview (Kitware, Inc., Clifton Park, New York) to create a geometric model beginning from the ICAs and the BA to the distal branches that included all eight aneurysms (Figure 1). The entire model had three flow inlets and 13 outflow branches. The model was further broken down into three smaller parts by removing both the right anterior cerebral artery (ACA) and left PCOM. Each part was analyzed individually and together for the purpose of validation.
Figure 1. Anatomy of the circle of Willis of the subject and her eight aneurysms.
Numerical simulations
The geometric model was meshed by the ANSYS ICEM CFD and flow simulations performed by ANSYS Fluent (ANSYS, Canonsburg, PA). In each of these three smaller models, there was only one major artery for inflow (an ICA or BA). The purpose of smaller models was to evaluate whether the flow was properly resolved in the larger system that demanded a longer computational time and complicated consideration for cerebral blood flow distribution. Each of the three smaller models had 8-11 million cells, and the final system for the entire circle of Willis had 13 million cells after testing for grid independence.
Distribution of cerebral blood flow
Because of the numbers of outflow branches and inflow arteries, the following assumptions on the boundary conditions were made. The anterior cerebral circulation was equally distributed between the left and right hemispheres. The ratio of the anterior to posterior cerebral circulation was assumed to be 3:1 [23]; this ratio was based on the physiological flow rates measurements at the ICAs and vertebral arteries (VA) [24]. Thus, the entire model included three territories: one for the posterior circulation, one for the right anterior circulation, and one for the left anterior circulation; blood flows for these territories remained at constant ratios with a total mean cerebral circulation of 12 ml/s [23]. The flow rates at outflow branches were adjusted to achieve a target perfusion rate in each territory.
The flow rate at each branch was adjusted so that flow rates at the outlets met the minimum work principle [25]. Due to hypoplasia of the right PCA, the region that was originally perfused by the right PCA received blood flow from the right PCOM so that the total blood flow to the posterior territory remained the same, but the flow rate at the right ICA was increased accordingly. Flow rates at the two smallest vessels (the left PCOM and right ACA) were adjusted independently.
The flow rates at the ICAs and BA were specified so that each territory maintained a predetermined flow rate described earlier. A waveform measured at the ICA from another female patient using a phase contrast MRA was prescribed at all three inlets, but the waveform at each inlet was adjusted so that the mean flow rate at each region met the perfusion requirement.
Data analysis
Aneurysms were organized into two separate groups based on their sizes; three largest aneurysms in Group 1 (> 4 mm and < 6.6 mm) and the other five aneurysms for Group 2 (< 4 mm and > 1.5 mm). In each group, the size range was approximately 2.5 mm. An aneurysm was often referred as tiny when it was less than 4 mm or small when it was between 4 and 10 mm. The time-averaged wall shear stress (TAWSS) and area of low wall shear stress (ALWS) were calculated for each aneurysm. The threshold of the low WSS was set to be 0.4 Pa (pascal) based on an early report [26]. The oscillatory shear index (OSI) was also calculated, along with other variables to distinguish these aneurysms. Each hemodynamic variable (flow rate, TAWSS, ALWS, OSI, etc.) was correlated with aneurysm size by linear regression.
The protocol was approved by a local human subject research committee at our hospital (H-28651) before commencement. Informed patient consent was obtained prior to treatment.
Results
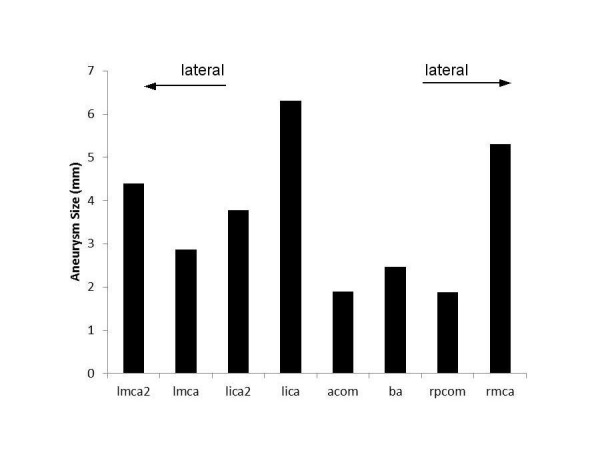
Each of the three largest aneurysms (left ICA1, right MCA, and left MCA2) is either the most proximal or distal aneurysm in a given vessel (Figure 2), and smaller aneurysms are located between them. Since these aneurysms are in the same individual and the distal aneurysms should have a blood pressure approximately 20 mmHg lower than the proximal aneurysms, blood pressure is not found to be related to aneurysm size and higher blood pressure does not lead to a larger aneurysm.
Figure 2. Size distribution of eight aneurysms.
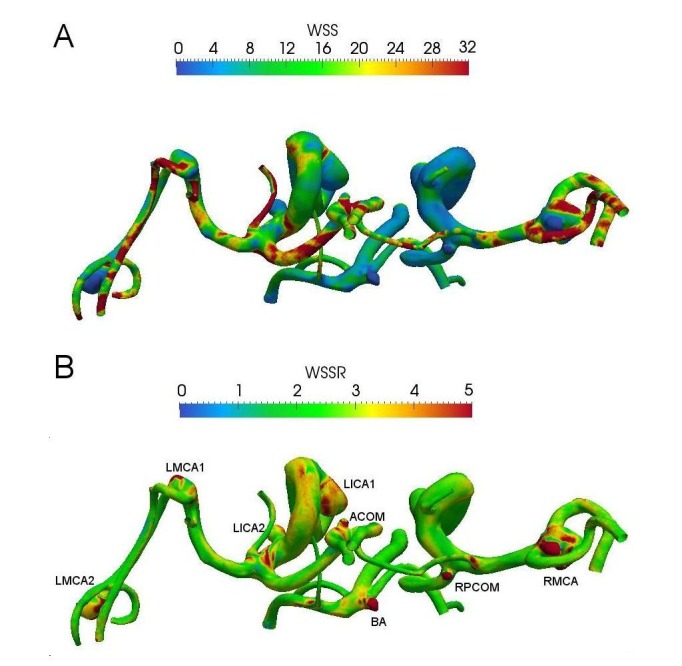
The TAWSS distribution on the wall is shown in Figure 3A where the maximum TAWSS is found to be at the neck for all aneurysms. The WSS pulsatility (WSSR) is defined as the ratio of the systolic WSS to the diastolic WSS (Figure 3B). The WSSRs at these aneurysms are greater than two, a result of either a greater WSS at the systole or a lower WSS at the diastole. There is no correlation between aneurysm size and the OSI as well.
Figure 3. A superoinferior view of WSS distribution for these aneurysms. (A) TAWSS and (B) WSSR (=WSSsystole/WSSdiastole). WSSR represents the level of WSS pulsatility within a cycle.
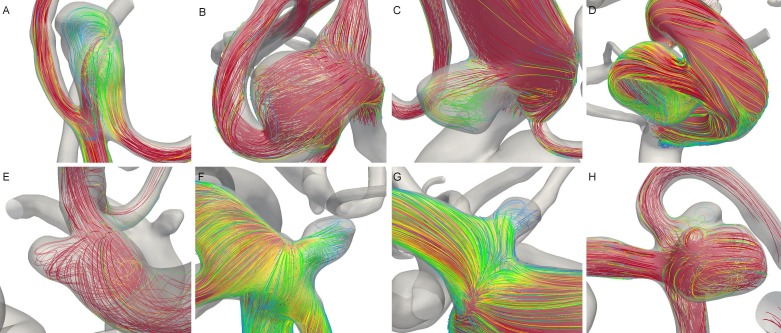
Intra-aneurysmal flow patterns at the systole for these aneurysms are presented in Figure 4. Two aneurysms at the left ICA exhibit the typical flow pattern in a saccular aneurysm (C and D), while the other aneurysms are terminal aneurysms. A direct flow impingement at the dome is observed only for the LMCA2 (A) and occasionally at the LMCA1 (B). These flow patterns could not explain the difference in aneurysm size as flow impingement occurs only at the distal left MCA aneurysms.
Figure 4. Streamlines at peak systole in these aneurysms. (A) LMCA2, (B) LMCA1, (C) LICA2, (D), LICA1, (E) ACOM, (F) BA, (G) RPCOM, and (H) RMCA.
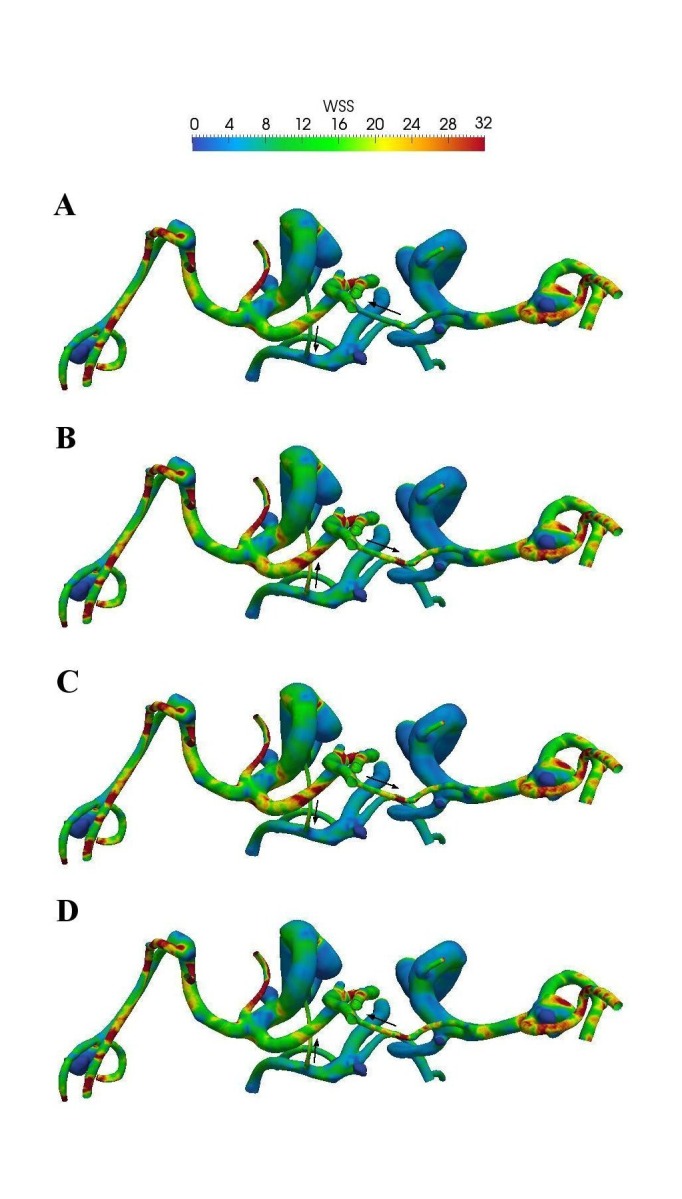
Because of the uncertainty of flow direction at the two smallest arteries that divide cerebral territories (the left PCOM and right ACA), four different scenarios are investigated. Figure 5 presents the TAWSS distributions at four different scenarios by altering flow directions at these small arteries. The change of flow direction at these vessels influences the flow rates at the inlets, but the TAWSS at the aneurysms is not significantly different when the flow directions are altered because these two arteries are much smaller than other vessels and carry little blood flow. Changes of the TAWSS are noticeable only for the proximal aneurysm at the left ICA and the aneurysm at the BA; the distal aneurysms are not affected. These changes are likely results of varying flow rates at the inlets and are not associated with aneurysm size.
Figure 5. TAWSS distribution based on four different scenarios at two smallest arteries that separate three cerebral territories. Flow directions are indicated by arrows.
The size ratio, a ratio of aneurysm size to the parent artery diameter, was found to be related to aneurysm rupture by Meng, et al. [12, 27], and ruptured aneurysms have an average size ratio of 4 versus 2.5 for unruptured aneurysms. In our study, aneurysms in Group 2 have a size ratio between 0.8 and 1.3, and the largest aneurysm in Group 1 has a size ratio of 2.7. However, the size ratio decreases with aneurysm size in Group 1, so the size ratio is not positively correlated with aneurysm size; the narrow size range of our aneurysms is probably responsible for this observation. Nevertheless, Group 1 does have a greater size ratio than Group 2.
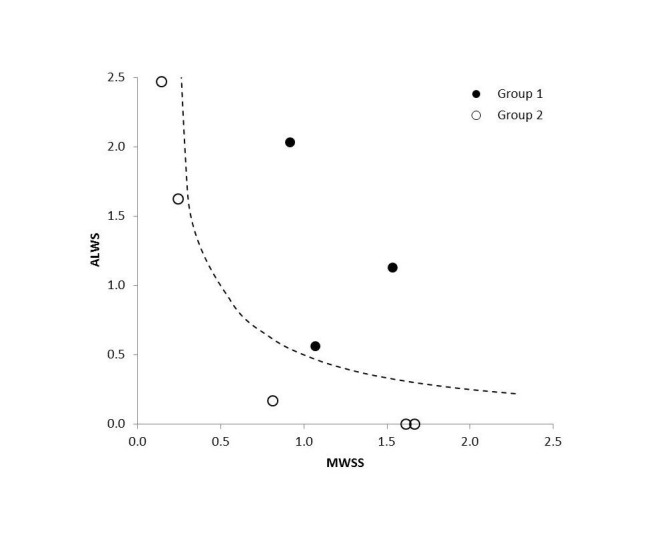
Figure 6 shows a map of the maximum TAWSS and ALWS for these aneurysms. These two variables have been normalized by their average values. The scaling of WSS permits a direct comparison because these two variables have different physical units and physiological meanings. Aneurysms in Group 1 have higher products of MWSS and ALWS (> 0.5), and aneurysms in Group 2 have lower products of these two hemodynamic variables (< 0.25).
Figure 6. The MWSS versus ALWS. A dashed line (MWSS * ALWS =0.5) separates two groups.
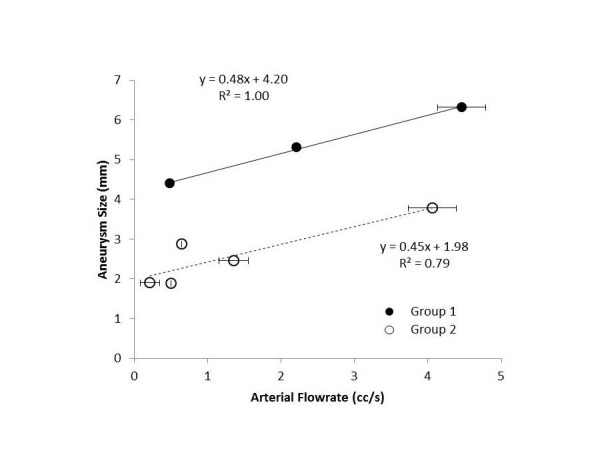
A comparison between aneurysm size and flow rate at the parent artery is shown in Figure 7. A higher flow rate at the parent artery does not necessarily lead to a greater MWSS. Data for each group are fitted into a straight line, and these two lines have comparable slopes, indicating a similar influence of flow rate on aneurysm size. In each group, larger aneurysms have higher flow rates at the parent artery, and smaller aneurysms are associated with lower flow rates. This agrees with an observation in an animal study that an aneurysm-like insult was induced by an increase of flow rate [28].
Figure 7. The mean flow rate at the parent artery versus the aneurysm size. The error bars indicate the range of flow rates considered in Figure 5.
Discussion
Our study focuses on a unique case where all aneurysms share the same risk factors except for anatomic location. While certain risk factors may have predisposed this patient for aneurysm formation, these risk factors would apply to every aneurysm equally. They differ only in the anatomic location and hemodynamic environment associated with the anatomy, and this is very different from a study for a number of patients in which each aneurysm is subject to a combination of risk factors. Results of our comparison, however, would be difficult to duplicate in studies of aneurysms from a large group of patients. Our approach, nevertheless, is similar to studies of bilateral mirrored aneurysms that compared two aneurysms at a similar anatomic location in the same individual [17-18]. Instead, our study explores the anatomical effect on aneurysm development.
The current study examines the relationship between hemodynamics and aneurysm size so the results should not be confused with the hemodynamic difference between ruptured and unruptured aneurysms. Aneurysms have different levels of TAWSS based on their anatomical locations [29], and two aneurysms with the same level of TAWSS, but at two different locations, are not subject to same rupture risk. Since aneurysms in our study appear at various cerebral arteries, it is not surprising that neither MWSS nor ALWS is correlated with aneurysm size. Chen, et al. found that the TAWSS is the highest for the MCA aneurysms, followed by aneurysms at the ICA, BA, and ACOM [29]; we observed three MCA aneurysms, two ICA aneurysms, a 2.5 mm BA aneurysm, and a 2 mm ACOM aneurysm so the artery with a higher TAWSS does have more aneurysms. The International Study of Unruptured Intracranial Aneurysms (ISUIA) showed that the most prevalent aneurysm locations are the MCA and ICA [22], consistent with our observation in terms of the number of aneurysms at each location.
Our study also reconciles the controversy about the role of WSS on aneurysm rupture [5, 9, 12, 26]. Aneurysms in Group 1 have both a higher MWSS and greater ALWS, but one of these two variables is very low for aneurysms in Group 2. Thus, the concepts of MWSS and ALWS are not mutually exclusive [30]. A higher MWSS does not automatically imply a low ALWS; the theory of high WSS damaging the endothelial cells lining the vessel wall does not contradict with the hypothesis that a vessel wall is weakened by low WSS, and nor does the low WSS hypothesis undermine the impact of high MWSS. It is possible that both factors (MWSS and ALWS) need to be at a certain level to trigger the growth of an aneurysm, and these levels may require special flow patterns previously observed in other studies [9, 30].
There are two possible explanations for the disparity of the group behaviors in Figure 7. First, if all aneurysms form at the same time, then aneurysms in Group 1 grow much faster than those in Group 2. Second, if aneurysms in Group 1 form earlier than those in Group 2 and all aneurysms grow at the same rate, then these two groups differ only in the time of development. Namely, these two groups either have two different growth rates or are at two developmental stages. Aneurysms in Group 1 are either “older” or “growing faster”. In either scenario, aneurysms are influenced by the flow rate at the parent artery, and a higher flow rate in each group creates a larger aneurysm. The slope in Figure 7 then represents the influence of blood flow. Suppose the growth rate is an indication of rupture risk, then aneurysms in Group 1 have comparable risks, even though they are of different sizes. This demonstrates that rupture risk is multifactorial and not a function of one single anatomic or hemodynamic variable, and we cannot rely on aneurysm size or any single variable for assessment of rupture risk.
Our study is limited by the number of patients presented at our clinic who had a sufficient number of aneurysms. While nearly 30% of aneurysm patients have multiple aneurysms, it is rare for a patient to harbor eight aneurysms and for these aneurysms to be located far enough to represent every possible anatomic location. The majority of patients with multiple aneurysms (> 5) at our institution have most aneurysms at a single artery or near each other, which precludes us from examining the range of flow rate that we have observed in this study. A comparison of aneurysms from different individuals without in vivo measurement of blood flow likely will not be fair.
From examining eight aneurysms in one individual, we have found that there is no single hemodynamic variable that is correlated with aneurysm size. Evaluating rupture risk based on the WSS or any single hemodynamic factor alone is likely to lead to a disappointing result. This highlights the complexity of aneurysm development. Our patient-specific modeling requires certain assumptions, and some assumptions, such as Newtonian fluid and rigid wall, are typical for numerical simulations of this kind. The specified flow rates at the inlets and flow rate ratios at outlets may influence our results. The proposed cerebral perfusion rate for each territory is based on the data from normal volunteers and differs from those of aneurysm patients. However, we have investigated four different scenarios so our observation remains valid despite assumptions of various perfusion rates.
Conclusions
Multiple aneurysms in one individual behave similarly to those observed in larger studies on the natural history of cerebral aneurysms, and the difference is that these aneurysms from one individual are subject to the same risk factors, rather than a wide array of inherent and acquired risk factors. Not a single hemodynamic variable based on the WSS is found to correlate with aneurysm size. However, the flow rate at the parent artery is linearly correlated with aneurysm size in both groups. Aneurysms in these two groups also differ in their WSS distribution, with a higher MWSS and greater ALWS for larger aneurysms.
The content published in Cureus is the result of clinical experience and/or research by independent individuals or organizations. Cureus is not responsible for the scientific accuracy or reliability of data or conclusions published herein. All content published within Cureus is intended only for educational, research and reference purposes. Additionally, articles published within Cureus should not be deemed a suitable substitute for the advice of a qualified health care professional. Do not disregard or avoid professional medical advice due to content published within Cureus.
The authors have declared that no competing interests exist.
Human Ethics
The protocol was approved by a local human subject research committee at our hospital. issued approval H-28651
Animal Ethics
Animal subjects: This study did not involve animal subjects or tissue.
References
- 1.Suggested connections between risk factors of intracranial aneurysms: A review. Cebral JR, Raschi M. Ann Biomed Eng. 2013;41:1366–1383. doi: 10.1007/s10439-012-0723-0. [DOI] [PMC free article] [PubMed] [Google Scholar]
- 2.High wall shear stress and spatial gradients in vascular pathology: A review. Dolan JM, Kolega J, Meng H. Ann Biomed Eng. 2013;41:1411–1427. doi: 10.1007/s10439-012-0695-0. [DOI] [PMC free article] [PubMed] [Google Scholar]
- 3.Physical factors effecting cerebral aneurysm pathophysiology. Sadasivan C, Fiorella DJ, Woo HH, Lieber BB. Ann Biomed Eng. 2013;41:1347–1365. doi: 10.1007/s10439-013-0800-z. [DOI] [PMC free article] [PubMed] [Google Scholar]
- 4.Image-based computational simulation of flow dynamics in a giant intracranial aneurysm. Steinman DA, Milner JS, Norley CJ, Lownie SP, Holdsworth DW. http://www.ajnr.org/content/24/4/559.full. AJNR Am J Neuroradiol. 2003;24:559–566. [PMC free article] [PubMed] [Google Scholar]
- 5.Hemodynamics of cerebral aneurysms. Sforza DM, Putman CM, Cebral JR. Annu Rev Fluid Mech. 2009;41:91–107. doi: 10.1146/annurev.fluid.40.111406.102126. [DOI] [PMC free article] [PubMed] [Google Scholar]
- 6.Wall shear stress distribution inside growing cerebral aneurysm. Tanoue T, Tateshima S, Villablanca JP, Viñuela F, Tanishita K. AJNR Am J Neuroradiol. 2011;32:1732–1737. doi: 10.3174/ajnr.A2607. [DOI] [PMC free article] [PubMed] [Google Scholar]
- 7.Distinctive flow pattern of wall shear stress and oscillatory shear index: similarity and dissimilarity in ruptured and unruptured cerebral aneurysm blebs. Kawaguchi T, Nishimura S, Kanamori M, Takazawa H, Omodaka S, Sato K, Maeda N, Yokoyama Y, Midorikawa H, Sasaki T, Nishijima M. J Neurosurg. 2012;117:774–780. doi: 10.3171/2012.7.JNS111991. [DOI] [PubMed] [Google Scholar]
- 8.Hemodynamic differences between unruptured and ruptured intracranial aneurysms during observation. Takao H, Murayama Y, Otsuka S, Qian Y, Mohamed A, Masuda S, Yamamoto M, Abe T. Stroke. 2012;43:1436–1439. doi: 10.1161/STROKEAHA.111.640995. [DOI] [PubMed] [Google Scholar]
- 9.Hemodynamics and rupture of terminal cerebral aneurysms. Castro M, Putman C, Radaelli A, Frangi A, Cebral J. Acad Radiol. 2009;16:1201–1207. doi: 10.1016/j.acra.2009.03.022. [DOI] [PubMed] [Google Scholar]
- 10.Quantitative characterization of the hemodynamic environment in ruptured and unruptured brain aneurysms. Cebral JR, Mut F, Weir J, Putman C. AJNR Am J Neuroradiol. 2011;32:145–151. doi: 10.3174/ajnr.A2419. [DOI] [PMC free article] [PubMed] [Google Scholar]
- 11.Aneurysm growth occurs at region of low wall shear stress: patient-specific correlation of hemodynamics and growth in a longitudinal study. Boussel L, Rayz V, McCulloch C, Martin A, Acevedo-Bolton G, Lawton M, Higashida R, Smith WS, Young WL, Saloner D. Stroke. 2008;39:2997–3002. doi: 10.1161/STROKEAHA.108.521617. [DOI] [PMC free article] [PubMed] [Google Scholar]
- 12.Hemodynamic-morphologic discriminants for intracranial aneurysm rupture. Xiang J, Natarajan SK, Tremmel M, Ma D, Mocco J, Hopkins LN, Siddiqui AH, Levy EI, Meng H. Stroke. 2011;42:144–152. doi: 10.1161/STROKEAHA.110.592923. [DOI] [PMC free article] [PubMed] [Google Scholar]
- 13.Aneurysm inflow-angle as a discriminant for rupture in sidewall cerebral aneurysms: morphometric and computational fluid dynamic analysis. Baharoglu MI, Schirmer CM, Hoit DA, Gao BL, Malek AM. Stroke. 2010;41:1423–1430. doi: 10.1161/STROKEAHA.109.570770. [DOI] [PubMed] [Google Scholar]
- 14.Factors affecting formation and growth of intracranial aneurysms: a long-term follow-up study. Juvela S, Poussa K, Porras M. Stroke. 2001;32:485–491. doi: 10.1161/01.str.32.2.485. [DOI] [PubMed] [Google Scholar]
- 15.Mirror aneurysms: a reflection on natural history. Meissner I, Torner J, Huston J 3rd, Rajput ML, Wiebers DO, Jones LK Jr, Brown RD Jr; International Study of Unruptured Intracranial Aneurysms Investigators. J Neurosurg. 2012;116:1238–1241. doi: 10.3171/2012.1.JNS11779. [DOI] [PMC free article] [PubMed] [Google Scholar]
- 16.Natural history of unruptured intracranial aneurysms: probability of and risk factors for aneurysm rupture. Juvela S, Porras M, Poussa K. J Neurosurg. 2008;108:1052–1060. doi: 10.3171/JNS/2008/108/5/1052. [DOI] [PubMed] [Google Scholar]
- 17.Influence of hemodynamic factors on rupture of intracranial aneurysms: patient-specific 3D mirror aneurysms model computational fluid dynamics simulation. Lu G, Huang L, Zhang XL, Wang SZ, Hong Y, Hu Z, Geng DY. AJNR Am J Neuroradiol. 2011;32:1255–1261. doi: 10.3174/ajnr.A2461. [DOI] [PMC free article] [PubMed] [Google Scholar]
- 18.Morphological and hemodynamic analysis of mirror posterior communicating artery aneurysms. Xu J, Yu Y, Wu X, Wu Y, Jiang C, Wang S, Huang Q, Liu J. PLoS One. 2013;8:0. doi: 10.1371/journal.pone.0055413. [DOI] [PMC free article] [PubMed] [Google Scholar]
- 19.Risk factors for the formation of multiple intracranial aneurysms. Ellamushi HE, Grieve JP, Jäger HR, Kitchen ND. J Neurosurg. 2001;94:728–732. doi: 10.3171/jns.2001.94.5.0728. [DOI] [PubMed] [Google Scholar]
- 20.Incidence and outcome of multiple intracranial aneurysms in a defined population. Kaminogo M, Yonekura M, Shibata S. Stroke. 2003;34:16–21. doi: 10.1161/01.str.0000046763.48330.ad. [DOI] [PubMed] [Google Scholar]
- 21.De novo aneurysm formation and growth of untreated aneurysms: a 5-year MRA follow-up in a large cohort of patients with coiled aneurysms and review of the literature. Ferns SP, Sprengers ME, van Rooij WJ, van den Berg R, Velthuis BK, de Kort GA, Sluzewski M, van Zwam WH, Rinkel GJ, Majoie CB. Stroke. 2011;42:313–318. doi: 10.1161/STROKEAHA.110.591594. [DOI] [PubMed] [Google Scholar]
- 22.Unruptured intracranial aneurysms: natural history, clinical outcome, and risks of surgical and endovascular treatment. Wiebers DO, Whisnant JP, Huston J 3rd, Meissner I, Brown RD Jr, Piepgras DG, Forbes GS, Thielen K, Nichols D, O'Fallon WM, Peacock J, Jaeger L, Kassell NF, Kongable-Beckman GL, Torner JC; International Study of Unruptured Intracranial Aneurysms Investigators. Lancet. 2003;362:103–110. doi: 10.1016/s0140-6736(03)13860-3. [DOI] [PubMed] [Google Scholar]
- 23.Relationship between variations in the circle of Willis and flow rates in internal carotid and basilar arteries determined by means of magnetic resonance imaging with semiautomated lumen segmentation: reference data from 125 healthy volunteers. Tanaka H, Fujita N, Enoki T, Matsumoto K, Watanabe Y, Murase K, Nakamura H. http://www.ajnr.org/content/27/8/1770.full. AJNR Am J Neuroradiol. 2006;27:1770–1775. [PMC free article] [PubMed] [Google Scholar]
- 24.Characterization of volumetric flow rate waveforms in the normal internal carotid and vertebral arteries. Ford MD, Alperin N, Lee SH, Holdsworth DW, Steinman DA. Physiol Meas. 2006;26:477–488. doi: 10.1088/0967-3334/26/4/013. [DOI] [PubMed] [Google Scholar]
- 25.Vascular dimensions of the cerebral arteries follow the principle of minimum work. Rossitti S, Löfgren J. Stroke. 1993;24:371–377. doi: 10.1161/01.str.24.3.371. [DOI] [PubMed] [Google Scholar]
- 26.Wall shear stress on ruptured and unruptured intracranial aneurysms at the internal carotid artery. Jou LD, Lee DH, Morsi H, Mawad ME. AJNR Am J Neuroradiol. 2008;29:1761–1767. doi: 10.3174/ajnr.A1180. [DOI] [PMC free article] [PubMed] [Google Scholar]
- 27.Size ratio correlates with intracranial aneurysm rupture status: a prospective study. Rahman M, Smietana J, Hauck E, Hoh B, Hopkins N, Siddiqui A, Levy EI, Meng H, Mocco J. Stroke. 2010;41:916–920. doi: 10.1161/STROKEAHA.109.574244. [DOI] [PubMed] [Google Scholar]
- 28.Characterization of critical hemodynamics contributing to aneurysmal remodeling at the basilar terminus in a rabbit model. Metaxa E, Tremmel M, Natarajan SK, Xiang J, Paluch RA, Mandelbaum M, Siddiqui AH, Kolega J, Mocco J, Meng H. Stroke. 2010;41:1774–1782. doi: 10.1161/STROKEAHA.110.585992. [DOI] [PMC free article] [PubMed] [Google Scholar]
- 29.Quantitative hemodynamic analysis of brain aneurysms at different locations. Chien A, Castro MA, Tateshima S, Sayre J, Cebral J, Viñuela F. AJNR Am J Neuroradiol. 2009;30:1507–1512. doi: 10.3174/ajnr.A1600. [DOI] [PMC free article] [PubMed] [Google Scholar]
- 30.High WSS or low WSS? Complex interactions of hemodynamics with intracranial aneurysm initiation, growth, and rupture: toward a unifying hypothesis. Meng H, Tutino VM, Xiang J, Siddiqui A. AJNR Am J Neuroradiol. 2014;35:1254–1262. doi: 10.3174/ajnr.A3558. [DOI] [PMC free article] [PubMed] [Google Scholar]


