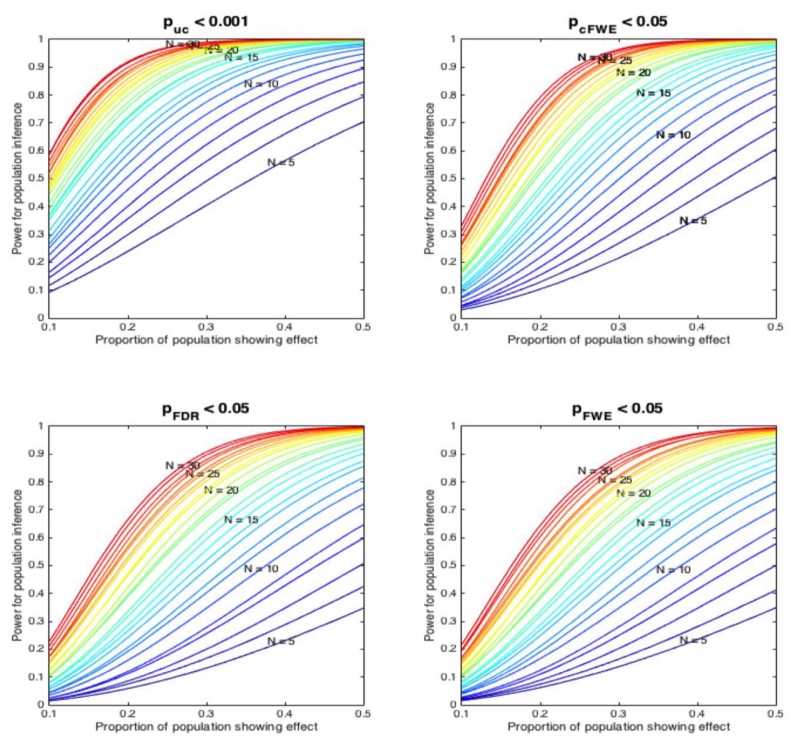
Figure 7.
Power of inference on the underlying population of experiments assuming different “effect sizes” (proportion of the experiments in the underlying population showing an effect at a given location). The power to detect a given effect in the underlying population depends on the probability that x out of N experiments in an ALE analysis (assumed to be random samples from the underlying population) show the effect and the sensitivity of the ALE to identify it (cf. Figure 4). The total number of experiments in the respective simulated ALE is again coded in a spectral sequence. In spite of the differences in power between the thresholding methods, two trends are noticed. ALE analyses with less than 10-50 experiments yield a low power to find consistent effects. Even ALE analyses with 30 experiments are not very highly powered to reveal rare effects. In addition, we note that voxel-level FDR thresholding combines a low sensitivity (cf. Figure 4) with a high potential for false positive or spurious findings especially when there is a strong true effect (cf. figure 6).

