Abstract
We report results of our experimental and theoretical studies on the oxidation of Cu-Au alloy surfaces, viz., Cu3Au(111), CuAu(111), and Au3Cu(111), using hyperthermal O2 molecular beam (HOMB). We observed strong Au segregation to the top layer of the corresponding clean (111) surfaces. This forms a protective layer that hinders further oxidation into the bulk. The higher the concentration of Au in the protective layer formed, the higher the protective efficacy. As a result, of the three Cu-Au surfaces studied, Au3Cu(111) is the most stable against dissociative adsorption of O2, even with HOMB. We also found that this protective property breaks down for oxidations occurring at temperatures above 300 K.
Copper (Cu) and gold (Au) form model binary metallic systems1,2,3,4,5,6 with stable L10 (CuAu) and L12 (Cu3Au and Au3Cu) structures. Experimental studies report surface segregation of Au in Cu-Au alloys7,8,9,10,11,12,13,14,15,16,17,18,19,20,21. More recently, extensive studies4,10,11,12,13,14,15,16,17,18,19,22,23 on the oxidation of Cu3Au surfaces found Au-rich top-most layers of Cu3Au(100), (110), and (111) surfaces. Oxidation, which is one of the more important corrosion process, induces changes in segregation10,11,12,13,14,15,16,17,18,22,23,24,25,26. Studies have been done to induce Cu segregation to the surface by dissociatively adsorbing energetic O210,11,12,13,22,23. However, even after prolonged doses of 2.3 eV hyperthermal O2 molecular beam (HOMB), there were no obvious Cu2O growth observed on (100) and (111). These results suggest that alloying of Cu-based materials with Au works as an efficient protection against oxidation into the bulk10,11,23. On the other hand, on the more open (110), additional oxidation processes induced by the enhanced diffusion of constituent atoms from and/or into the bulk contributes to Cu2O formation. Although Cu segregation on the surface occurs in a similar way12,22.
Au segregation depends on the bulk chemical potentials of Au and Cu, i.e., bulk stoichiometry. Thus, we expect to be able to control Au surface segregation, i.e., the Au layer profile on the surface region, by changing the bulk Au concentration13,23. Herein, we report the results of our detailed studies on the Au layer distribution of Cu3Au(111), CuAu(111) and Au3Cu(111). We also demonstrate the protective function/nature of such surfaces against oxidation processes induced by energetic O2. Increasing Au bulk concentration hinders oxidation. Clean Au3Cu(111) contains ca. 100% Au atoms in the first and second layers. Thus, as expected, Au3Cu(111) is inert to oxidation. Theoretical studies also support the same conclusion with regard to the protective nature of the surface. However, even on such initially inert surfaces, protection against oxidation fails for processes occurring at higher temperatures.
Experimental & Theoretical Methodology
To characterize the corresponding surfaces, we use X-ray photoemission spectroscopy (XPS) measurements in conjunction with synchrotron radiation (SR). All experiments were performed using the surface reaction analysis apparatus (SUREAC 2000), constructed in BL23SU at SPring-827,28. Briefly, the surface reaction analysis chamber is equipped with an electron energy analyzer (OMICRON EA125) and a Mg/Al-α twin-anode X-ray source (OMICRON DAR400). A quadrupole mass spectrometer, which was used to analyze the molecular species in the HOMB, is located opposite to the HOMB source. The base pressure of the surface reaction chamber was below 2 × 10⁻⁸ Pa. The Cu3Au(111) (Surface Preparation Laboratory, SPL), CuAu(111) (MaTeck), and Au3Cu(111) (SPL) samples were cleaned by repeatedly sputtering with 1.0~1.5 keV Ar+ and annealing at 720 K for 30 min, until impurities can no longer be detected by SR-XPS, and corresponding sharp (1 × 1) LEED pattern observed except for the CuAu(111). The clean CuAu(111) revealed a dim (1 × 1) LEED pattern, suggesting a low bulk crystallinity.
We control the kinetic energy of the incident HOMB by changing the O2, He, and/or Ar gas mixing ratios. The corresponding nozzle temperatures used to produce 0.5 and 2.3 eV HOMB are 300 and 1400 K, respectively. A typical flux density at the sample position in the present experiments would be ca.1014–1015 molecules ⋅ cm−2 ⋅ s−1, at HOMB kinetic energies of 0.5 and 2.3 eV. After irradiating the Cu3Au(111) with the desired amount of HOMB normal to the surface, we measured the corresponding high-resolution SR-XPS spectra at 0°, 35°, and 70° from the surface normal, using a monochromatic SR beam with a photon energy of 1090.5 eV.
We also performed density functional theory based total energy calculations29,30, within the Generalized Gradient Approximation (GGA)31, using plane waves (600 eV cutoff energy) and pseudopotentials32. We model CuAu(111) and Au3Cu(111) using periodic slabs. Each slab has seven fcc (111) layers, separated by ca. 1.50 nm of vacuum, repeated in a supercell geometry, with dipole correction applied. Each layer in the slab contains four atoms, so that the composition (of Au) can be varied in steps of 25%. We have chosen sufficiently large supercells so as to avoid interaction between the O(O2) in neighboring supercells. We performed Brillouin zone integration using the Monkhorst-Pack special point sampling technique33, with 9 × 9 × 1 sampling meshes. The bottom four layers comprise the unsegregated layers having bulk geometry, i.e., 50%–Au 50%–Cu in the L10 ordered structure (CuAu) and 75%–Au 25%–Cu in the L12 ordered structure (Au3Cu). The bottom four layers were kept fixed to the corresponding optimized theoretical bulk lattice constants, viz., a = 0.394 nm, c = 0.365 nm (CuAu), and a = 0.394 nm (Au3Cu). The top three layers, viz., the first surface layer, the second-, and third- (sub-surface) layers, comprise the segregated layers and allowed to relax. We also carried out similar calculations for bulk Cu, bulk Au, bulk CuAu, bulk Au3Cu, and O2.
Results and Discussion
Au Segregation and Concentration Profile
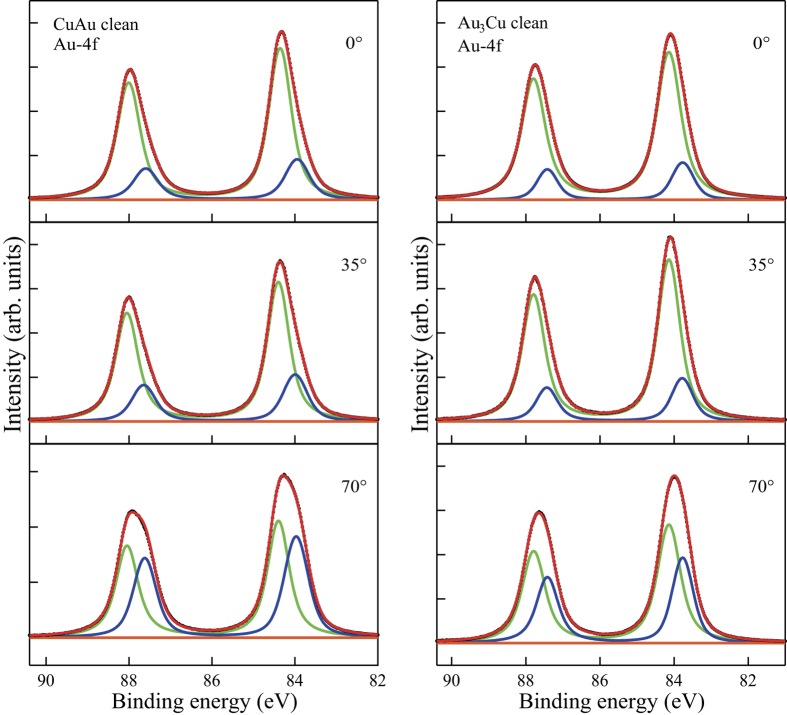
In Fig. 1, we show the Au-4f SR-XPS spectra of clean CuAu(111) and Au3Cu(111), measured at 0°, 35°, and 70° from the surface normal. (For the Cu3Au(111) results, cf., ref. 13). The Au-4f XPS spectra were fitted with the Voigt function, defined as the convolution of a Lorentzian with a Gaussian line shape. The background was subtracted by the Shirley method34. Similar to Cu3Au(100)10,11,35, Cu3Au(110)12, and Cu3Au(111)13, we can clearly separate both the Au-4f7/2 and Au-4f5/2 XPS peaks into bulk (B) and surface (S) components. The B components peak at binding energies EB = 84.48 eV, 84.39 eV, 84.14 eV (Au-4f7/2) and EB = 88.10 eV, 88.04 eV, 87.79 eV (Au-4f5/2) for Cu3Au(111), CuAu(111) and Au3Cu(111), respectively. The S components peak at relatively lower EB than that of the corresponding B components. We see that, consistent with previous reports35,36, the EB peak positions of the B components increase with increasing bulk Au concentrations. Also, consistent with Au-rich termination, we can observe clear Au-4f surface core-level shift (SCLS) in Fig. 1. The corresponding SCLS values are Cu3Au(111): −340 meV; CuAu(111): −420 meV; and Au3Cu(111): −370 meV. For comparison, the SCLS for pure Au(111) is −350 meV37. The difference in surface coordination of the Au atoms (vide ante) accounts for the bulk Au concentration dependence of SCLS. Reduced coordination leads to narrower valence bandwidth. Narrowing of the bandwidth, in turn, increases the density of states. To maintain a common Fermi level, charge must flow between the surface atoms and the bulk. If more than half of the valence band is filled, the surface narrowed band center is lower than the bulk Fermi level and the binding energy decreases. In contrast, if less than half of the valence band is filled, the surface narrowed band center is higher than bulk Fermi level, and the binding energy increases. This explains the trends observed experimentally, as corroborated by the measured valence band spectra and the corresponding calculated density of states (cf., Figs 2 and 3).
Figure 1. Detection angle dependence of Au-4f SR-XPS spectra on clean CuAu(111) (left panel) and Au3Cu(111) (right panel).
Surface normal detection: 0°. Oblique detection: 35° and 70°. The XPS spectra can be clearly separated into bulk (B) and surface (S) components, green and blue lines, respectively (see also text). The S components peak at relatively lower binding energies than that of the corresponding B components. The background was already subtracted by the Shirley method34. Intensities given in arbitrary units and intensity scales differ between panels (i.e., differ between samples and detection angles).
Figure 2. Bulk Au concentration dependence of valence band SR-XPS spectra of clean Cu(111), Cu3Au(111), CuAu(111), and Au3Cu(111).
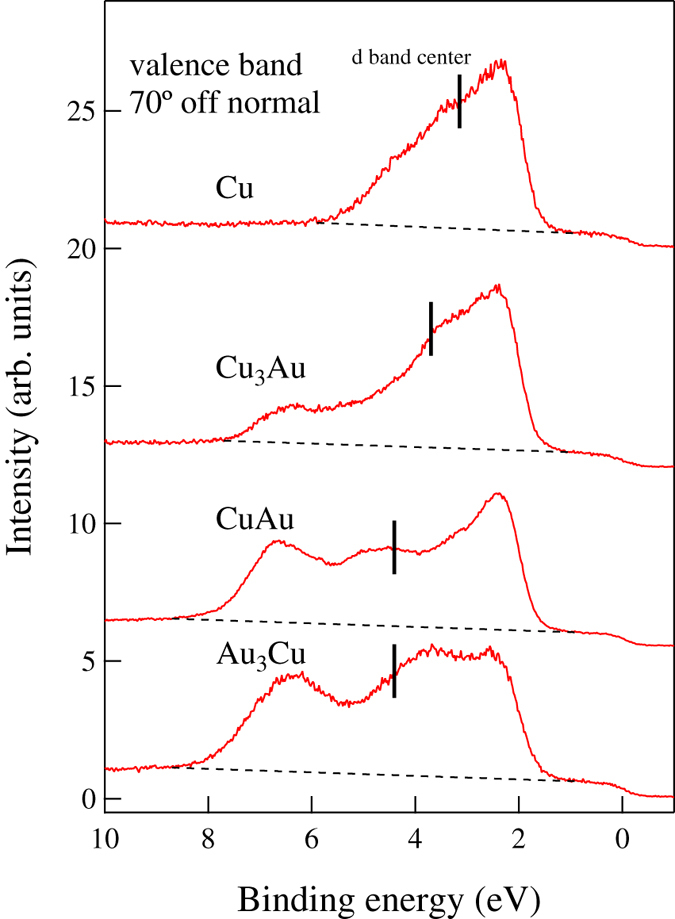
Red and black lines show the peak curves and the linear fitting (for the sp-band contribution and background, both of which need to be subtracted from the spectra) used in determining the location of the d-band center, respectively. The short vertical lines on each peak indicate the positions of the corresponding d-band centers, viz., Cu: 3.1 eV, Cu3Au: 3.7 eV, CuAu: 4.5 eV, and Au3Cu: 4.4 eV, respectively, for detection 70° from the surface normal. For detection along the surface normal, the d-band center are located as follows: Cu: 3.2 eV, Cu3Au: 3.6 eV, CuAu: 4.4 eV, and Au3Cu: 4.5 eV.
Figure 3. Projected density of states of atoms on the top layer of clean Cu(111) (black line), Cu3Au(111) (red line), CuAu(111) (green line), and Au3Cu(111) (blue line).
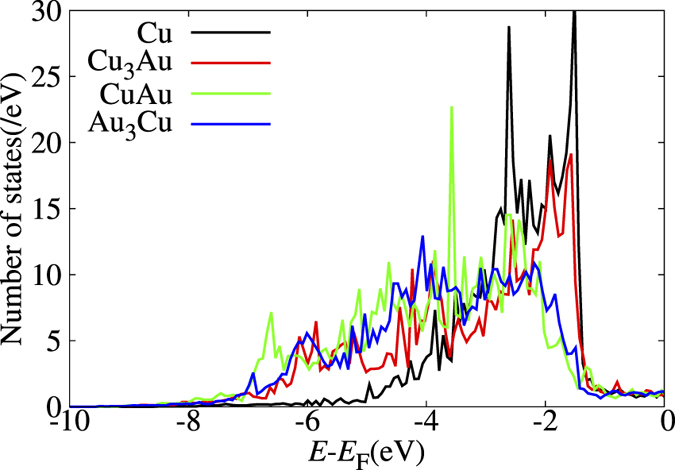
The corresponding d-band centers are located as follows: Cu: −2.45 eV, Cu3Au: −2.86 eV, CuAu: −3.37 eV, and Au3Cu: −3.24 eV, respectively. Energies given in [eV] with respect to the Fermi level (EF). (Calculated binding energy EB = |E − EF|).
We determined the layer Au concentration profile from the detection angle dependence of the Au-4f XPS peak intensity, which has B, S, and I (interface layer) components. We can approximate the peak intensity ratio of S to B (AS/AB) for a clean Cu3Au surface by the following simple equation,
 |
xn gives the Au fraction of the n-th layer from the surface. d gives the interlayer distance. The corresponding Au-4f photoelectron mean free paths λ in each Cu-Au alloy can be obtained following previous studies38. For Cu3Au, CuAu, and Au3Cu, we get λ = 1.48, 1.56, 1.63 nm, respectively (cf., Supplementary Information). θ is the photoelectron detection angle from the surface normal. From AS/AB measured at θ = 0°, 35°, and 70°, we obtain x1 and x2 for the clean surface, assuming d to be the bulk interlayer distance, ignoring layer relaxation, and taking xn≥3 to be the bulk value.
For Cu3Au(111): d = 0.217 nm, xn≥3 = 0.25; thus giving us x1 = 0.51 and x2 = 0.32.
For CuAu(111): d = 0.225 nm, xn≥3 = 0.50; which gives us x1 = 0.94 and x2 = 0.72.
For Au3Cu(111): d = 0.230 nm, xn≥3 = 0.75; and x1 = 1.00 and x2 = 1.00.
These values agree well with our theoretical predictions, as shown in Table 1. Surprisingly, the first and the second layers of Au3Cu(111) contain almost 100%-Au atoms. This indicates that Au3Cu(111) would be inert (to oxidation).
Table 1. The layer profile of Au atomic fraction (%) for Cu3Au, CuAu, and Au3Cu (111) surfaces.
| (111) surface | %-Au@ 1st layer | %-Au@ 2nd layer | %-Au@ 3rd layer | Ref. |
|---|---|---|---|---|
| Cu3Au | 51 | 32 | bulk (25) | 13a |
| 50 | 25 | 25 | 13b | |
| CuAu | 94 | 72 | bulk (50) | *a |
| 100 | 75 | 50 | *b | |
| Au3Cu | 100 | 100 | bulk(75) | *a |
| 100 | 100 | 75 | *b |
aExperimental mesurements.
bTheoretical calculations.
*Present work.
In Figs 2 and 3, we show the measured valence band spectra and calculated sum of the projected density of states (PDOS) of atoms on the top layer of the clean Cu(111), Cu3Au(111), CuAu(111) and Au3Cu(111), respectively. The evolution of Au-related features correspond to the Au-segregated layer profile in Table 1. The d-band of surface atoms and d-band centers are shifted to lower energy levels (corresponding to increasing binding energies) with increasing Au concentration on the surface, with a maximum for CuAu(111), consistent with the SCLS results from Fig. 1.
Initial Stages of Oxidation by HOMB & The Protective Layer
In Fig. 4 we show O-uptake curves obtained by integrating a series of O-1s spectra measurements taken after exposing Cu3Au(111), CuAu(111), and Au3Cu(111) to HOMB. The HOMB energies used, viz., EHOMB = 2.3 eV and EHOMB = 0.5 eV, correspond to 27000 K and 5900 K, respectively. On Cu3Au(111), the initial dissociative adsorption of O2 (O-coverage: ca. Θ ≤ 0.3 ML) does not depend on the incident energy. This indicates that an incident energy of 0.5 eV is enough to overcome the activation barrier for surface Cu-O formation. A previous study reported that a 0.6 eV HOMB would be more efficient to induce initial oxidation, as compared to a 2.3 eV HOMB, at the same nozzle temperature of ca. 1400 K. In the present study (0.5 eV HOMB), we used a nozzle temperature of ca. 300 K. Thus, the difference with previous results may be ascribed to vibrational excitations. At a nozzle temperature of 1400 K, O2 vibrational states ν = 1 and ν = 2 have populations of ca. 16% and 3%, respectively.
Figure 4. Oxygen (O) uptake curves for 2.3 eV hyperthermal O2 molecular beam (HOMB) incident at surface temperature TS = 300 K on Cu(111) (red filled  ), Cu3Au(111) (black filled
  ), Cu0.5Au0.5 (111) (blue filled
  ), and Au3Cu(111) (green filled
  ); 0.5 eV HOMB incidence on Cu3Au(111) (orange
  ) and Cu0.5Au0.5(111) (blue
  ).
).
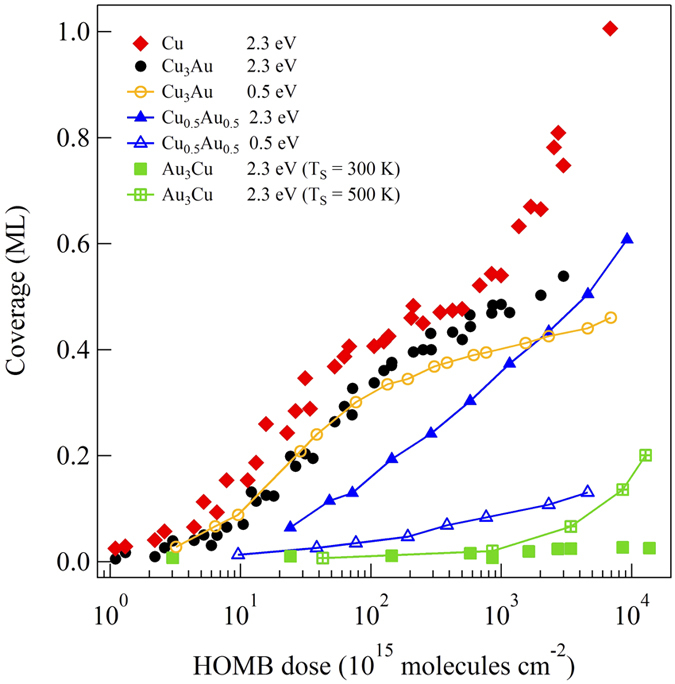
O uptake curves for 2.3 eV HOMB incident at surface temperature TS = 500 K on Au3Cu(111) (green  ), also shown. HOMB incident along the surface normal.
The difference in the O-uptake curves of 2.3 and 0.5 eV HOMB for ca. Θ ≥ 0.3 ML can be attributed to the repulsive interactions between pre-adsorbed O and the incoming O2, increasing the activation barrier to dissociative adsorption. Moreover, oxide formation on the Cu-rich sites via collision induced absorption (CIA) by energetic HOMB may also contribute to the difference. More importantly, oxidation proceeds accompanied by Cu segregation to the topmost layer. The oxidation induced by the 2.3 eV HOMB occurs less effectively on Cu3Au(111) than on Cu(111). This result suggests that Au atoms increase the activation barrier to dissociative adsorption.
As we would expect from the Au layer profile shown in Table 1, we find CuAu(111) and Au3Cu(111) less susceptible to oxidation as compared to Cu3Au(111) and Cu(111). On the Au3Cu(111), almost no oxidation occurs even for 2.3 eV HOMB. Thus, two (stable) layers of Au is enough to protect against oxidation. From the slopes, we estimate the initial O sticking probabilities to be as follows: S0 = 1.59 × 10⁻² at EHOMB = 2.3 eV on Cu(111); S0 = 6.35 × 10⁻³(6.20 × 10⁻³) at EHOMB = 2.3 eV(0.5 eV) on Cu3Au(111); S0 = 1.87 × 10⁻³(3.82 × 10⁻⁴) at EHOMB = 2.3 eV(0.5 eV) on CuAu(111); and S0 = 6.13 × 10⁻⁵ at EHOMB = 2.3 eV on Au3Cu(111). At low Θ, we expect that the reaction rate would be determined by the atomic density of Cu (Au) on surface. Our experimental results (cf., Table 1) show 49%-Cu (51%-Au)13, 6%-Cu (94%-Au), and 0%-Cu (100%-Au) on clean Cu3Au(111), CuAu(111), and Au3Cu(111), respectively. Therefore, we estimate the Cu atomic density ratio of Cu3Au(111), CuAu(111), and Au3Cu(111) to Cu(111) to be 0.47, 0.05, 0, respectively. The sticking probability ratio of Cu3Au(111), CuAu(111), and Au3Cu(111) to Cu(111) are 4.0 × 10⁻¹, 1.2 × 10⁻¹, and 3.8 × 10⁻³, respectively, at 2.3 eV HOMB. The sticking probability ratio of CuAu(111) to Cu3Au(111) is 6.2 × 10⁻², at 0.5 eV HOMB. These sticking probability ratios agree well with the surface Cu atomic density ratio, so that the initial stage of oxidation, i.e., O2 dissociative adsorption, depends on the top-layer Cu (Au) concentrations. We can also associate the difference in initial O sticking probability ratio to the location of the corresponding d-band center with respect to the Fermi level EF. The shallower the d-band center, the more accessible the electrons, and the stronger the binding with O. In the case of Cu-Au alloys, the d-band center of Cu3Au (111) is shallower than that of Au3Cu (111) and CuAu (111) (cf., Figs 2 and 3).
The CIA process is less effective in the oxidation of Cu3Au(111) than of Cu(111). The Au layer profile of Cu3Au(111) after the oxidation is estimated to be as follows: x1 = 0, x2 = 0.47, and x3 = 0.4513. The oxidation proceeds accompanied by Cu segregation to the topmost layer. The Au-rich second and third layers prevent the bulk from further oxidation. Similar analysis is performed for CuAu(111) (ca. Θ = 0.6 ML) oxidized by 2.3 eV HOMB (cf., Supplementary Information). The obtained Au layer profile is as follows: x1 = 0, x2 = 1.0, and x3 = 0.56. The Au-rich second and third layers work as a protective layer against bulk oxidation.
Breaking the Protective Layer
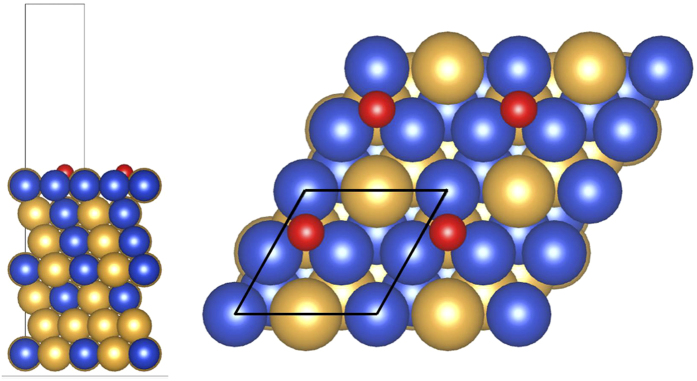
Here, we show how such a protective layer is broken. As mentioned above, Au3Cu(111), with a concentration profile of 100%-Au for the surface and subsurface layers, is impervious to oxidation by 2.3 eV HOMB. However, when we increase the surface temperature to 500 K, oxidation proceeds and we obtain an O coverage of Θ = 0.2 ML. Cu atoms segregate on the surface and the obtained Au layer profile is x1 = 0.31, x2 = 0.43, x3 = 0.51 (cf., Supplementary Information). In Fig. 5, we show the calculated surface energy of Au3Cu (111), under Au-rich and Cu-rich conditions, as a function of the oxygen chemical potential ΔμO (which is in turn related to the oxygen partial pressures at 300 K and 500 K). For the Au-rich case, the most stable clean surface has an Au layer profile of 100/100/75, i.e., Au on top and second layers, Au3Cu on third layer. For the Cu-rich case, the most stable clean surface has an Au layer profile of 75/100/75. The only difference with the Au-rich is the top layer, which is Au3Cu. The second and third layers are the same as that for the Au-rich case. With increasing chemical potential, both Au-rich and Cu-rich cases show the same tendency: O/Cu3Au on the top layer, CuAu in the second, and third layers; 2O/Cu on the top layer, with Au on the second and Au3Cu third layer. LEED shows a (2 × 2) pattern (cf., Supplementary Information), and we show the corresponding optimized surface structure in Fig. 6, with 0.25 ML of adsorbed O. The most stable O adsorption position is the fcc-hollow site, which is surrounded by Cu. The Cu-O distance is 0.188 nm. This distance does not depend on second and third layer configuration, and the value is close to Cu(111), CuAu(111) and Cu3Au(111). In Fig. 7, we show the corresponding projected density of states for the adsorbed O for three different Au surface (top layer) profiles, viz., 0, 50%, and 100% Au. As the surface becomes Au-rich, the bonding orbitals between Cu and O shift towards the Fermi level EF. This means that the richer the Au profile, the weaker the bonding between O and the surface. From above results, the d-band center, bonding orbitals, and the distance between Cu and O depend on configuration of top layer and does not depend on configuration of other layers and bulk component. From Fig. 6, at 500 K, we could expect small amounts of Cu atoms segregating to the topmost layer2 and enhancing the dissociative adsorption of O2.
Figure 5. Surface free energy of Au3Cu(111) in equilibrium with Au-rich (upper panel) and Cu-rich (lower panel) Au3Cu bulk reservoir, as a function of the oxygen chemical potential Δμo (which is also related to the oxygen partial pressures at 300 K and 500 K)13,23.
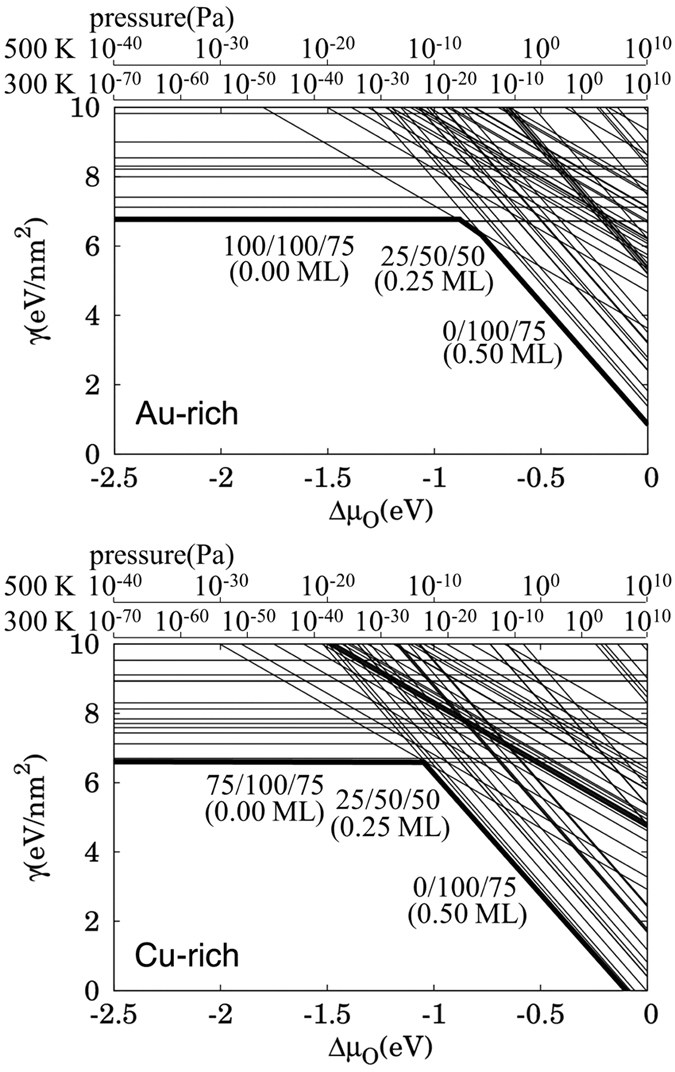
Each line corresponds to one of the tested surface configurations. The lowest surface energy is the most stable and realized surface. The condition for perfect Au3Cu bulk is close to the Au-rich condition.
Figure 6. Optimized structure for O0.25ML/Au3Cu(111), with O adsorbed at the fcc-hollow site (cf., upper panel, Fig. 5, 500 K, 10−8 Pa).
Au: yellow ball. Cu: blue ball. O: red ball. Structure drawn using the VESTA package39.
Figure 7. Projected density of states of adsorbed O on Cu (black line), CuAu(red line) and Au(blue line) at top layer.
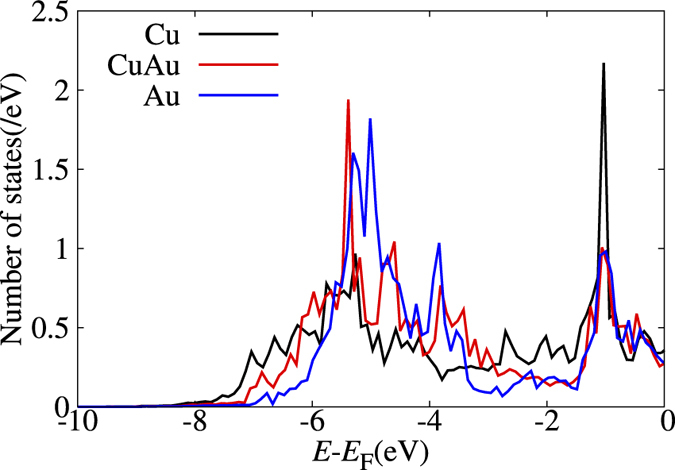
Other layers is the Au3Cu. Energies are given in [eV] with respect to the Fermi level (EF). (Calculated binding energy EB = |E − EF|).
Conclusion
We determined, both experimentally (HOMB + SR-XPS) and theoretically (DFT-based calculations), the surface Au concentration profile of Cu-Au alloys (viz., Cu3Au, CuAu, and Au3Cu) in vacuum. We also studied the initial stages of oxidation of the corresponding surfaces. We observed Au segregation to the surface and subsurface of these Cu-Au alloys. The degree of segregation strongly depends on the bulk Au components. The richer the Au bulk components, the richer the Au surface segregation. The Au-rich layers form a protective layer against oxidation of the Cu-Au alloys. After exposing the corresponding surfaces to HOMB, we found that surfaces with higher concentrations of Au showed lower susceptibility to oxidation, as determined by the low O sticking probability. At 500 K, Cu segregates on the surface, breaking the protective layer, and oxidation proceeds on the surface, albeit rather slowly as there is still the subsurface. This gives further insight into how we can control the reactivity and robustness of a material, i.e., via the bulk component and the segregation profile.
Additional Information
How to cite this article: Okada, M. et al. Experimental and Theoretical Studies on Oxidation of Cu-Au Alloy Surfaces: Effect of Bulk Au Concentration. Sci. Rep. 6, 31101; doi: 10.1038/srep31101 (2016).
Supplementary Material
Acknowledgments
We thank Y. Teraoka, T. Makino, and K. Takeyasu for their help in the experiments. We gratefully acknowledge MEXT for a Grant-in-Aid for Scientific Research (Nos 15KT0062, 17550011, 20350005, 22655005, 25620013, and 26248006). This work was also financially supported by The Sumitomo Foundation and The Murata Science Foundation. The synchrotron radiation experiments were performed at the BL23SU in the SPring-8 facilities with the approval of the Japan Synchrotron Radiation Research Institute (JASRI) and Japan Atomic Energy Agency (JAEA) (Proposal Nos 2015A3870, 2015B3870, 2015B3801). This work was performed under the Shared Use Program of JAEA Facilities (Proposal No. 2015A-E22, 2015B-E21) with the approval of Nanotechnology Platform project supported by the Ministry of Education, Culture, Sports, Science and Technology. Some of the numerical calculations presented here were done using the the computer facilities at the following institutes: CMC (Osaka University), ISSP, KEK, NIFS, and YITP.
Footnotes
Author Contributions M.O. conceived the experiment(s). M.O., Y.T. and A.Y. conducted the experiments. K.O., K.K., W.A.D. and H.K. conceived the model and performed the calculation. M.O. and W.A.D. drafted the manuscript. All authors contributed to the calculation, analyses of results, and review of the manuscript.
References
- Sundaram V. S., Alben R. S. & Robertson W. D. The order-disorder transformation at a (100) surface of Cu3Au: theory and experiment. Surf. Sci. 46, 653–671 (1974). [Google Scholar]
- Potter H. C. & Blakely J. M. LEED, Auger spectroscopy, and contact potential studies of copper–gold alloy single crystal surfaces. J. Vac. Sci. Technol. 12, 635–642 (1975). [Google Scholar]
- Alvarado S. F., Campagna M., Fattah A. & Uelhoff W. Critical wetting and surface-induced continuous phase transition on Cu3Au(001). Z. Phys. B 66, 103–106 (1987). [Google Scholar]
- Niehus H. & Achete C. Surface structure investigation of nitrogen and oxygen on Cu3Au(100). Surf. Sci. 289, 19–29 (1993). [Google Scholar]
- Ozoliņš V., Wolverton C. & Zunger A. Cu-Au, Ag-Au, Cu-Ag, and Ni-Au intermetallics: first-principles study of temperature-composition phase diagrams and structures. Phys. Rev. B 57, 6427–6443 (1998). [Google Scholar]
- Zhang Y., Kresse G. & Wolverton C. Nonlocal first-principles calculations in Cu-Au and other intermetallic alloys. Phys. Rev. Lett. 21, 075502-1–5 (2014). [DOI] [PubMed] [Google Scholar]
- Schömann S. & Taglauer E. Surface segregation on Au3Cu(001). Surf. Rev. Lett. 3, 1823–1829 (1996). [Google Scholar]
- Buck T. M., Wheatley G. H. & Marchut L. Order-disorder and segregation behavior at the Cu3Au(001) surface. Phys. Rev. Lett. 51, 43–46 (1983). [Google Scholar]
- MacRae E. G., Buck T. M., Malic R. A. & Wallace W. E. Ordering and layer composition at the Cu3Au(110) surface. Surf. Sci. 238 L481–L485 (1990). [Google Scholar]
- Okada M. et al. Protective layer formation during oxidation of Cu3Au(100) using hyperthermal O2 molecular beam. Appl. Phys. Lett. 89, 201912-1–3 (2006). [Google Scholar]
- Okada M. et al. Comparative study of oxidation on Cu and Cu3Au surfaces with a hyperthermal O2 molecular beam. Surf. Sci. 600, 4228–4232 (2006). [Google Scholar]
- Okada M. & Teraoka Y. Active oxidation of Cu3Au(1 1 0) using hyperthermal O2 molecular beam. Appl. Surf. Sci. 256, 5676–5680 (2010). [Google Scholar]
- Tsuda Y. et al. Initial stages of Cu3Au(111) oxidation: oxygen induced Cu segregation and the protective Au layer profile. Phys. Chem. Chem. Phys. 16, 3815–3822 (2014). [DOI] [PubMed] [Google Scholar]
- Niehus H., Voetz M., Achete C., Morgenstern K. & Comsa G. Surface structure investigation with ion scattering and scanning tunneling microscopy at oxygen and nitrogen covered Cu3Au surfaces. In Surface Science, Principles and Current Applications (eds MacDonald R. J., Taglauer E., Wandelt K.) 38–47 (Springer-Verlag, Berlin, 1996). [Google Scholar]
- Leitão A. A. et al. Signatures of oxygen on Cu3Au(100): from isolated impurity to oxide regimes. Phys. Rev. B 82, 045408-1–5 (2010). [Google Scholar]
- Moreira M. D., Fontes G. N., Niehus H., Achete C. A. & Capaz R. B. First-principles calculations and XPS measurements of gold segregation at the Cu3Au(111) surface. J. Vac. Sci. Technol. B 30, 051802-1–5 (2012). [Google Scholar]
- Leitão A. A. et al. Ab initio studies of pristine and oxidized Cu3Au(100) and (111) surfaces. J. Mater. Sci. 47, 7594–7600 (2012). [Google Scholar]
- Silva A. M., Achete C. A. & Capaz R. B. First-principles study of oxygen-induced copper segregation in Cu3Au(111). Chem. Phys. 410, 99–102 (2013). [Google Scholar]
- Poon H. C., Khanra B. C. & King T. S. Surface composition of clean and oxygen-covered Au, Cu alloy. Phys. Rev. B 47, 16494–16498 (1993). [DOI] [PubMed] [Google Scholar]
- Eckstein G. A. et al. Surface structure of Au3Cu(001). Phys. Rev. B 60, 8321–8325 (1999). [Google Scholar]
- Bangwei Z., Taglauer E., Xiaolin S., Wangyu H. & Huiqiu D. Simulation calculations of surface segregation for Au–Cu alloys using an analytic embedded atom model. Phys. Stat. Sol. (a) 202, 2686–2699 (2005). [Google Scholar]
- Hashinokuchi M., Yoshigoe A., Teraoka Y. & Okada M. Temperature dependence of Cu2O formation on Cu3Au(110) surface with energetic O2 molecular beams. Appl. Surf. Sci. 287, 282–286 (2013). [DOI] [PubMed] [Google Scholar]
- Oka K. et al. The effects of alloying and segregation for the reactivity and diffusion of oxygen on Cu3Au(111). Phys. Chem. Chem. Phys. 16, 19702–19711 (2014). [DOI] [PubMed] [Google Scholar]
- Völker E., Williams F. J., Calvo E. J., Jacob T. & Schiffrin D. J. O2 induced Cu surface segregation in Au—Cu alloys studied by angle resolved XPS and DFT modelling. Phys. Chem. Chem. Phys. 14, 7448–7455 (2012). [DOI] [PubMed] [Google Scholar]
- Luo L., Kang Y., Yang J. C. & Zhou G. Effect of gold composition on the orientations of oxide nuclei during the early stage oxidation of Cu-Au alloys. J. Appl. Phys. 111, 083533-1–9 (2012). [Google Scholar]
- Luo L. et al. Comparative study of the alloying effect on the initial oxidation of Cu-Au(100) and Cu-Pt(100). Appl. Phys. Lett. 104, 121601-1–5 (2014). [Google Scholar]
- Okada M. et al. Actively controlled oxidation of Cu{100} with hyperthermal O2 molecular beam. J. Chem. Phys. 119, 6994–6997 (2003). [Google Scholar]
- Okada M. et al. X-ray photoemission study of the temperature-dependent CuO formation on Cu(410) using an energetic O2 molecular beam. Phys. Rev. B 75, 233413-1–4 (2007), and references therein. [Google Scholar]
- Kresse G. & Furthmüller J. Efficiency of ab-initio total energy calculations for metals and semiconductors using a plane-wave basis set. Comput. Mater. Sci. 6, 15–50 (1996). [DOI] [PubMed] [Google Scholar]
- Kresse G. & Furthmüller J. Efficient iterative schemes for ab initio total-energy calculations using a plane-wave basis set. Phys. Rev. B 54, 11169–11186 (1996). [DOI] [PubMed] [Google Scholar]
- Perdew J. P., Burke K. & Ernzerhof M. Generalized gradient approximation made simple. Phys. Rev. Lett. 77, 3865–3868 (1996). [DOI] [PubMed] [Google Scholar]
- Blöchl P. E. Projector augmented-wave method. Phys. Rev. B 50, 17953–17979 (1994). [DOI] [PubMed] [Google Scholar]
- Monkhorst H. J. & Pack J. D. Special points for Brillouin-zone integrations. Phys. Rev. B 13, 5188–5192 (1976). [Google Scholar]
- Shirley D. A. High-resolution X-ray photoemission spectrum of the valence bands of gold. Phys. Rev. B 5, 4709–4714 (1972). [Google Scholar]
- DiCenzo S. B., Citrin P. H., Hartford E. H. Jr. & Wertheim G. K. Au surface density of states and surface core-level shifts in Cu3Au(001). Phys. Rev. B 34, 1343–1345(R) (1986). [DOI] [PubMed] [Google Scholar]
- Eberhardt W., Wu S. C., Garrett R., Sondericker D. & Jona F. Core-level shifts and the electronic structure of Cu3Au. Phys. Rev. B 31, 8285–8287(R) (1985). [DOI] [PubMed] [Google Scholar]
- Heimann P., van der Veen J. F. & Eastman D. E. Structure-dependent surface core level shifts for the Au(111), (100), and (110) surfaces. Solid State Commun. 38, 595–598 (1981). [Google Scholar]
- Seah M. P. & Dench W. A. Quantitative electron spectroscopy of surfaces: a standard data base for electron inelastic mean free paths in solids. Surf. Interface Anal. 1, 2–11 (1979). [Google Scholar]
- Momma K. & Izumi F. VESTA 3 for three-dimensional visualization of crystal, volumetric and morphology data. J. Appl. Cryst. 44, 1272–1276 (2011). [Google Scholar]
Associated Data
This section collects any data citations, data availability statements, or supplementary materials included in this article.


