Abstract
Aim:
The aim of this study was to evaluate and compare the changes in body weight, body mass index (BMI), and body fat percentage (BFP) during the initial stages of fixed orthodontic treatment.
Materials and Methods:
The sample for this observational prospective study included 68 individuals with fixed orthodontic appliance in the age group of 18–25 years of both the sexes (25 males and 43 females). The control group consisted of 60 individuals (24 males and 36 females). The weight, BMI, and BFP were measured using a Body Composition Monitor at three points of time “T1” initial; “T2” after 1 month; and “T2” after 3 months. The results were tabulated and analyzed with the Statistical Package for the Social Sciences software. The mean changes between different parameters in both the study and control groups and between males and females in the study group was compared by using two-tailed unpaired student's t-test. The statistical significance is set atP ≤ 0.05.
Results:
There was an overall decrease in the body weight, BMI, and BFP after 1 month in the study cohort, which was statistically significant compared to the control group (P < 0.0001). This was followed by an increase in the parameters after the end of the 3rd month. Comparison of the parameters between the study and control group at the start of the treatment and at the end of the 3rd month had no statistical significance. There was a marked variation in the changes of these parameters between males and females of the study group, which is statistically significant (<0.0001).
Conclusion:
There is a definite reduction in the weight, BMP, and BMI at the end of the first month followed by a gain of weight, but not at the initial point by the end of the 3rd month.
Key words: Body fat percentage, body mass index, fixed appliance, Orthodontics, weight
INTRODUCTION
In recent decades, a high demand for orthodontic treatment has been observed. According to Baldwin,[1] 80% of adults seeking orthodontic care for themselves or their children are motivated by a desire to improve appearance, regardless of structural or functional consideration. The major option of choice for treating them is fixed orthodontic treatment.
During fixed orthodontic treatment, patients are often advised by orthodontists to follow certain dietary restrictions such as to eat soft food during the initial stages of treatment for preventing pain and discomfort caused by pressure sensitivity. In the absence of proper dietary charts, patients generally switch over to convenient, easy to eat food without any special attention to the nutrient values of the consumed food. A good diet plays an important role in maintaining good overall health as well as oral health.[2] Inadequate food intake in humans results in a decrease in body weight. The loss of body weight during energy restriction involves loss of variable proportions of fat.[3] A very limited number of studies have assessed the impact of fixed orthodontic treatment on weight, body mass index (BMI), and body fat percentage (BFP) due to alteration in food intake. With this in mind, an investigation to determine the effects of fixed orthodontic treatment during early stages on body weight, BMI, and BFP was conducted.
MATERIALS AND METHODS
Participants
The participants for this study were selected among the patients who were registered and due for orthodontic treatment at the Narayana Dental college, Nellore. A total of 117 young adults (age range: 18 to 35 years) who satisfied the selection criteria were selected and divided into two groups. The study group consisted of 68 individuals (25 males and 43 females) for whom the treatment was initiated. The control group consisting of 60 individuals (24 males and 36 females) included patients on nominal roll for orthodontic treatment and in whom the treatment was not started. Both the groups completed sociodemographic and food frequency questionnaires. An initial pilot study was conducted on 20 patients in order to ensure that the 95% confidence interval estimate of the parameters in patients under orthodontic treatment with five units of error of mean were selected. A minimum sample size of 62 was estimated, preferably with equal number of male and female participants. It was determined that the difference in the sample size between the treatment and control group should not exceed 20% to increase the power of the study that was set at 80%. However, in our sample, there was a difference of 23% between the study and control group. Our study population belonged to an urban population of similar socioeconomic status.
In general, inclusion criteria included participants who were medically fit with an age range of 18–35 years without any history of trauma and congenital craniofacial deformities. The exclusion criteria included patients with a history of chronic disease or chronic medication that could influence nutritional habits or body weight (e.g., anorexia nervosa, diabetes, anemia, hormonal disturbances, etc.). Subjects who would fasting at any point of the study and patients on steroid therapy, diet plans, exercise, or any other drugs were also excluded from the study. The study sample included participants in whom both the upper and lower fixed appliance was indicated with extraction of premolars in all the quadrants. Patients who required removable appliances including functional appliances were excluded from the study.
This prospective study included participants who were followed-up for the first 3 months after placement of fixed appliance treatment for the study group and without any active treatment for the control group. The body weights, BMI, and BFP of the study and control group were recorded at the baseline during the time of initiation of the treatment (T1), end of the first month (T2), end of the 3rd month (T3) at different time-periods during the treatment.
The parameters in the study and control group were listed according to time, group, and sex [Table 1]. All the parameters were measured and entered by a single observer. Height and weight were measured thrice for each participant at a particular point of time and an average reading was taken. Thus, 36 readings were taken during the entire study, as tabulated. To assess the intraexaminer and interexaminer reliability, the procedure was performed by two examiners on a trial basis on five samples of measurements taken at T1 and T2. They were blinded from the information regarding the purpose of the study. Intraexaminer reliability data demonstrated a mean percentage agreement of 98% and a kappa coefficient of 0.96 indicating high reliability. In the final run, all the measurements were taken by a single observer (KV) who is a nondental (nonorthodontist) and was blind to the purpose of the study.
Table 1.
Description of the parameters in the study
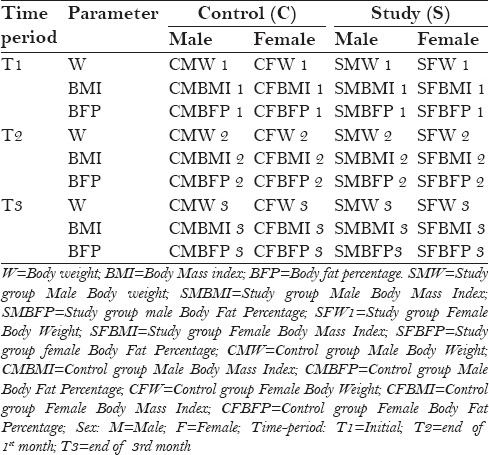
The difference between the T2 and T1 (T2 − T1) readings provides the mean changes in the parameters within the first month and that of the T1 and T3 gives the change in measurements at the end of 3 months (T3 − T1). The mean changes between the first month and at the end of the 3rd month can be derived from the difference in readings at T2 and T3 (T3 − T2).
The participant's height and weight were measured to calculate their BMI along with BFP. The height was measured using a stadiometer (Chasmors Limited, London, UK, 2015) [Figure 1]. Body weight and fat percentage was measured using a Karada Scan Body Composition Monitor HBF-375 (OMRON HEALTHCARE Co., Kyoto, Japan) [Figures 2 and 3]. It is more accurate for obtaining full body composition to estimate from an individual. It works under the principle of bioelectrical impedance analysis (BIA). The prediction formula gave generally good estimates of percentage of body fat (BF%).[4,5]
Figure 1.
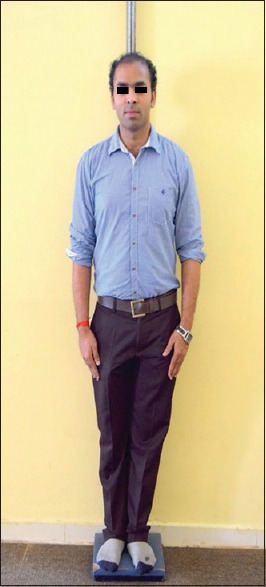
Measuring height with stadiometer
Figure 2.
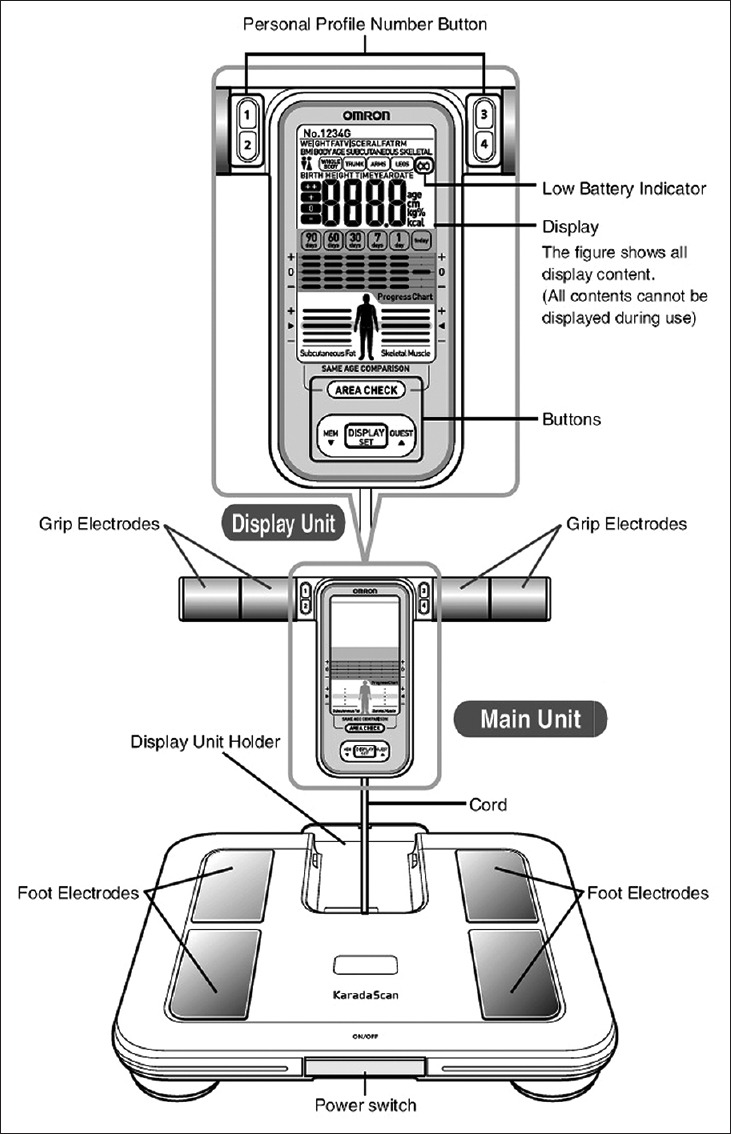
Karada scan body composition monitor HBF-375
Figure 3.
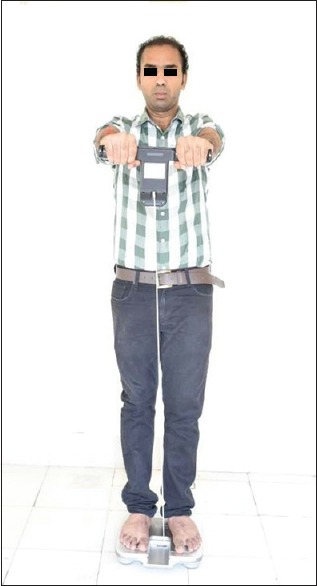
Measuring body weight and body fat percentage
Body fat percentage = [Body fat Mass (Kg)/Body weight (kg)] × 100
Body mass index is defined as the individual's body mass divided by the square of his or her height. The formula universally used in medicine produce a unit of measure of kg/m2.
BMI = Weight (kg)/[height (m)]2
The procedures were explained to the patient and an informed consent was obtained from all the participants who voluntarily participated in the study. The study was approved by the Institutional Ethical review board.
During the course of the study, 3 patients from the study group and 10 patients from the control group were dropped and excluded from the study. During the course of the study, 10 patients (4 males and 6 females) were reluctant to take orthodontic treatments who were in the control group. In the treatment group, 2 males and 1 female joined a yoga therapy class which included restriction of diet. These subjects were excluded from the study. The final sample size analyzed includes a test group of 65 (23 males and 42 females) and control group of 50 (20 males and 30 females) [Figure 4].
Figure 4.
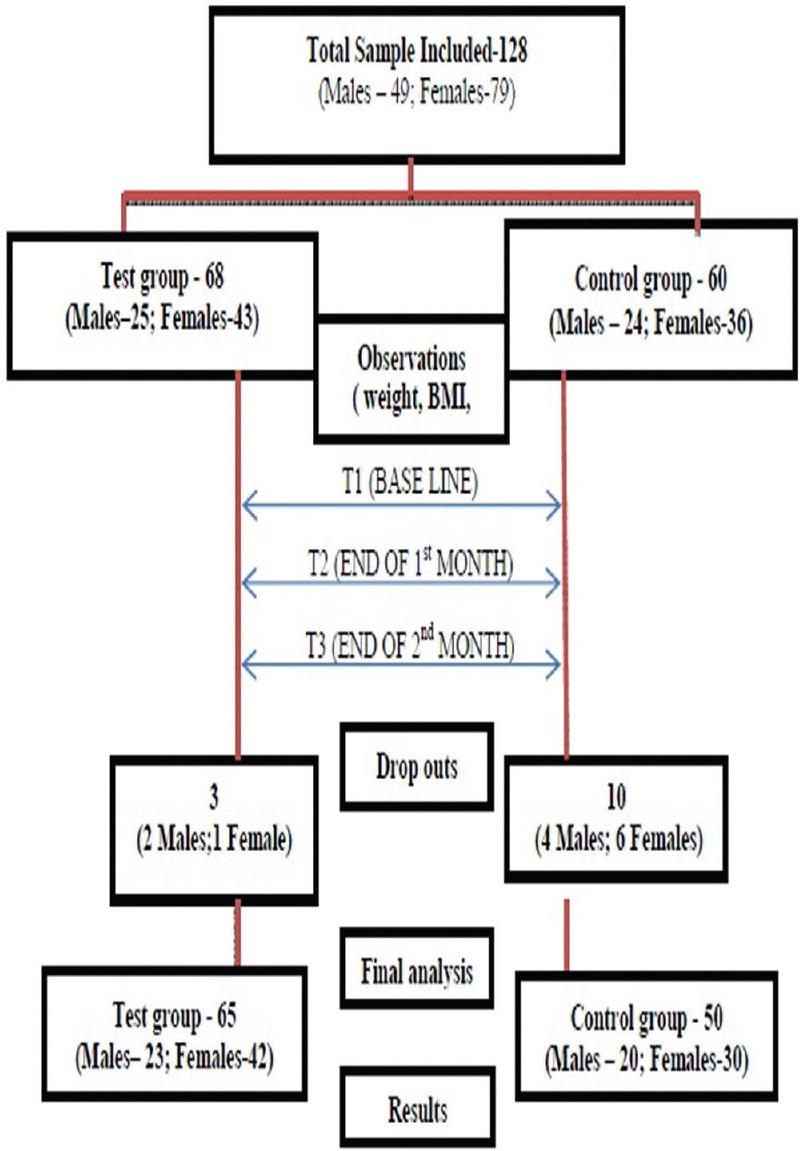
Flow chart of the study
RESULTS
Data collection
The data was collected and tabulated using MS Excel worksheet (MS office 2007). The readings of the control and study group were documented separately. The demographic and descriptive parameters are given in Tables 2 and 3.
Table 2.
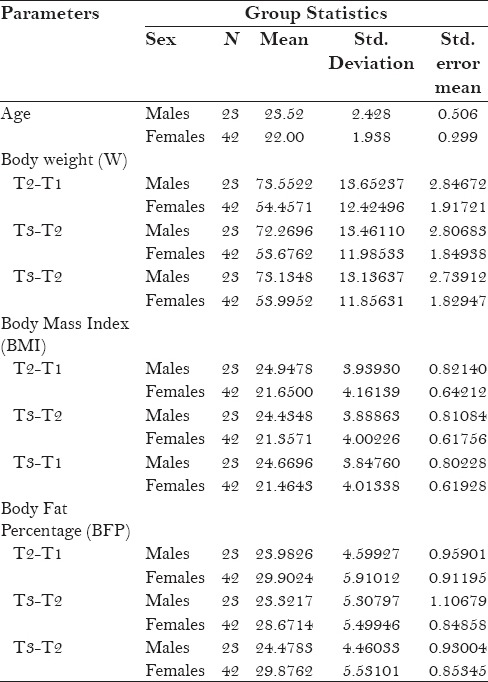
Descriptive statistics in the study

Table 3.
The mean and standard deviation of parameters in the study group and the control group

The statistical analysis was performed using the Statistical Package for the Social Sciences (SPSS) V 20.0 (IBM, Newyork, USA, 2011). For continuous variables, the data values are represented as mean and standard deviation. To test the mean difference between the study and control group, a two-tailed unpaired student's t-test was applied [Tables 3 and 4]. To determine the change in parameters of the experimental group at different periods between males and females, independent t-test was applied [Tables 5 and 6]. The statistical significance was set at P ≤ 0.05 P values of 0.00 generated by the software were computed as 0.01 for all practical purposes.
Table 4.
Comparison of changes in the parameters at different time-period between study group and control group
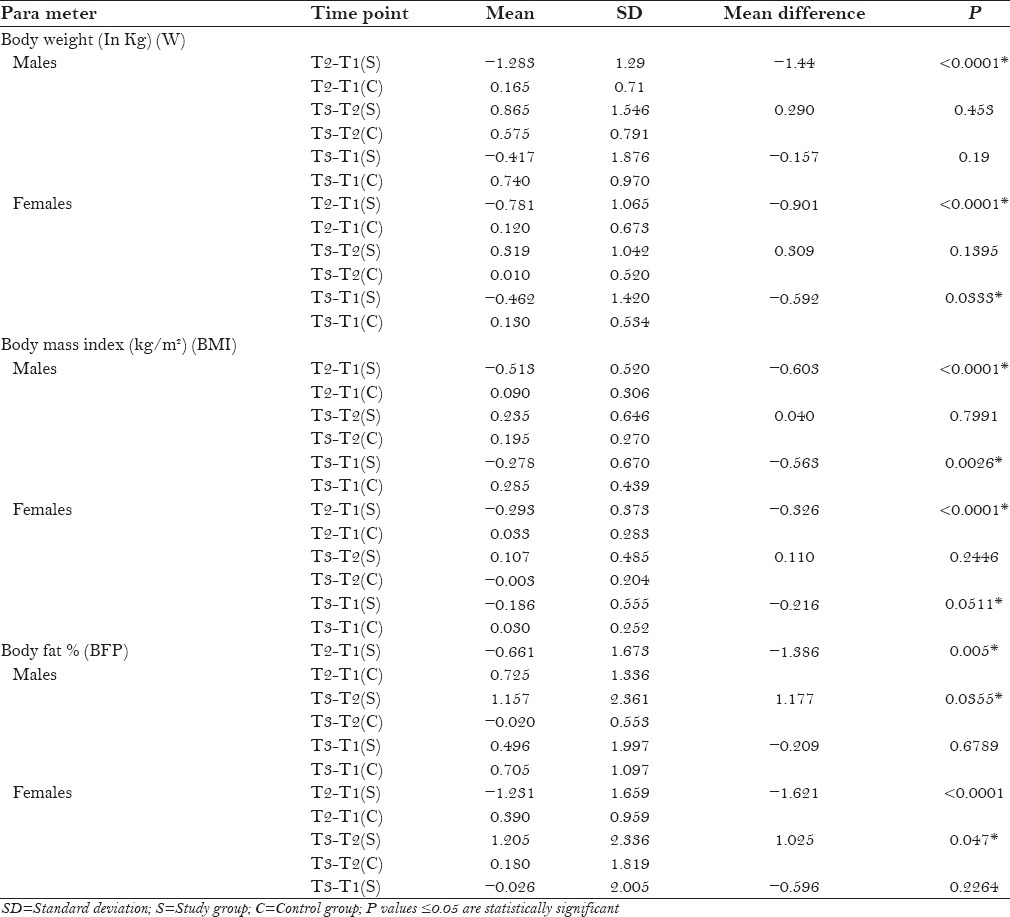
Table 5.
The comparison of mean difference of each parameter at T1, T2, and T3 in Males (M) and Females (F) in the study group (S)
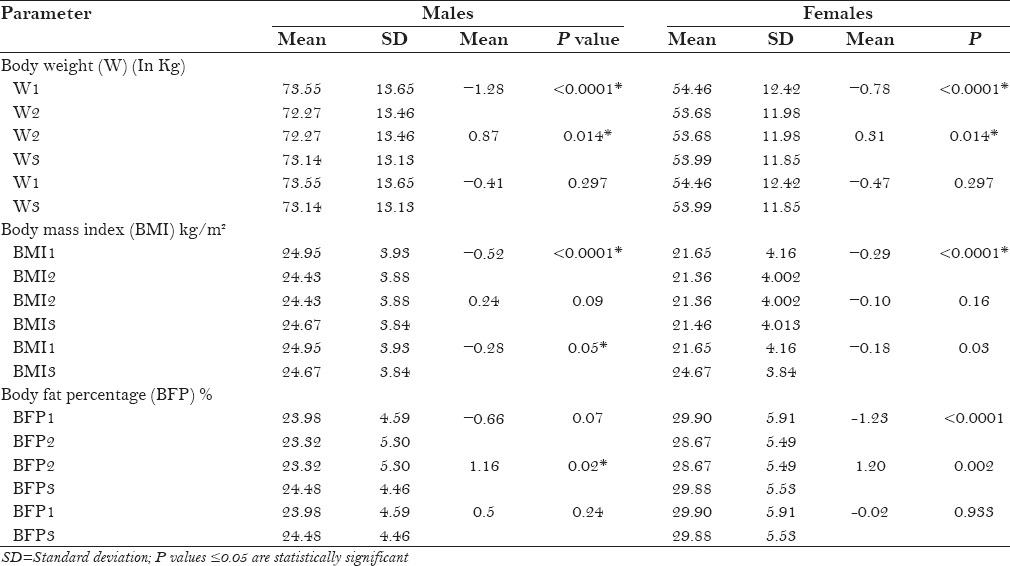
Table 6.
Comparison of changes in the parameters at different time-periods between male and female in the study group
DISCUSSION
Diet and orthodontic treatment, being paradoxical, have a synergistic relation. Diet can affect periodontal health, oral microbe composition, and quantity; wound healing; protein synthesis; immune system function; growth; and intelligence quotient.[6] It is stated that orthodontic treatment creates a physical, physiologic, and emotional stress that in turn increases the nutrient mobilization and utilization, raising the nutritional requirements of the individual.[2] However, during orthodontic treatment it is usually recommend to eat soft food and avoid hard food due to difficulty in chewing, risk of appliance breakage, and associated pain and discomfort. Pain and discomfort are a common sequel for many orthodontic procedures such as separator placement, archwire placement and activations, application of orthopedic forces, and debonding producing pain in patients.[7,8,9,10] A review of literature revealed there is a paucity regarding the studies on the effects of fixed orthodontic treatment on body weight, BMI, and BFP. As a result, there is a need to explore whether patients undergoing fixed orthodontic treatment are potentially at risk of general health. As an attempt to evaluate this concern, a study was designed to investigate the effects of fixed orthodontic treatment on body weight, BMI, and BFP.
The data collected from the final sample was utilized to compare the difference in changes of these parameters between the study and control group. In the second phase, the change in the parameters at time intervals of 1 and 3 months was assessed and compared within the male and female participants separately in the study group. Further, the study compared the effect of the orthodontic treatment between the male and female patients with regard to change in this parameter.
Body weight
The findings in the present study show weight alterations in both males and females of the study group undergoing orthodontic treatment. It is observed that there is a definite weight reduction in the first 1-month period of active orthodontic treatment. Compared to the control group, the study group males showed a mean decrease in weight of 1.44 kg, and this difference was highly significant (P < 0.0001) [Tables 3–5]. In females also, there was a reduction of approximately 1 Kg (0.909 kg) in the first 1-month period which was highly significant (P < 0.0001) [Tables 6 and 7]. However, there was a gradual increase in the weight between both the males and females in the study group between the time periods T2 and T3. Thus, at the end of the 3rd month, the comparative decrease in weight was 0.15 kg in males and 0.5 kg in females, which is not statistically significant compared to the baseline point. At the end of the 3rd month, however, the original weight was not restored, which was not statistically significant.
Table 7.
Tests for equality of variances and means for the parameters between males and females in the study group
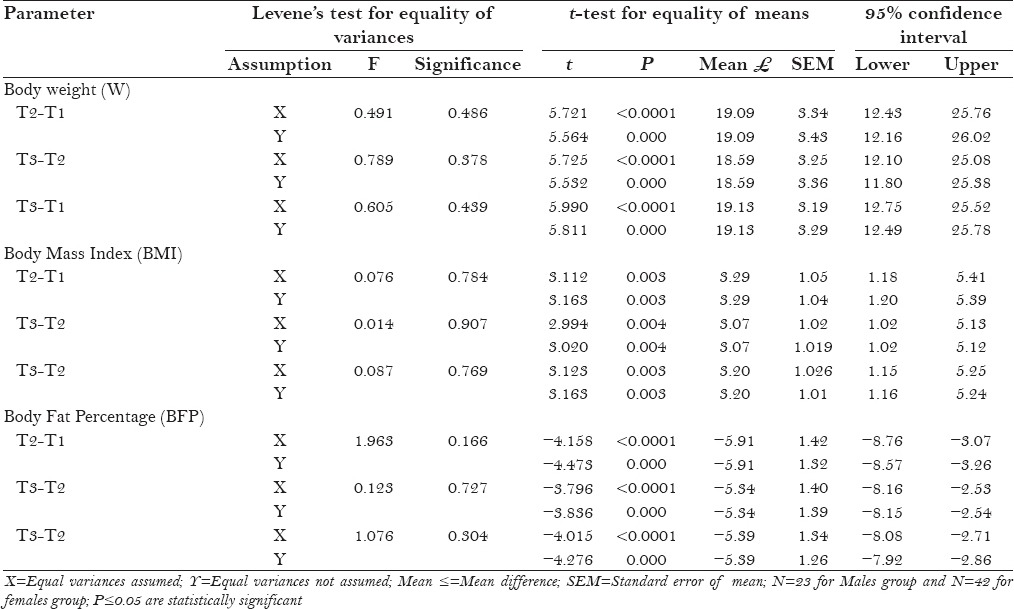
The comparison of the weight changes at a specified interval was made within the study group [Tables 5 and 6]. The weight loss in the study group males within the first month was highly significant with a mean difference of 1.28 (P < 0.0001) and in females with a mean difference of 0.78 (P < 0.0001).
It was predicted that, with the initial archwires, there is pain in the tooth that results in avoidance of hard food that causes pain. Discomfort while eating traditional dishes and spicy food promotes to lose pleasure to eat.[11,12] There was a significant weight loss observed in females whereas males showed insignificant results from 1st to 3rd month in this study. According to Wardle et al.,[13] women were more likely than men to report avoiding high fat foods, eating fruit and fiber, and limiting salt. The weight loss was more expected in females. On the contrary, our findings indicate that the absolute weight loss as well as the relative proportion of the weight loss in more marked in males in the first month. It is possible that differences in food priority between genders shows changes in weight loss or gain as body weight depends on food intake.
Body mass index
The change in the weight may reflect the changes in BMI. The changes in BMI were also in tune with the changes in the body weight. [Tables 3–7]. However, at the end of the 3-month period, the overall reduction in BMI in both the males (P = 0.002) and females (P = 0.05) in the study group was statistically significant compared to the control group. A direct comparison of the males and females in the study group with regard to change in the BMI was assessed [Tables 5 and 6]. Except for the difference in mean values in the first month (−0.22), none of the changes were statistically significant.
Body fat percentage
Loss of weight may alter the percentage of fat composition in the body. This study also evaluated the effect of changes in weight on the BFP. The findings in the present research shows BFP alterations in both males and females in the study group compared to the control group [Tables 3–7]. There is a definite fall in the BFP in the first month of the start of the treatment in both the males (−0.661) and females (−1.231). The mean difference of BFP between the study and control group in males was −1.386% and that in females was −1.621%. Both these values are statistically significant at P = 0.005 and P < 0.0001, respectively [Graph 1]. There was a gradual increase in the second phase of the treatment, which resulted in no statistical difference between the control and study group at the end of the 3rd month.
Graph 1.
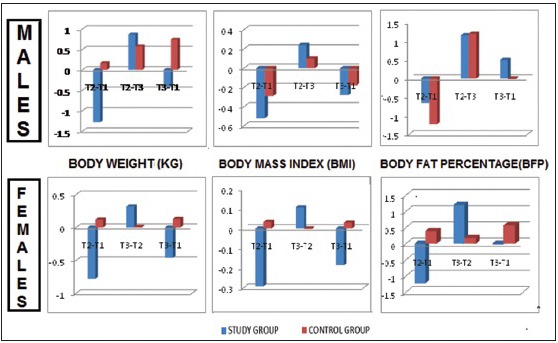
Comparing the changes in weight, body mass index, and body fat percentage of study group and control group
The changes in the BFP in male and female participants of the study groups when assessed at different time periods revealed that the fall in BFP during the initial 1 month was statistically significant as well as its recovery during the second stage till the end of the 3rd month. In males, it was observed that at the end of the 3rd month, there was a positive balance of BFP (0.5) whereas in females it was still the negative balance of BFP, however, it was negligible (−0.02); both are statistically not significant [Graph 2].
Graph 2.
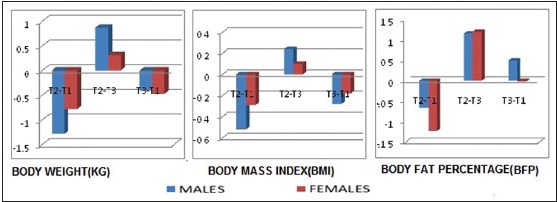
Comparing the changes in weight, body mass index, and body fat percentage of males and females at different points of time study group
Neeley and Gonzales[14] reviewed BMI and influence of sedentary lifestyle and consumption of high energy foods and drinks to alter the BMI and BFP. Although no clear consensus exists, the best-accepted definition for clinically important weight loss is approximately 5% over 6–12 months.[15,16] Schott and Ludwig[17] found that the orthodontic treatment of young patients with removable appliances showed qualitative decrease in BMI over a period of 6 to 36 months.
The percentage of weight loss obtained in our study was maximum in the first month with males showing a decline of 1.7% and females exhibiting weight loss of 1.3%. However, this is not progressive as there was again a gradual increase in weight of 1.3% in males and 0.6% in females in the next 2 months. Thus, at the end of the 3rd month, the net percentage of weight loss in males was 0.4% and 0.7% in females. Thus, the study indicates the weight loss occurring during the initial stages of orthodontics is not clinically significance.
BMI[18] is the method most typically used to quantify body weight of a person in relation to their body surface. It is a numerical index used to classify a person's weight in relation to “normal,” and is typically defined as the weight in kilograms divided by the square of height in meters. Although BMI is an accepted measurement for categorizing obesity, it does not distinguish between lean and fatty tissues.[19] BIA is a noninvasive method and it has been applied in epidemiological studies;[20] the method was used in this study.
Unfortunately, there are no prior studies available to compare the results of our study. One of the main limitation of the present study is that it did not consider the examination of patients into categories based on their initial BMI and BFP. The loss of weight observed in this study may be attributed to a multitude of factors such as soft tissue irritation due to the appliance itself, psychological stress, and baseline dietary habits of the participants. Patients do not consider suggestions given by the practitioner regarding food intake and follow their own pattern of food intake.[21] This study can be further investigated with inclusion of other variables such as qualitative parameters in a questionnaire format regarding type of food (hard, medium soft, soft diet) nature of food (high calorie or low calorie), mode of intake (liquid or solid), intensity and quantity of intake, oral hygiene, pain, discomfort, and among different geographical locations to make it more valid. Further studies are warranted with increased sample size and inclusion of other variables.
However, it is important to know the negative consequences of such side effects to produce evidence of the quality of care orthodontists deliver to patients. Understanding patient's experiences during treatment may help to improve patient attitudes toward the treatment and allow them to cope and adapt to potential side effects.[22] It will also help shape the process of informed consent and provide patients with realistic expectations on what they may experience during the course of the treatment.
CONCLUSION
There were definite changes in the weight, BMI, and BFP in the patients undergoing orthodontic treatment
The changes were more pronounced at the end of 1 month and there was definite loss in weight, BMI, and total BFP
Restoration toward normalcy was noted after 1 month but full regain of the original parameters was not noted even after three months.
Further studies are warranted with an increased sample size and inclusion of other variables.
Declaration of patient consent
The authors certify that they have obtained all appropriate patient consent forms. In the form the patient(s) has/have given his/her/their consent for his/her/their images and other clinical information to be reported in the journal. The patients understand that their names and initials will not be published and due efforts will be made to conceal their identity, but anonymity cannot be guaranteed.
Financial support and sponsorship
Nil.
Conflicts of interest
There are no conflicts of interest.
REFERENCES
- 1.Baldwin DC. Appearance and aesthetics in oral health. Community Dent Oral Epidemiol. 1980;9:244–56. doi: 10.1111/j.1600-0528.1980.tb01296.x. [DOI] [PubMed] [Google Scholar]
- 2.Ajmera AJ, Tarvade SS, and Patni VR. A systematic nutritional and dietary guideline for orthodontic patients. J Orthod Res. 2015;3:88–91. [Google Scholar]
- 3.Kopelman P. Obesity as a medical problem. Nature. 2000;404:635–43. doi: 10.1038/35007508. [DOI] [PubMed] [Google Scholar]
- 4.Sun S, Chumelea WC, Heymsfield SB, Lukaski HC, Schoeller D, Friedl K, et al. Development of bioelectric impedance analysis prediction equations for body composition with the use of a multi component model for use in epidemiological surveys. Am J Clin Nutr. 2003;77:331–40. doi: 10.1093/ajcn/77.2.331. [DOI] [PubMed] [Google Scholar]
- 5.Deurenberg-Yap M, Schmidt G, van Staveren WA, Deurenberg P. The paradox of low body mass index and high body fat percentage among Chinese, Malays and Indians in Singapore. Int J Obes Relat Metab Disord. 2000;24:1011–7. doi: 10.1038/sj.ijo.0801353. [DOI] [PubMed] [Google Scholar]
- 6.Rosenbaum M, Leibel RL. The physiology of body weight regulation: Relevance to the etiology of obesity in children. Pediatrics. 1998;101:525–39. [PubMed] [Google Scholar]
- 7.Farzanegan F, Zebarjad SM, Alizadeh S, Ahrari F. Pain reduction after initial in archwire placement orthodontic patients: A randomized clinical trial. Am J Orthod Dentofacial Orthop. 2012;141:169–73. doi: 10.1016/j.ajodo.2011.06.042. [DOI] [PubMed] [Google Scholar]
- 8.Krukemeyer AM, Arruda AO, Inglehart MR. Pain and Orthodontic Treatment. Angle Orthod. 2009;79:1175–81. doi: 10.2319/121308-632R.1. [DOI] [PubMed] [Google Scholar]
- 9.Kavaliauskiene A, Smailiene D, Buskiene I, Keriene D. Pain and discomfort perception among patients undergoing orthodontic treatment: Results from one month follow-up study. Stomatologija. 2012;14:118–25. [PubMed] [Google Scholar]
- 10.Kolenda J, Fischer-Brandies H, Ciesielski R, Koos B. Oral health related quality of life after orthodontic treatment for anterior tooth alignment: Association with emotional state and sociodemographic factors. J Orofac Orthop. 2016;77:138–45. doi: 10.1007/s00056-016-0018-4. [DOI] [PubMed] [Google Scholar]
- 11.Marcenes W, Steele JG, Sheiham A, Walls AW. The relationship between dental status, food selection, nutrient intake, nutritional status, and body mass index in older people. Cad Saude Publica. 2003;19:809–16. doi: 10.1590/s0102-311x2003000300013. [DOI] [PubMed] [Google Scholar]
- 12.Herne S. Research on food choice and nutritional status in elderly people: A review. BF J. 1995;97:12–29. [Google Scholar]
- 13.Wardle J, Haase AM, Steptoe A, Nillapun M, Jonwutiwes K, Bellisle F. Gender differences in food choice: The contribution of health beliefs and dieting. Ann Behav Med. 2004;27:107–16. doi: 10.1207/s15324796abm2702_5. [DOI] [PubMed] [Google Scholar]
- 14.Neeley WW, Gonzales DA. Obesity in adolescence: Implications in orthodontic treatment. Am J Orthod Dentofacial Orthop. 2007;131:581–8. doi: 10.1016/j.ajodo.2006.03.028. [DOI] [PubMed] [Google Scholar]
- 15.Barrocas A, Belcher D, Champagne C, Jastram C. Nutrition assessment practical approaches. Clin Geriatr Med. 1995;11:675–709. [PubMed] [Google Scholar]
- 16.White JV, Ham RJ, Lipschitz DA, Dwyer JT, Wellman NS. Consensus of the nutrition screening initiative: Risk factors and indicators of poor nutritional status in older Americans. J Am Diet Assoc. 1991;91:783–7. [PubMed] [Google Scholar]
- 17.Schott TC, Ludwig B. Quantification of wear-time adherence of removable appliances in young orthodontic patients in relation to their BMI: A preliminary study. Patient Prefer Adherence. 2014;8:1587–95. doi: 10.2147/PPA.S69586. [DOI] [PMC free article] [PubMed] [Google Scholar]
- 18.Kushner R, Blatner D. Risk assessment of the overweight and obese patient. J Am Diet Assoc. 2005;105:S53–62. doi: 10.1016/j.jada.2005.02.014. [DOI] [PubMed] [Google Scholar]
- 19.McCarthy HD, Cole TJ, Fry T, Jebb SA, Prentice AM. Body fat reference curves for children. Int J Obes. 2006;30:598–602. doi: 10.1038/sj.ijo.0803232. [DOI] [PubMed] [Google Scholar]
- 20.Dehghan M, Merchant AT. Is bioelectrical impedance accurate for use in large epidemiological studies? Nutr J. 2008;7:26. doi: 10.1186/1475-2891-7-26. [DOI] [PMC free article] [PubMed] [Google Scholar]
- 21.Azaripour A, Willershausen I, Hassan M, Ebenezer S, Willershausen B. Oral hygiene and dietary habits in adolescents with fixed orthodontic appliances: A cross-sectional Study. J Contemp Dent Pract. 2016;17:179–83. doi: 10.5005/jp-journals-10024-1824. [DOI] [PubMed] [Google Scholar]
- 22.Grad FP. The preamble of the constitution of the World Health Organization. Bull World Health Organ. 2002;80:981–4. [PMC free article] [PubMed] [Google Scholar]


