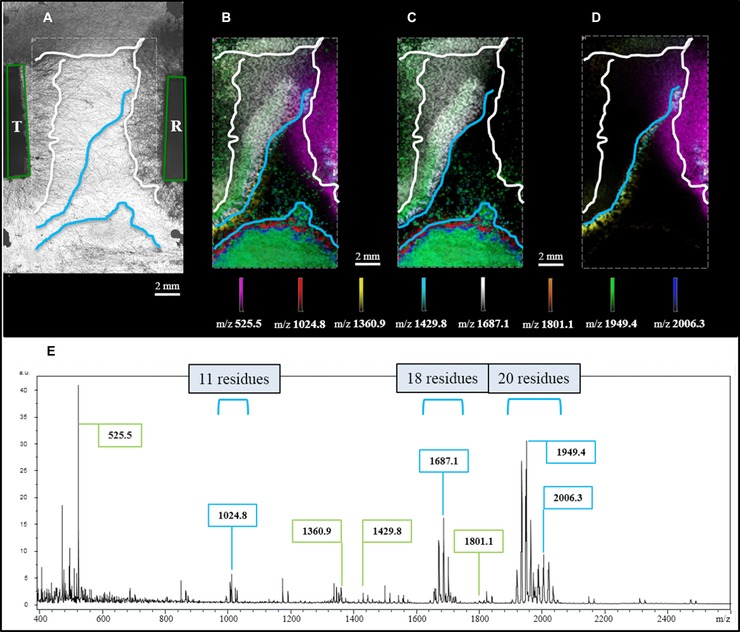
Figure 2.

MALDI MSI of physically interacting T. atroviride (T) and R. solani (R) hyphae. (A) Light microscopic image showing points of inoculation (green tetragons), the outer rim of hyphal growth for both species (white lines) and borders for features detected by MSI (blue lines). (B) Molecular distributions of selected secondary metabolites localized by MALDI MSI. (C) T. atroviride specific metabolites (Supporting Information S3). (D) R. solani specific metabolites (Supporting Information S4). (E) Profile mass spectrum exhibiting signals assigned to R. solani (marked in green) and T. atroviride (marked in blue).
