

Abstract
Pancreatic cancer is one of the most lethal digestive system cancers with a 5‐year survival rate of 4–7%. Despite extensive efforts, recent chemotherapeutic regimens have provided only limited benefits to pancreatic cancer patients. Gemcitabine and TS‐1, the current standard‐of‐care chemotherapeutic drugs for treatment of this severe cancer, have a low response rate. Hypoxia is one of the factors contributing to treatment resistance. Specifically, overexpression of hypoxia‐inducible factor, a master transcriptional regulator of cell adaption to hypoxia, is strongly correlated with poor prognosis in many human cancers. TAT‐ODD‐procaspase‐3 (TOP3) is a protein prodrug that is specifically processed and activated in hypoxia‐inducible factor‐active cells in cancers, leading to cell death. Here, we report combination therapies in which TOP3 was combined with gemcitabine or TS‐1. As monotherapy, gemcitabine and TS‐1 showed a limited effect on hypoxic and starved pancreatic cancer cells, whereas co‐treatment with TOP3 successfully overcame this limitation in vitro. Furthermore, combination therapies of TOP3 with these drugs resulted in a significant improvement in survival of orthotopic pancreatic cancer models involving the human pancreatic cancer cell line SUIT‐2. Overall, our study indicates that the combination of TOP3 with current chemotherapeutic drugs can significantly improve treatment outcome, offering a promising new therapeutic option for patients with pancreatic cancer.
Keywords: Gemcitabine, hypoxia inducible factor, pancreatic cancer, TOP3, TS‐1
Despite breakthroughs in cancer treatment, pancreatic cancer remains one of the most intractable solid tumors with a 5‐year survival rate of 4–7% in most reports.1, 2 During the last 40 years, the 5‐year survival rate of pancreatic cancer patients has only improved from 2% to 6%.3 At the time of diagnosis, 70–80% of patients have already progressed to locally advanced stage or metastatic disease. Gemcitabine and 5‐fluorouracil (5‐FU), pyrimidine analogs of cytidine and uracil, respectively, are classified as antimetabolite drugs. Both block progression of the cell cycle by competing with functional nucleoside triphosphates during DNA replication and eventually induce cell death.4, 5 5‐fluorouracil also hinders thymidylate synthase, and therefore blocks synthesis of thymidine and inhibits DNA replication.4 The diphosphate of gemcitabine also functions as an inhibitor for ribonucleotide reductase and inactivates this key enzyme, leading to a decrease in deoxynucleotide pools.5 TS‐1 is based on a biochemical modulation of 5‐FU and contains tegafur, gimeracil, and oteracil potassium in a molar ratio of 1:0.4:1 to enhance its anticancer activity while reducing its toxicity to the gastrointestinal tract.6 Gemcitabine and TS‐1 are often considered standard drugs for pancreatic cancer and are used as monotherapy or in combination with each other.7, 8 However, it has been reported that only 25–30% of patients respond to these chemotherapeutic treatments.9 Histopathologically, most pancreatic cancers are characterized by severe desmoplasia that results from extensive production of ECM components by pancreatic stellate cells.10 As a result, the pancreatic tumors are surrounded by a condensed desmoplastic layer and usually contain several regions with limited vasculature network and nutrition.11 This specific type of environment, termed tumor hypoxia, is characteristic of pancreatic cancer12 and has been identified as the main obstacle to treatment.13
Hypoxia‐inducible factor (HIF) is strongly correlated with poor prognosis of pancreatic cancer patients.14 Hypoxia‐inducible factor is a heterodimeric transcription factor composed of an oxygen‐dependent α‐subunit and a constitutively expressed β‐subunit, and binds to the hypoxia‐response elements (HREs) of a wide range of transcriptional targets to induce their expression.15 The transcriptional activity of HIF relies primarily on availability of the HIF‐α subunit, which is mainly regulated by prolyl‐hydroxylation and ubiquitin‐mediated proteasomal degradation under normoxic conditions. Three isoforms of HIF‐α encoded by distinct genes have been identified. Of these isoforms, HIF‐1α and HIF‐2α have a similar structure containing an oxygen‐dependent degradation (ODD) domain. In cancer cells, HIF regulates hundreds of genes related to the malignant phenotype including genetic instability, sustained angiogenesis, metabolic reprogramming, autocrine growth factor signaling, evasion of apoptosis, invasion/metastasis, and resistance to treatment.16 Thus, HIF is a commander of malignant cancer progression and targeting HIF becomes a cogent strategy.
We have been focusing on targeting HIF‐active cells through a unique and HIF‐specific mechanism in hypoxic cancer cells. Our original fusion protein prodrug TAT‐ODD‐procaspase‐3 (TOP3) and its variant POP33 have shown prospective effects in a variety of cancer cell lines in vitro,17, 18 and also in vivo.19, 20, 21 The defined mechanism of the protein was also confirmed as the research progressed. Specifically, TOP3 protein contains a TAT domain that is derived from HIV and facilitates penetration of the protein through the mammalian phospholipid bilayer membranes. The second domain, the ODD, which is derived from HIF‐1α, confers the hypoxia selective property of the fusion protein by causing the protein to be degraded in normoxic cells or remain stable in hypoxic cells. Under stressful conditions, activated caspase‐3 derived from the procaspase‐3 domain will cause the hypoxic cells to undergo apoptosis.
This clear activity of TOP3 and the limitations of current chemotherapy inspired us to combine TOP3 with gemcitabine and TS‐1. The combination treatment successfully suppressed both normoxic and hypoxic cancer cells and significantly extended survival of mice bearing orthotopic pancreatic tumors.
Materials and Methods
Construction and purification of TOP3 fusion protein
pGEX‐6P‐3/GST‐TAT‐ODD/3‐0‐Casp3WT (TOP3)18 was transformed into SoluBL21‐competent Escherichia coli (Genlantis, San Diego, CA, USA) to express GST‐TOP3 protein, which was purified using glutathione agarose (Sigma‐Aldrich, St. Louis, MO, USA). Subsequently, the GST tag was cleaved by PreScission Protease (GE Healthcare, Little Chalfont, UK) according to the manufacturer's instructions.
Cell culture and hypoxic induction in vitro
SUIT‐2 human pancreatic cancer cells were purchased from the Japanese Cancer Research Resource Bank (Osaka, Japan) and established SUIT‐2/HRE‐Luc cells20 were cultured in DMEM (Life Technologies, Carlsbad, CA, USA) supplemented with 5% FBS, penicillin (100 U/mL) and streptomycin (100 μg/mL) (Nacalai Tesque, Kyoto, Japan) in a multigas incubator (Panasonic, Osaka, Japan). For the hypoxic experimental setup, a hypoxic incubator (Astec, Fukuoka, Japan) or hypoxic chamber (Ruskinn, Bridgend, UK) was used to attain an oxygen level of 1% or 0.1%, respectively, depending on the experiment.
Luciferase assay
SUIT‐2/HRE‐Luc cells were seeded at 5 × 10⁴ cells in 24‐well plates and precultured in normoxia for 12 h. Subsequently, the cells were further incubated using the hypoxic incubator in 1% O2 for the indicated time and directly lysed by 100 μL Passive Lysis Buffer (Promega, Madison, WI, USA). The cell lysate was centrifuged at 16 000g and 4°C for 3 min and the luciferase activity was measured using 10 μL supernatant with 20 μL Luciferase assay reagent (Promega).
Dual luciferase assay
The pEF/HRE‐RLuc plasmid was constructed by substituting the coding sequence of firefly luciferase (FLuc) in pEF/HRE‐FLuc.18 The coding sequence of Renilla luciferase (RLuc) was amplified from pRluc (pRL‐CMV) (Promega). VHL‐786‐O cells (5 × 10⁴ cells/well) were seeded in a 24‐well plate. After overnight incubation, pEF/HRE‐RLuc was cotransfected with pEF‐FLuc using X‐treamGENE reagent (Roche Diagnostics, Indianapolis, IN, USA) according to the manufacturer's instructions. The cells were further incubated in 21% or 1% O2 for 16 h and harvested for analysis using the Dual‐luciferase Reporter Assay system (Promega). Bioluminescence signals of RLuc were divided by those of FLuc to normalize the signal.
Western blot analysis
Cells were seeded at 1 × 10⁵ cells in 35‐mm dishes, pre‐incubated for 12 h in normoxia, and further cultured in hypoxia (1% O2) for the indicated time. Cell lysates were collected after addition of 200 μL of 2× sample buffer (125 mM Tris‐HCl [pH 6.8], 2% SDS, 20% glycerol, 10% β‐mercaptoethanol, and 0.01% bromophenol blue). The samples were electrophoresed on a 10% SDS‐polyacrylamide gel and separated proteins were transferred to a PVDF membrane filter (Merck, Darmstadt, Germany). Actin, HIF‐1α, and HIF‐2α on the filter were probed with the following antibodies: mouse anti‐actin (A4700; Sigma‐Aldrich), rabbit anti‐HIF‐1α (NB100‐134) and rabbit anti‐HIF‐2α (NB100‐122) (Novus Biologicals, Littleton, CO, USA), anti‐mouse IgG conjugated with HRP (#7076) and anti‐rabbit IgG conjugated with HRP (#7074) (Cell Signaling Technology, Danvers, MA, USA). Binding was detected with Chemi‐Lumi One Ultra, a chemiluminescence detection reagent (Nacalai Tesque).
Cell proliferation assay
Cells were seeded at a density of 2 × 10³ cells/well in 96‐well plates and pre‐incubated for 12 h in normoxia. TS‐1 (Taiho, Tokyo, Japan) and gemcitabine (Fluorochem, Hadfield, UK) were added to the medium as a dilution series of 0–1000 μM and 0–100 nM, respectively, before incubation in 21%, 1%, or 0.1% O2. After incubation for 72 h, 10 μL WST‐1 reagent (Roche Diagnostics) was added to each well. After a 3‐h incubation in normoxia, the optical density (450 nm) of each well was measured with the reference optical density (750 nm) using a microplate reader Model 680XR (Bio‐Rad, Hercules, CA, USA).
Calcein AM cell viability assay
Cells were seeded at 1 × 10³ cells in 96‐well plates and preincubated overnight in normoxia. Immediately after addition of 5‐FU (Sigma‐Aldrich) or gemcitabine at the indicated concentrations, the plates were incubated under 21%, 1%, or 0.1% O2 conditions for 72 h. The cells were washed with 100 μL 1× DW buffer (Trevigen, Gaithersburg, MD, USA), which was replaced with new DW buffer containing 1 μM calcein AM. The plates were then incubated in normoxia for 30 min and the fluorescence intensity was measured using an Infinite F500 (Tecan, Männedorf, Switzerland) with excitation/emission of 485 nm/535 nm.
Flow cytometry analysis of apoptotic cells
Cells were seeded at 1.5 × 10⁵ cells/well in 6‐well plates and precultured in normoxia overnight. For the samples in hypoxia, the medium was replaced with fresh medium containing 0.2% FBS and 500 mg/L glucose, and gemcitabine (15 nM) or 5‐FU (50 μM) was added on the following day. The plates were then incubated in the hypoxic incubator at 1% O2 for 30 h before addition of TOP3 (20 μg/mL) and further incubation under the same conditions for 18 h. Cells were prepared with hypotonic fluorochrome solution (50 μg/mL PI in 0.1% sodium citrate–0.1% Triton X‐100) as previously described17 and analyzed by an EC800 Analyzer (Sony, Tokyo, Japan). For samples in severe hypoxia, the culture medium was DMEM supplemented with 0.1% FBS and 100 mg/L glucose under 0.1% oxygen in the hypoxic chamber and cells were treated with the same doses of gemcitabine, 5‐FU, and TOP3.
Animal experiments
Five‐week‐old BALB/c nu/nu male mice were purchased from Oriental Yeast Co. Ltd. (Tokyo, Japan) and the in vivo experiments were started when the mice were 7 weeks old. Animal experiments were carried out with approval from the Animal Experiment Committees of Tokyo Institute of Technology (Tokyo, Japan) and according to relevant national and international guidelines.
Orthotopic transplantation and in vivo imaging to monitor progression of cancer cells
Transplantation was carried out as previously described.20, 22, 23 In brief, SUIT‐2/HRE‐Luc cells (1 × 10⁵ cells/10 μL PBS) were mixed with an equal volume of Geltrex (Life Technologies) and injected directly into the exposed pancreas using a 27‐G syringe. One week after transplantation, we started to monitor HIF activity in the hypoxic cells by the corresponding bioluminescent intensity. Mice were anesthetized by isoflurane (Wako, Tokyo, Japan) and i.p. injected with 200 μL d‐Luciferin (Promega; 10 mg/mL in PBS). Bioluminescent images were obtained 15 min after injection every 4 days using the IVIS spectrum (Perkin Elmer, Waltham, MA, USA) with an exposure time of 1 min. When the photon counts were approximately 1 × 10⁵ photons/s for each region of interest, the mice were randomly divided into control and treatment groups for experiments.
Drug preparation and administration
TOP3 was i.p. injected into tumor‐bearing mice at a dose of 10 mg/kg at 3‐ or 4‐day intervals. TS‐1 was dissolved in 0.5% (w/v) hydroxypropyl methylcellulose (Shin‐Etsu Chemical, Tokyo, Japan) and the mice were treated with 10 mg/kg TS‐1 for five consecutive days per week by oral gavage. Gemcitabine was dissolved in PBS and given i.p. to the mice at a dose of 50 mg/kg every 3 days. For combination treatments, the dosage and treatment schedule of single and combination treatments are shown in Table 1. The concentration of TS‐1 throughout the experiment was calculated based on the concentration of the active component 5‐FU.
Table 1.
Treatment schedule for in vivo experiments in which TAT‐ODD‐procaspase‐3 (TOP3) was combined with gemcitabine (Gem) or TS‐1 in a SUIT‐2 orthotopic pancreatic cancer model
| Group | n | Drug | Dose, mg/kg | Schedule |
|---|---|---|---|---|
| Control | 9 | – | – | – |
| TOP3 | 8 | TOP3 | 10 | Every 3 days, i.p. |
| Gem | 8 | Gem | 50 | Every 3 days, i.p. |
| TOP3+Gem | 8 | TOP3 | 10 | Every 3 days, start at day +1 |
| Gem | 50 | Every 3 days, start at day 0 | ||
| Control | 8 | – | – | – |
| TOP3 | 7 | TOP3 | 10 | Every 4 days, i.p. |
| TS‐1 | 8 | TS‐1 | 10 | 5 consecutive days/week, p.o. |
| TOP3+TS‐1 | 8 | TOP3 | 10 | Every 4 days, i.p. |
| TS‐1 | 10 | 5 consecutive days/week, p.o. |
n, number of treated mice; i.p., intraperitoneal injection; p.o., oral administration.
Statistical analysis
Data are represented as mean ± SEM and significant differences were calculated by unpaired Student's t‐test unless otherwise indicated. For in vivo experimental data, ANOVA was used to analyze differences between group means. Overall significant difference among group means was analyzed using Tukey's honest significant difference. For survival analysis, the Kaplan–Meier method was used to determine survival curves, and comparisons between the curves were carried out by log–rank test in R analysis. For each comparison, P‐values < 0.05 were considered statistically significant.
Results
Evaluation of the reporter system specific for HIF‐active cells
The reporter gene HRE‐Luc includes a promoter containing five copies of the HRE of human vascular endothelial growth factor (VEGF) gene in its 5′‐flanking region24 and generates bioluminescence in a HIF‐dependent manner, allowing us to monitor the progression of HIF‐active tumors in vivo.20, 21 SUIT‐2/HRE‐Luc cells express both HIF‐1α and HIF‐2α proteins and bioluminescence produced by the cells correlated well with expression of these proteins (Fig. 1a,b). Although HRE was well characterized as a HIF‐1 binding site,24 HIF‐2 may also be able to bind to the HRE because VEGF expression was reported to be regulated by HIF‐2 as well as HIF‐1.25 We examined the response of the HRE‐Luc reporter gene in 786‐O, a renal cell carcinoma cell line that harbors a mutation in the von Hippel‐Lindau (VHL) gene and expresses only HIF‐2α.26 Expression of HRE‐luciferase in 786‐O‐VHL cells, in which a functional VHL gene has been introduced, was significantly increased by hypoxic treatment (Fig. 1c), indicating that HIF‐2 also functions as transcription factor for the HRE promoter. Therefore, an in vivo model using this cell line can be used to monitor both HIF‐1 and HIF‐2 activities.
Figure 1.

The hypoxia‐response element–luciferase (HRE‐Luc) reporter system is suitable for evaluation of hypoxia‐inducible factor (HIF) activity. (a, b) SUIT‐2/HRE‐Luc cells cultured under normoxic conditions were exposed to hypoxic conditions (1% O2) for the indicated time periods and luciferase activity (a) and HIF‐α protein levels (b) were analyzed. The bioluminescent intensity of luciferase is shown as relative light units (RLU) (n = 3). (c) 786‐O‐VHL cells were established by introducing wild‐type von Hippel‐Lindau (VHL) expression vector into VHL‐null 786‐O cells. 786‐O‐VHL cells were cotransfected with pEF/HRE‐RLuc and pEF/FLuc reporter plasmids and cultured under normoxic (21% O2) or hypoxic (1% O2) conditions. The bioluminescent intensity of RLuc was divided by that of FLuc and the normalized signal is shown as relative luciferase activity (n = 3). *P < 0.05. The experiments were repeated three times and representative data are shown.
Effect of gemcitabine and 5‐FU on SUIT‐2 cells in vitro
Gemcitabine and 5‐FU (the core drug of TS‐1) have been proved to be effective in the induction of cell death and growth inhibition of several pancreatic cancer cell lines including AsPC‐1, Capan‐1, MIA PaCa‐2, and T3M4,27 and BxPC‐3, CFPAC‐1, and SUIT‐2,28 with different sensitivities to the drugs. We examined the influence of oxygen concentration on the effect of gemcitabine and 5‐FU on SUIT‐2 cells by WST‐1 proliferation and calcein AM cell viability assays under normoxic (21% O2), hypoxic (1% O2), and severely hypoxic (0.1% O2) conditions (Fig. 2). The effect of gemcitabine was influenced by only the hypoxic (1% O2) treatment (Fig. 2a,b), whereas the effect of 5‐FU was influenced by severely hypoxic conditions (Fig. 2c,d). The IC50 of gemcitabine increased two‐fold from 5.0 to 10.1 nM when the cells were exposed to hypoxia. In the case of 5‐FU, the IC50 was 280 μM under severely hypoxic conditions compared to 38 μM in normoxia, representing a greater than seven‐fold increase in 5‐FU resistance. The summaries of significant values are indicated in Tables S1 and S2.
Figure 2.
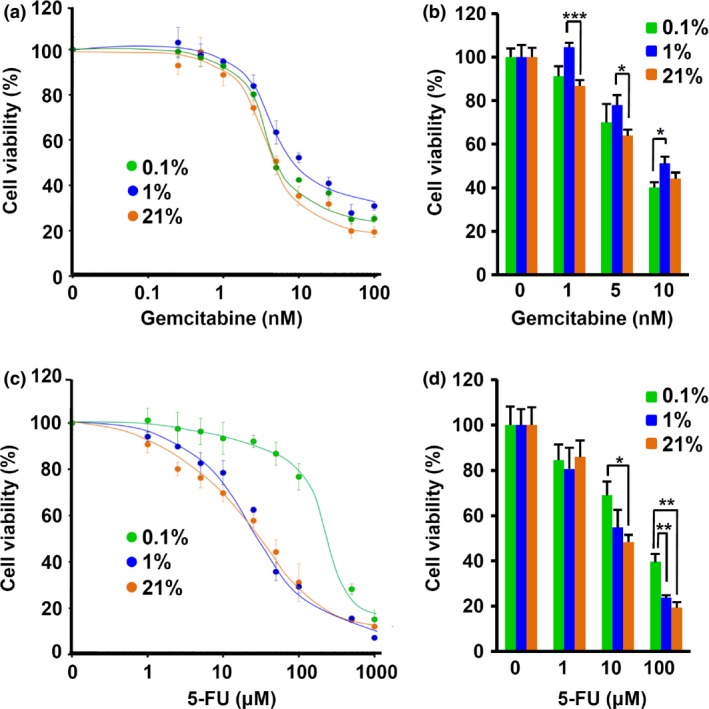
The SUIT‐2 pancreatic cancer cell line is resistant to gemcitabine and 5‐FU under hypoxic conditions. WST and calcein AM cell viability assays were carried out for SUIT‐2 cells treated with gemcitabine (a, b) and 5‐FU (c, d) for 72 h (n = 4 or 5). *P < 0.05, **P < 0.01, ***P < 0.001. The percentage cell viability was normalized to the viability of untreated cells for each condition. These data are representative of three independent experiments.
Effects of TOP3 in combination with gemcitabine or 5‐FU on pancreatic cancer cells in vitro
Because of the resistance of SUIT‐2 to gemcitabine and 5‐FU in hypoxia (1% O2) and severe hypoxia (0.1% O2), respectively, we expected that combination treatments of TOP3 with gemcitabine or 5‐FU would more efficiently decrease the viability of both normoxic and hypoxic cancer cells. To mimic in vivo conditions in tumor hypoxia, SUIT‐2 cells were cultured in medium containing low FBS and low glucose (starved medium) in hypoxia (1% O2). As observed in highly malignant cells,29, 30, 31 SUIT‐2 is highly adapted to hypoxia and its viability was not significantly influenced by hypoxic treatment alone (Fig. 3a). However, SUIT‐2 cells cultured in the starved medium under hypoxic (1% O2) and severely hypoxic (0.1% O2) conditions showed a significantly increased susceptibility to TOP3 compared with cells under normoxic conditions (Fig. 3b,c), suggesting that the starvation conditions increased stress responses in the cells, leading to activation of caspases and eventually to TOP3 activation. Treatment with TOP3 alone under starvation and hypoxic conditions successfully induced apoptotic cell death, as indicated by a significant increase in the sub‐G1 fraction in flow cytometry analysis. Under 1% O2 and starved conditions (Fig. 3b), although the effect of gemcitabine was completely abolished, the effect of 5‐FU was similar to that under normoxic conditions and showed an additive effect in combination with TOP3. However, under 0.1% O2 and starved conditions (Fig. 3c), the effects of gemcitabine and 5‐FU were reduced compared with normoxic conditions; only TOP3 effects were observed under these conditions, confirming the reduced effect of gemcitabine and 5‐FU under hypoxic conditions (Fig. 2b,d). These results strongly suggested that TOP3 targets distinct cell populations from gemcitabine and 5‐FU.
Figure 3.
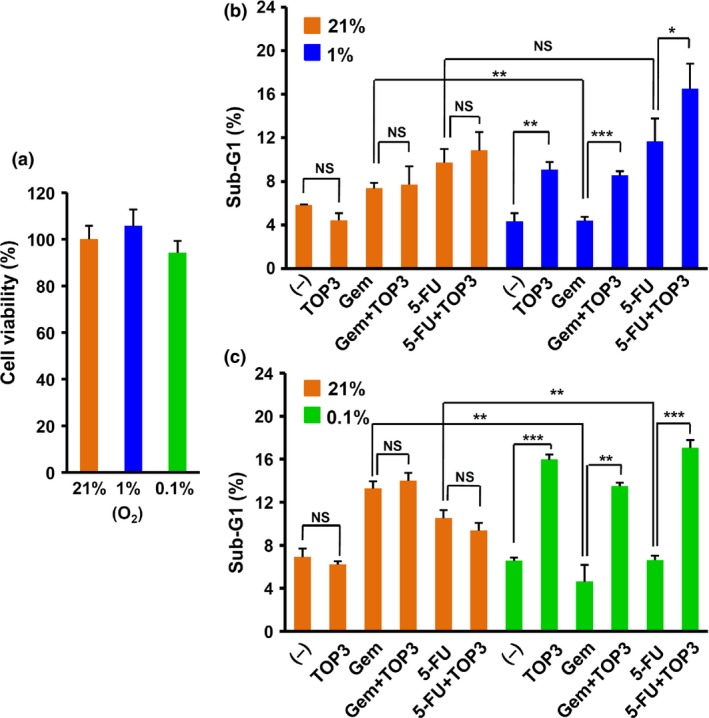
Effects of drugs on pancreatic cancer cells under conditions of oxygen and nutrient shortage. (a) Viability of SUIT‐2 cells after hypoxic (0.1% and 1% O2) treatment for 72 h determined by WST‐1 assay. The absorbance unit obtained from hypoxia‐treated SUIT‐2 cells was normalized to the absorbance unit of SUIT‐2 cells cultured under normoxic conditions and is shown as cell viability (%). (b, c) SUIT‐2 cells were cultured under starved and hypoxic (1% O2, 0.2% FBS, 500 mg/L glucose) conditions (b) or severely hypoxic and starved (0.1% O2, 0.1% FBS, 100 mg/L glucose) conditions (c) with or without gemcitabine (Gem; 15 nM) or 5‐fluorouracil (5‐FU; 50 μM) for 30 h. TAT‐ODD‐procaspase‐3 (TOP3; 20 μg/mL) was added and the cells were further incubated for 18 h under the same conditions. The DNA content was analyzed by flow cytometry and the sub‐G1 fraction (%) is indicated in the figure (n = 4). *P < 0.05, **P < 0.01, ***P < 0.001. The experiments were repeated three times and representative data are shown. (–), untreated control.
Enhanced antitumor effects of gemcitabine and TS‐1 by combination treatment with TOP3
Motivated by the in vitro results, we next assessed the therapeutic effects of the combination treatments in an orthotopic pancreatic cancer model using SUIT‐2/HRE‐Luc cells,20 in which the luciferase activity was highly correlated with HIF‐α expression (Fig. 1) and thus correlated with HIF activity.15 Using this model, we were able to monitor the progression of HIF‐active cancer cells in real‐time by in vivo bioluminescence imaging of SUIT‐2/HRE‐Luc xenografts. We monitored the bioluminescence every 4 days throughout the experiment (Fig. 4a,b). The drug dosages and schedule of the combination treatments are summarized in Table 1. Hypoxia‐inducible factor activity in the xenografts of untreated mice increased rapidly and the mice eventually died with accumulation of ascites and peritoneal dissemination within 4 weeks after the initial detection of significant HIF‐active signals. In contrast, mice treated with TOP3 showed bioluminescence signals that were localized in the pancreas for longer periods, indicating effective killing of HIF‐active cancer cells in the pancreas. Strikingly, the bioluminescence signals in the mice treated with gemcitabine or TS‐1 were also localized in the pancreas for periods compatible with the signals in the TOP3‐treated mice. As expected, the combination treatment further extended the duration of the localized signal in the pancreas. The bioluminescence signals of gemcitabine‐ and TS‐1‐treated groups were analyzed on days 20 and 16, respectively, because these were the last days that all mice in each control group were alive (Fig. 4c,d). The summary of significant values is indicated in Table S3. The results clearly showed that TOP3 enhanced the efficacy of gemcitabine and TS‐1 against pancreatic cancer in combination treatments.
Figure 4.
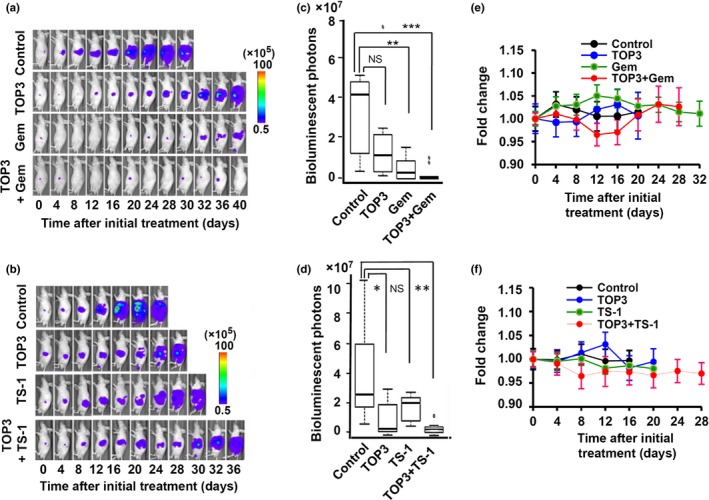
Combination therapies significantly improves outcome in a SUIT‐2 orthotopic pancreatic cancer model. (a, b) Representative images of mice in each group obtained by in vivo imaging. (c, d) Box plots of bioluminescent intensities of tumors in mice of gemcitabine (Gem)‐ and TS‐1‐treated groups at day 20 and 16, respectively, which were the last days that all mice in the control groups were still alive. *P < 0.05, **P < 0.01, ***P < 0.001. (e, f) Body weight of mice in gemcitabine‐ and TS‐1‐treated groups. No significant difference was observed between any groups.
During the experiments, we also examined possible side‐effects of the drugs on treated mice, using weight loss as an indicator. Although some mice temporarily lost weight during the experiment period, the weight of the mice varied by <5% of their body weight with no significant differences (Fig. 4e,f). Diarrhea was observed in TS‐1 monotherapy and TS‐1 combination groups, but other adverse side‐effects, such as jaundice or change of stool colors, were not observed.
Combination treatment successfully prolonged the survival of treated mice
As an important outcome of cancer therapy, we evaluated the survival rate of the mice in each group. The results of this analysis correlated with the bioluminescence signal development; combinations of TOP3 and gemcitabine showed the most prolonged survival rates among the treated mice (Fig. 5a). SUIT‐2 cells showed higher sensitivity to gemcitabine monotherapy at the selected dosage; treatment with gemcitabine resulted in remarkable inhibition of cancer cell growth and more significantly prolonged the survival of the mice than TOP3 monotherapy (Figs. 4c,5a). Combination therapy with gemcitabine and TOP3 further improved survival. Two mice in the combination group survived for more than 100 days after initial treatment with almost complete clearance of HIF‐active cell signals. Interestingly, there was no statistically significant difference between TOP3 and TS‐1 monotherapies in bioluminescence signal suppression and survival improvement (Figs. 4d,5b), indicating equivalent overall efficacy of the prodrug TOP3 and TS‐1. Two mice in the combination group survived until day 50. The summary of significant values is indicated in Table S4.
Figure 5.
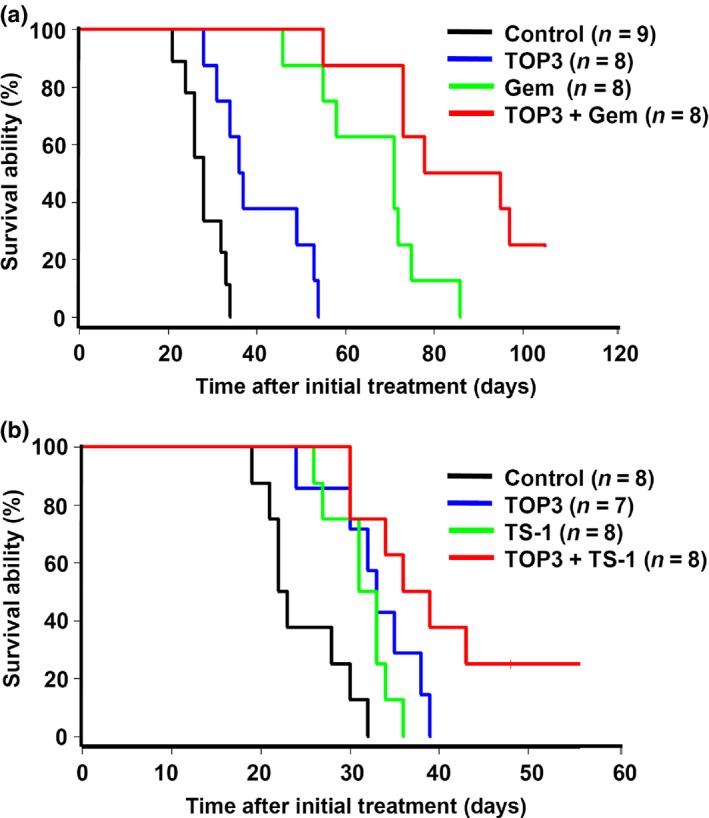
Combination therapies with TAT‐ODD‐procaspase‐3 (TOP3) and gemcitabine (Gem) (a) or TS‐1 (b) improved the survival of treated mice in a SUIT‐2 orthotopic pancreatic cancer model. Survival curves using Kaplan–Meier analysis are shown.
Discussion
In this study, we successfully showed that TOP3 can overcome the limitation of standard chemotherapeutic drugs used for pancreatic cancers – gemcitabine and TS‐1 – when given as a combination treatment with these drugs, and significantly improves survival in an orthotopic pancreatic cancer model.
An overwhelming number of studies have reported that HIF‐active cancers, which are targets of TOP3, are a hallmark of malignancy.32, 33, 34 Hypoxia‐inducible factor‐active cancer cells play especially crucial roles in pancreatic cancers, which are known to have severe desmoplasia and hypoxia.12 In this study, we used the reporter HRE‐Luc to non‐invasively monitor the progression of HIF‐active cells in pancreatic cancers in real‐time. We observed that the increased bioluminescence signals (HIF activity) were well correlated with growth and dissemination of the cancer cells and accumulation of ascites in the abdominal cavity of the mice.20 Noticeably, the bioluminescent signal of HIF‐active cells appeared approximately 1 week after transplantation, suggesting that a hypoxic environment is generated in a very early stage of pancreatic desmoplasia. Monotherapy with TOP3 led to localization of the signals in the pancreas for a longer duration, indicating that selective killing of HIF‐active cells by TOP3 suppressed local invasion and metastasis, and improved the survival rate of pancreatic cancer model mice (Figs. 4a,b,5). These results confirm the role of HIF‐active cells in pancreatic cancer progression and suggest the importance of therapies that target HIF‐active cancers for the treatment of patients with pancreatic cancer.
We confirmed the limited efficacy of gemcitabine and TS‐1 in pancreatic cancers with tumor hypoxia by in vitro data obtained under conditions that mimic tumor hypoxia. Gemcitabine and 5‐FU/TS‐1 cause DNA and RNA damage, which in turn affects cell proliferation and survival. Although we observed a significant effect of these drugs on the viability of normoxic cells, gemcitabine and 5‐FU had no significant effect on cells under hypoxia (1% O2) and severe hypoxia (0.1% O2), respectively (Fig. 2). Moreover, the cytotoxic effects of gemcitabine and 5‐FU were partially and totally abolished under hypoxic and severely hypoxic conditions, respectively, in the starved medium (Fig. 3), strongly suggesting reduced efficacy of these reagents in conditions of tumor hypoxia.
We used both WST‐1 and calcein AM viability assays to exclude the possibility that the reliability of the WST‐1 assay was affected by impairment of mitochondria after long‐term incubation in hypoxia, as reported in other cell lines.35 Overall, both assays gave consistent results with similar resistance patterns for each drug under hypoxic conditions. In fact, the response of the SUIT‐2 cell line to gemcitabine and TS‐1 under normoxia was highly consistent with previous reports.28, 36 Resistance of pancreatic cancer cells to these drugs under hypoxic conditions is often observed, with the proposed mechanism involving phosphatidylinositol 3‐kinase/protein kinase B/nuclear factor‐κB or mammalian target of rapamycin pathways.37, 38 However, the lower resistance of SUIT‐2 to gemcitabine in severe hypoxia (0.1% O2) than in milder hypoxia (1% O2) was described for the first time in our study, and the underlying mechanism is under investigation.
Treatment of subcutaneous (s.c.) tumors with TOP3 induced cell death in severely hypoxic (pimonidazole‐stained) regions and hypoxic regions, which are located closer to tumor blood vessels than the severely hypoxic regions, 12 h after i.p. injection.21 In the orthotopic pancreatic cancer model used here, TOP3 treatment significantly suppressed HIF‐active signal development, indicating that TOP3 was able to effectively remove HIF‐active cells in this model. Remarkably, treatment with gemcitabine and TS‐1 also suppressed HIF‐active signal development at comparable levels to TOP3 (Fig. 4a–d), although SUIT‐2 showed resistance to gemcitabine and 5‐FU under hypoxic conditions (Fig. 2). Furthermore, because the shortage of oxygen and nutrition due to defective blood supply in hypoxic regions can cause cell cycle arrest, rendering the cells more resistant to these chemical drugs (Fig. 3), it is inconceivable that these drugs directly target HIF‐active cells. In the case of gemcitabine, HIF‐active cancer cells under severely hypoxic conditions might be targeted as observed in our in vitro experiments (Fig. 2a,b). Alternatively, it is more likely that these agents induced death of normoxic cancer cells, which reduced the consumption of oxygen and nutrition in normoxic regions and increased their availability to hypoxic regions, making these regions less hypoxic and thus less HIF‐active.
The roles of hypoxic cancers in malignant progression have encouraged several research groups to focus on hypoxia‐activated prodrugs. These drugs are mainly based on moieties that are reduced under hypoxic conditions to become active drugs and include PR‐104A,39 tirapazamine,40 and TH‐302.41 Although these drugs were effective at killing hypoxic cells to some extent, their combination with radiotherapy or chemotherapy rarely yielded positive outcomes.42, 43, 44 These drugs may cause severe off‐target toxicity and are therefore not recommended for long‐term treatment.45 However, our prodrug TOP3 has shown benefits when combined with radiotherapy in xenograft models using the human cervical cancer cell line HeLa and the pancreatic cancer cell line CFPAC‐1; angiogenesis in irradiated s.c. tumors was significantly suppressed by single treatment with TOP3, resulting in significantly delayed tumor growth.19 Additionally, here we revealed the benefits of combining TOP3 with the standard chemotherapy drugs gemcitabine and 5‐FU for the treatment of pancreatic cancer. Overall, our report emphasizes the role of HIF‐active cells in pancreatic cancer treatment and clearly shows the potential of the prodrug TOP3 for the treatment of HIF‐active cancers as monotherapy and combination therapies.
Disclosure Statement
The authors have no conflict of interest.
Supporting information
Table S1. Comparison of cell viability of each pair group in Figure 2(a). P‐values compared using Student's t‐test.
Table S2. Comparison of cell viability of each pair group in Figure 2(c). P‐values compared using Student's t‐test.
Table S3. Comparison of bioluminescent intensities of tumors of each pair group in Figure 4(c,d). P‐values compared using Student's t‐test.
Table S4. Comparison of survival ability of each pair group in Figure 5. P‐values compared using the log–rank test.
Acknowledgments
We thank Taiho Pharmaceutical Co. Ltd. for kindly providing TS‐1 and the drug preparation guidance. This study was carried out as a research program of the Project for Development of Innovative Research on Cancer Therapeutics (P‐Direct), from the Japan Agency for Medical Research and Development.
Cancer Sci 107 (2016) 1151–1158
Funding Information
Japan Agency for Medical Research and Development.
References
- 1. Lemke J, Schafer D, Sander S, Henne‐Bruns D, Kornmann M. Survival and prognostic factors in pancreatic and ampullary cancer. Anticancer Res 2014; 34: 3011–20. [PubMed] [Google Scholar]
- 2. Kleeff J, Michalski C, Friess H, Buchler MW. Pancreatic cancer: from bench to 5‐year survival. Pancreas 2006; 33: 111–8. [DOI] [PubMed] [Google Scholar]
- 3. Siegel R, Ma J, Zou Z, Jemal A. Cancer statistics, 2014. CA Cancer J Clin 2014; 64: 9–29. [DOI] [PubMed] [Google Scholar]
- 4. Longley DB, Harkin DP, Johnston PG. 5‐fluorouracil: mechanisms of action and clinical strategies. Nat Rev Cancer 2003; 3: 330–8. [DOI] [PubMed] [Google Scholar]
- 5. Ewald B, Sampath D, Plunkett W. Nucleoside analogs: molecular mechanisms signaling cell death. Oncogene 2008; 27: 6522–37. [DOI] [PubMed] [Google Scholar]
- 6. Shirasaka T, Nakano K, Takechi T et al Antitumor activity of 1 M tegafur‐0.4 M 5‐chloro‐2,4‐dihydroxypyridine‐1 M potassium oxonate (S‐1) against human colon carcinoma orthotopically implanted into nude rats. Cancer Res 1996; 56: 2602–6. [PubMed] [Google Scholar]
- 7. Berlin J, Benson AB 3rd. Chemotherapy: gemcitabine remains the standard of care for pancreatic cancer. Nat Rev Clin Oncol 2010; 7: 135–7. [DOI] [PubMed] [Google Scholar]
- 8. Oettle H, Riess H. Gemcitabine in combination with 5‐fluorouracil with or without folinic acid in the treatment of pancreatic cancer. Cancer 2002; 95: 912–22. [DOI] [PubMed] [Google Scholar]
- 9. Sheikh R, Walsh N, Clynes M, O'Connor R, McDermott R. Challenges of drug resistance in the management of pancreatic cancer. Expert Rev Anticancer Ther 2010; 10: 1647–61. [DOI] [PubMed] [Google Scholar]
- 10. Apte MV, Park S, Phillips PA et al Desmoplastic reaction in pancreatic cancer: role of pancreatic stellate cells. Pancreas 2004; 29: 179–87. [DOI] [PubMed] [Google Scholar]
- 11. Whatcott CJ, Diep CH, Jiang P et al Desmoplasia in primary tumors and metastatic lesions of pancreatic cancer. Clin Cancer Res 2015; 21: 3561–8. [DOI] [PMC free article] [PubMed] [Google Scholar]
- 12. Koong AC, Mehta VK, Le QT et al Pancreatic tumors show high levels of hypoxia. Int J Radiat Oncol Biol Phys 2000; 48: 919–22. [DOI] [PubMed] [Google Scholar]
- 13. Erkan M, Hausmann S, Michalski CW et al The role of stroma in pancreatic cancer: diagnostic and therapeutic implications. Nat Rev Gastroenterol Hepatol 2012; 9: 454–67. [DOI] [PubMed] [Google Scholar]
- 14. Spivak‐Kroizman TR, Hostetter G, Posner R et al Hypoxia triggers hedgehog‐mediated tumor–stromal interactions in pancreatic cancer. Cancer Res 2013; 73: 3235–47. [DOI] [PMC free article] [PubMed] [Google Scholar]
- 15. Semenza GL. Hypoxia‐inducible factor 1: oxygen homeostasis and disease pathophysiology. Trends Mol Med 2001; 7: 345–50. [DOI] [PubMed] [Google Scholar]
- 16. Semenza GL. Targeting HIF‐1 for cancer therapy. Nat Rev Cancer 2003; 3: 721–32. [DOI] [PubMed] [Google Scholar]
- 17. Harada H, Kizaka‐Kondoh S, Hiraoka M. Mechanism of hypoxia‐specific cytotoxicity of procaspase‐3 fused with a VHL‐mediated protein destruction motif of HIF‐1alpha containing Pro564. FEBS Lett 2006; 580: 5718–22. [DOI] [PubMed] [Google Scholar]
- 18. Harada H, Hiraoka M, Kizaka‐Kondoh S. Antitumor effect of TAT‐oxygen‐dependent degradation‐caspase‐3 fusion protein specifically stabilized and activated in hypoxic tumor cells. Cancer Res 2002; 62: 2013–8. [PubMed] [Google Scholar]
- 19. Harada H, Kizaka‐Kondoh S, Li G et al Significance of HIF‐1‐active cells in angiogenesis and radioresistance. Oncogene 2007; 26: 7508–16. [DOI] [PubMed] [Google Scholar]
- 20. Kizaka‐Kondoh S, Itasaka S, Zeng L et al Selective killing of hypoxia‐inducible factor‐1‐active cells improves survival in a mouse model of invasive and metastatic pancreatic cancer. Clin Cancer Res 2009; 15: 3433–41. [DOI] [PubMed] [Google Scholar]
- 21. Harada H, Kizaka‐Kondoh S, Hiraoka M. Optical imaging of tumor hypoxia and evaluation of efficacy of a hypoxia‐targeting drug in living animals. Mol Imaging 2005; 4: 182–93. [DOI] [PubMed] [Google Scholar]
- 22. Tomioka D, Maehara N, Kuba K et al Inhibition of growth, invasion, and metastasis of human pancreatic carcinoma cells by NK4 in an orthotopic mouse model. Cancer Res 2001; 61: 7518–24. [PubMed] [Google Scholar]
- 23. Shono M, Sato N, Mizumoto K et al Stepwise progression of centrosome defects associated with local tumor growth and metastatic process of human pancreatic carcinoma cells transplanted orthotopically into nude mice. Lab Invest 2001; 81: 945–52. [DOI] [PubMed] [Google Scholar]
- 24. Shibata T, Akiyama N, Noda M, Sasai K, Hiraoka M. Enhancement of gene expression under hypoxic conditions using fragments of the human vascular endothelial growth factor and the erythropoietin genes. Int J Radiat Oncol Biol Phys 1998; 42: 913–6. [DOI] [PubMed] [Google Scholar]
- 25. Kim WY, Perera S, Zhou B et al HIF2alpha cooperates with RAS to promote lung tumorigenesis in mice. J Clin Invest 2009; 119: 2160–70. [DOI] [PMC free article] [PubMed] [Google Scholar]
- 26. Baba M, Hirai S, Yamada‐Okabe H et al Loss of von Hippel‐Lindau protein causes cell density dependent deregulation of CyclinD1 expression through hypoxia‐inducible factor. Oncogene 2003; 22: 2728–38. [DOI] [PubMed] [Google Scholar]
- 27. Shi X, Liu S, Kleeff J, Friess H, Buchler MW. Acquired resistance of pancreatic cancer cells towards 5‐Fluorouracil and gemcitabine is associated with altered expression of apoptosis‐regulating genes. Oncology 2002; 62: 354–62. [DOI] [PubMed] [Google Scholar]
- 28. Halloran CM, Ghaneh P, Shore S et al 5‐Fluorouracil or gemcitabine combined with adenoviral‐mediated reintroduction of p16INK4A greatly enhanced cytotoxicity in Panc‐1 pancreatic adenocarcinoma cells. J Gene Med 2004; 6: 514–25. [DOI] [PubMed] [Google Scholar]
- 29. Yu L, Hales CA. Long‐term exposure to hypoxia inhibits tumor progression of lung cancer in rats and mice. BMC Cancer 2011; 11: 331. [DOI] [PMC free article] [PubMed] [Google Scholar]
- 30. Richards R, Jenkinson MD, Haylock BJ, See V. Cell cycle progression in glioblastoma cells is unaffected by pathophysiological levels of hypoxia. PeerJ 2016; 4: e1755. [DOI] [PMC free article] [PubMed] [Google Scholar]
- 31. Strese S, Fryknas M, Larsson R, Gullbo J. Effects of hypoxia on human cancer cell line chemosensitivity. BMC Cancer 2013; 13: 331. [DOI] [PMC free article] [PubMed] [Google Scholar]
- 32. Sullivan R, Pare GC, Frederiksen LJ, Semenza GL, Graham CH. Hypoxia‐induced resistance to anticancer drugs is associated with decreased senescence and requires hypoxia‐inducible factor‐1 activity. Mol Cancer Ther 2008; 7: 1961–73. [DOI] [PubMed] [Google Scholar]
- 33. Yeom CJ, Zeng L, Zhu Y, Hiraoka M, Harada H. Strategies to assess hypoxic/HIF‐1‐active cancer cells for the development of innovative radiation therapy. Cancers (Basel) 2011; 3: 3610–31. [DOI] [PMC free article] [PubMed] [Google Scholar]
- 34. Hu Y, Liu J, Huang H. Recent agents targeting HIF‐1alpha for cancer therapy. J Cell Biochem 2013; 114: 498–509. [DOI] [PubMed] [Google Scholar]
- 35. Weir L, Robertson D, Leigh IM, Panteleyev AA. The reduction of water‐soluble tetrazolium salt reagent on the plasma membrane of epidermal keratinocytes is oxygen dependent. Anal Biochem 2011; 414: 31–7. [DOI] [PubMed] [Google Scholar]
- 36. Iwahashi S, Ishibashi H, Utsunomiya T et al Effect of histone deacetylase inhibitor in combination with 5‐fluorouracil on pancreas cancer and cholangiocarcinoma cell lines. J Med Invest 2011; 58: 106–9. [DOI] [PubMed] [Google Scholar]
- 37. Yokoi K, Fidler IJ. Hypoxia increases resistance of human pancreatic cancer cells to apoptosis induced by gemcitabine. Clin Cancer Res 2004; 10: 2299–306. [DOI] [PubMed] [Google Scholar]
- 38. Yoshiba S, Ito D, Nagumo T et al Hypoxia induces resistance to 5‐fluorouracil in oral cancer cells via G(1) phase cell cycle arrest. Oral Oncol 2009; 45: 109–15. [DOI] [PubMed] [Google Scholar]
- 39. Guise CP, Wang AT, Theil A et al Identification of human reductases that activate the dinitrobenzamide mustard prodrug PR‐104A: a role for NADPH:cytochrome P450 oxidoreductase under hypoxia. Biochem Pharmacol 2007; 74: 810–20. [DOI] [PubMed] [Google Scholar]
- 40. Zeman EM, Brown JM, Lemmon MJ, Hirst VK, Lee WW. SR‐4233: a new bioreductive agent with high selective toxicity for hypoxic mammalian cells. Int J Radiat Oncol Biol Phys 1986; 12: 1239–42. [DOI] [PubMed] [Google Scholar]
- 41. Hu J, Handisides DR, Van Valckenborgh E et al Targeting the multiple myeloma hypoxic niche with TH‐302, a hypoxia‐activated prodrug. Blood 2010; 116: 1524–7. [DOI] [PubMed] [Google Scholar]
- 42. Rischin D, Peters LJ, O'Sullivan B et al Tirapazamine, cisplatin, and radiation versus cisplatin and radiation for advanced squamous cell carcinoma of the head and neck (TROG 02.02, HeadSTART): a phase III trial of the Trans‐Tasman Radiation Oncology Group. J Clin Oncol 2010; 28: 2989–95. [DOI] [PubMed] [Google Scholar]
- 43. Williamson SK, Crowley JJ, Lara PN Jr et al Phase III trial of paclitaxel plus carboplatin with or without tirapazamine in advanced non‐small‐cell lung cancer: Southwest Oncology Group Trial S0003. J Clin Oncol 2005; 23: 9097–104. [DOI] [PubMed] [Google Scholar]
- 44. DiSilvestro PA, Ali S, Craighead PS et al Phase III randomized trial of weekly cisplatin and irradiation versus cisplatin and tirapazamine and irradiation in stages IB2, IIA, IIB, IIIB, and IVA cervical carcinoma limited to the pelvis: a Gynecologic Oncology Group study. J Clin Oncol 2014; 32: 458–64. [DOI] [PMC free article] [PubMed] [Google Scholar]
- 45. Konopleva M, Thall PF, Yi CA et al Phase I/II study of the hypoxia‐activated prodrug PR104 in refractory/relapsed acute myeloid leukemia and acute lymphoblastic leukemia. Haematologica 2015; 100: 927–34. [DOI] [PMC free article] [PubMed] [Google Scholar]
Associated Data
This section collects any data citations, data availability statements, or supplementary materials included in this article.
Supplementary Materials
Table S1. Comparison of cell viability of each pair group in Figure 2(a). P‐values compared using Student's t‐test.
Table S2. Comparison of cell viability of each pair group in Figure 2(c). P‐values compared using Student's t‐test.
Table S3. Comparison of bioluminescent intensities of tumors of each pair group in Figure 4(c,d). P‐values compared using Student's t‐test.
Table S4. Comparison of survival ability of each pair group in Figure 5. P‐values compared using the log–rank test.