

Abstract
Background
Cattle include a large number of breeds that are characterized by marked phenotypic differences and thus constitute a valuable model to study genome evolution in response to processes such as selection and domestication. Detection of “signatures of selection” is a useful approach to study the evolutionary pressures experienced throughout history. In the present study, signatures of selection were investigated in five cattle breeds farmed in Italy using a multivariate approach.
Methods
A total of 4094 bulls from five breeds with different production aptitudes (two dairy breeds: Italian Holstein and Italian Brown Swiss; two beef breeds: Piemontese and Marchigiana; and one dual purpose breed: Italian Simmental) were genotyped using the Illumina BovineSNP50 v.1 beadchip. Canonical discriminant analysis was carried out on the matrix of single nucleotide polymorphisms (SNP) genotyping data, separately for each chromosome. Scores for each canonical variable were calculated and then plotted in the canonical space to quantify the distance between breeds. SNPs for which the correlation with the canonical variable was in the 99th percentile for a specific chromosome were considered to be significantly associated with that variable. Results were compared with those obtained using an FST-based approach.
Results
Based on the results of the canonical discriminant analysis, a large number of signatures of selection were detected, among which several had strong signals in genomic regions that harbour genes known to have an impact on production and morphological bovine traits, including MSTN, LCT, GHR, SCD, NCAPG, KIT, and ASIP. Moreover, new putative candidate genes were identified, such as GCK, B3GALNT1, MGAT1, GALNTL1, PRNP, and PRND. Similar results were obtained with the FST-based approach.
Conclusions
The use of canonical discriminant analysis on 50 K SNP genotypes allowed the extraction of new variables that maximize the separation between breeds. This approach is quite straightforward, it can compare more than two groups simultaneously, and relative distances between breeds can be visualized. The genes that were highlighted in the canonical discriminant analysis were in concordance with those obtained using the FST index.
Electronic supplementary material
The online version of this article (doi:10.1186/s12711-016-0236-7) contains supplementary material, which is available to authorized users.
Background
During the long process of animal domestication that began approximately 8000 to 12,000 years ago, man and environment played a fundamental role in the evolution of livestock species [1]. DNA mutations, adaptation, migrations, and selection have affected the biological diversity of natural populations, leading to the prevailing variability in livestock [2]. Thus, domestic animal species represent a relevant model for genetic diversity studies. A particularly useful example is the large range of current cattle breeds that are characterized by wide phenotypic variation due to the intense artificial selection they have been subjected to in the last 50 years [3–5].
Studies on cattle are supported by the availability of whole-genome sequence data, of well-developed linkage maps, and of a pedigree structure that, for many breeds, allows for a precise dissection of the effects that underlie complex traits [6–8]. High-throughput genotyping techniques, together with developments in comparative genomics, have opened great opportunities for the study of genomic modifications due to natural and artificial selection. These selective pressures increase the frequency of the most favorable allele at a target locus. This process also affects allele frequencies at loci at nearby locations and results in a loss of heterozygosity across that chromosomal region [9–11]. This phenomenon, known as “hitchhiking”, leads to the formation of selective sweeps or “signatures of selection”, that are characterized by distributions of allele frequencies around favorable mutations that statistically differ from those expected by chance [12].
Several approaches have been proposed to study signatures of selection in cattle that differ in the metrics and statistical inferences used [13, 14]. They are all essentially based on assessment of differences in allelic or haplotype frequencies between populations (i.e. breeds, different geographic origins and distributions, levels of selection, production aptitudes). Akey [15] classified tests for detecting signatures of selection into: (1) spectrum tests that are based on the distribution of polymorphisms in specific regions; (2) tests that are based on linkage disequilibrium (LD) between adjacent loci, i.e. tests that consider haplotypes; and (3) tests that compare population structures, such as the popular fixation index (FST), that was originally proposed by Wright [16]. Studies on signatures of selection in cattle and sheep have used all three classes of methods, with the majority being based on FST [17–20], although spectrum- [12, 21] and LD-based methods [14, 22] have also been used. Furthermore, integrated approaches that combine the detection of signatures of selection with genome-wide association studies have been applied in dairy cattle [23]. Recently, detection of signatures of selection based on LD has been implemented using whole-genome sequence data [24].
Genetic differences are often evaluated under the perspective of a single locus or an aggregate of a small number of loci because studies on signatures of selection are focused mainly on detection of single nucleotide polymorphisms (SNPs) that tag chromosomal positions where putative candidate genes may be located. However, since signatures of selection are the result of the interaction between selection pressure on a causative gene and LD with adjacent loci, analyzing the correlation structure between SNPs in a specific genomic region could represent an interesting starting point to quantify the existence of a signature of selection. Multivariate statistics offer a set of techniques to study the different aspects of correlation matrices, among which principal component analysis (PCA) has proven to be very efficient in extracting information from a set of multiple genetic markers and has been successfully used in several fields of genetics [14, 25, 26]. In the specific case of the detection of signatures of selection where predefined groups of individuals are compared, canonical discriminant analysis (CDA) is particularly appealing. CDA aims at quantifying the relationship between a categorical variable, i.e. the group the individual belongs to, and a set of independent variables [27]. As for PCA, CDA is based on the extraction of linear combinations of original variables. However, whereas PCA aims at explaining the maximum amount of variance, canonical variables (CVA) are generated to maximize the difference between groups. Once CVA are extracted, their structure (i.e. correlations between CVA and original variables) can be examined in order to identify SNPs that contribute most to the discrimination between breeds. CDA was recently proposed by Dimauro et al. [28] to select a reduced pool of SNPs that were able to distinguish bovine breeds.
The aim of our study was to detect the presence of signatures of selection in cattle by comparing five Italian breeds with different production aptitudes (Italian Holstein–Friesian, Italian Brown Swiss, Italian Simmental, Marchigiana and Piemontese) using CDA. In order to assess the reliability and power of the CDA-based approach for the detection of signatures of selection, a comparison with the fixation index (FST) method was also performed.
Methods
Data
A total of 4094 bulls were genotyped using the Illumina BovineSNP50 v.1 beadchip [29]. These animals were from five bovine breeds that were characterized by different production aptitudes: two dairy breeds (Italian Holstein–Friesian n = 2092, Italian Brown Swiss n = 749), two beef breeds (Piemontese n = 364, and Marchigiana n = 410) and one dual purpose breed (Italian Simmental n = 479). DNA for genotyping was extracted from semen straws that were produced for artificial insemination (AI) and supplied by the Breed Associations of each of these five breeds. In this study, since animal manipulation was not necessary, approval by the Animal Care Committee was not requested.
Among the animals included in this study, none had more than 1000 missing genotypes. Only SNPs that mapped to autosomes were considered. Filtering of SNP genotypes was performed across all breeds based on missing data (<2.5 %) and minor allele frequency (<1 %). After filtering, 39,833 SNPs that were common among the five breeds were retained for further analyses.
Canonical discriminant analysis (CDA)
Given the data matrix of p markers measured on n animals from k breeds, the CDA derives linear combinations of SNPs that maximize the between-breed variation. The i-th CVA, can be written as:
| 1 |
where are the canonical coefficients, which indicate the partial contribution of each SNP to the discriminant function; mi are the SNP genotypes. The vector of coefficients for the i-th canonical variable is obtained by maximizing the ratio:
| 2 |
where B and W are the between- and within-group SNP (co)variance matrices, respectively [30]. The dimension of the canonical space is the smallest value between k and p minus 1. In the present work, five breeds were considered and therefore four CVA were extracted. The eigenvalue of each i-th CVA, i.e. the amount of variance explained by the CVA, is , where ρ2i is the i-th squared canonical correlation. The eigenvalue can be interpreted as the ratio of the between-breed to the pooled within-breed variation.
In our study, CDA was carried out using the CANDISC procedure of SAS 9.2 (SAS/STAT® Software version 9.2, SAS Institute, Inc., Cary), separately for each bovine chromosome (BTA for Bos taurus chromosome). Thus, M was the data matrix of SNP genotypes (coded as 0, 1, 2) with n = 4094 rows, i.e. the number of bulls. The number of columns p varied from 2610 for BTA1 to 796 for BTA29, respectively. The CDA requires a full rank correlation matrix. However, the rank of a rectangular matrix is less or equal to the minimum value of the number of rows and columns [31, 32] and genetic correlation matrices are often not full rank [33]. Thus, the genome-wide SNP correlation matrix is singular. Conducting the CDA by chromosome mitigates these problems, while considering the substantial biological orthogonality among chromosomes [34].
Scores for each CVA and for each individual were calculated and then plotted in the canonical space. Differences between breeds were measured by the Mahalanobis distance, which expresses the distance between the centroids of each group.
The meaning of the extracted canonical variables was assessed by examining correlations between SNP genotypes and CVA scores within each chromosome [35, 36]. Some authors suggest that canonical coefficients instead of correlations should be used to assess relationships between CVA and original variables [28, 30]. However, when CDA is performed on a large number of variables that are characterized by a particular variability (i.e. SNP genotypes can have only three values), it is reasonable to expect that the pattern of the canonical coefficients may not be very simple to interpret.
SNPs that were considered as “relevant”, i.e., as possible indicators of signatures of selection, were identified in two steps. First, SNPs for which correlations with CVA were in the 99th percentile for a given chromosome were selected [25]. However, provided that each canonical variable explains a different amount of the variance, the final number of SNPs that was retained for each CVA was proportional to the ratio between its eigenvalue and the eigenvalue of the first CVA for the given chromosome. For example, BTA2 comprised 2110 SNPs and the eigenvalues of the first and second CVA were equal to 814.2944 and 495.8699, respectively. Thus, the retained SNPs were the top 1 % (i.e., 21) for the first CVA and 21*(495.8699/814.2944) = 13 for the second CVA, respectively.
Fixation index (FST) analysis
In order to compare the results of the CDA with a commonly applied method for detection of signatures of selection, the fixation index (FST) was calculated at each locus for all the pairwise (n = 10) between breed comparisons using the formula proposed by Nei [37]:
where is the weighted expected heterozygosity calculated considering the two breeds as a single population; is the same parameter calculated by considering the two breeds separately. Raw FST values were smoothed using a locally weighted scatterplot smoothing (LOWESS) regression, combined with a control chart approach [17]. A SNP was declared significant if the corresponding FST value exceeded the threshold of 3 standard deviations (σ) from the mean. Significant SNPs detected by the FST approach were compared with those identified by CDA.
Annotated genes within the genomic regions that contained the relevant SNPs were obtained from the UCSC Genome Browser Gateway (http://genome.ucsc.edu/) using the Bos taurus UMD 3.1 of the Tau 6 release. Intervals of 500 kb (250 kb upstream and 250 kb downstream of the significant SNP) were considered in both applied approaches.
Results
Detection of significant SNPs
The average amount of variance explained by the four canonical variables (Table 1) ranged from 0.56 for CVA1 on BTA23 to 0.08 for CVA4 on BTA28. An increase in the amount of variance extracted by the first CVA was observed from longer to shorter chromosomes (i.e. 0.44 for BTA1 and 0.54 for BTA29, respectively).
Table 1.
Variance explained by the four canonical variables for each chromosome
| Chromosome | CVA1a | CVA2 | CVA3 | CVA4 |
|---|---|---|---|---|
| BTA1 | 0.44 | 0.27 | 0.17 | 0.12 |
| BTA2 | 0.44 | 0.27 | 0.17 | 0.12 |
| BTA3 | 0.48 | 0.24 | 0.18 | 0.10 |
| BTA4 | 0.51 | 0.22 | 0.16 | 0.11 |
| BTA5 | 0.44 | 0.28 | 0.16 | 0.12 |
| BTA6 | 0.42 | 0.26 | 0.18 | 0.14 |
| BTA7 | 0.47 | 0.25 | 0.17 | 0.11 |
| BTA8 | 0.46 | 0.26 | 0.17 | 0.11 |
| BTA9 | 0.50 | 0.23 | 0.17 | 0.11 |
| BTA10 | 0.48 | 0.25 | 0.17 | 0.10 |
| BTA11 | 0.48 | 0.25 | 0.17 | 0.10 |
| BTA12 | 0.53 | 0.23 | 0.15 | 0.09 |
| BTA13 | 0.47 | 0.28 | 0.16 | 0.10 |
| BTA14 | 0.54 | 0.22 | 0.16 | 0.09 |
| BTA15 | 0.52 | 0.21 | 0.17 | 0.10 |
| BTA16 | 0.51 | 0.25 | 0.15 | 0.09 |
| BTA17 | 0.53 | 0.23 | 0.15 | 0.09 |
| BTA18 | 0.54 | 0.23 | 0.15 | 0.08 |
| BTA19 | 0.52 | 0.24 | 0.15 | 0.09 |
| BTA20 | 0.52 | 0.24 | 0.15 | 0.09 |
| BTA21 | 0.49 | 0.25 | 0.16 | 0.09 |
| BTA22 | 0.53 | 0.20 | 0.19 | 0.08 |
| BTA23 | 0.56 | 0.21 | 0.15 | 0.08 |
| BTA24 | 0.50 | 0.23 | 0.16 | 0.10 |
| BTA25 | 0.54 | 0.24 | 0.15 | 0.07 |
| BTA26 | 0.55 | 0.21 | 0.16 | 0.09 |
| BTA27 | 0.52 | 0.22 | 0.17 | 0.09 |
| BTA28 | 0.52 | 0.22 | 0.18 | 0.08 |
| BTA29 | 0.54 | 0.23 | 0.14 | 0.09 |
| Mean | 0.50 | 0.24 | 0.16 | 0.10 |
| Standard deviation | 0.04 | 0.02 | 0.01 | 0.01 |
| Maximum | 0.56 | 0.28 | 0.19 | 0.14 |
| Minimum | 0.42 | 0.20 | 0.14 | 0.07 |
aCVA1, CVA2, CVA3, and CVA4 are the first, second, third and fourth extracted canonical variable, respectively
The largest values of the Mahalanobis distance were found for Marchigiana with the other breeds [see Additional file 1 Table S1], especially with the Italian Holstein–Friesian breed for BTA10 to 29. The smallest values were observed between Italian Simmental and Piemontese, again for BTA10 to 29.
The number of SNPs that were identified as significant in the FST analysis was more than 10 times larger than that in the CDA (864 versus 9108 SNPs, Table 2). However, note that the FST results were based on the sum of the significant SNPs detected in each of the 10 pairwise comparisons. Moreover, several SNPs were detected in two or more pairwise comparisons, thus increasing the number of SNPs detected with FST. When only one pairwise comparison was considered for FST, the number of detected SNPs was comparable to that obtained in the CDA (Table 2). A total of 332 SNPs were found in both the CDA and in at least one of the 10 FST comparisons.
Table 2.
Number of significant SNPs detected by the canonical discriminant analysis (CDA) and the fixation index (FST) approach
| Pair-wise FST | FST analysis | Number of common SNPs between CDA and - FST | ||||
|---|---|---|---|---|---|---|
| Number of detected significant SNPs | CVA1a | CVA2 | CVA3 | CVA4 | Total | |
| BRW–HOL | 833 | 82 | 19 | 11 | 1 | 113 |
| BRW–MAR | 719 | 10 | 43 | 8 | 0 | 61 |
| BRW–SIM | 821 | 13 | 11 | 32 | 0 | 56 |
| BRW–PIE | 749 | 14 | 19 | 19 | 9 | 61 |
| HOL–MAR | 1035 | 82 | 21 | 8 | 2 | 113 |
| HOL–SIM | 923 | 82 | 11 | 17 | 3 | 113 |
| SIM–MAR | 883 | 20 | 36 | 24 | 2 | 82 |
| PIE–HOL | 1172 | 97 | 8 | 19 | 11 | 135 |
| PIE–MAR | 943 | 14 | 27 | 10 | 9 | 60 |
| PIE–SIM | 1030 | 18 | 12 | 19 | 21 | 70 |
| Total | 9108 | 432 | 207 | 167 | 58 | 864 |
| Unique SNP in common | 155 | 78 | 66 | 33 | 332 | |
BRW Italian Brown Swiss, HOL Italian Holstein, MAR Marchigiana, SIM Italian Simmental, PIE Piemontese cattle
aCVA1, CVA2, CVA3, and CVA4 are the first, second, third and fourth extracted canonical variable, respectively
Detection of signatures of selection
The CDA highlighted a large number (n = 613) of signatures of selection that were characterized by one or more SNPs (their number ranging from 1 to 8). The largest number of signatures of selection was detected on BTA1 (n = 45), whereas the smallest number was on BTA29 (n = 8). BTA4 had the largest number of relevant SNPs that were located in the same region. In particular, eight SNPs between 76.9 and 77.6 Mb were detected for CVA1 and five SNPs (between 34 and 35 Mb) for CVA2.
Comparison between the results of the CDA and FST analyses shows good agreement between the locations of the most relevant signatures of selection [see Additional file 2 Figure S1]. Figure 1a compares the CDA and FST-based results for the two dairy breeds (Italian Holstein–Friesian and Italian Brown Swiss) and shows that both methods identify signatures of selection on BTA4, 6, 7, 14, 26, and 28. Similarly, both methods detected common signatures of selection in the dairy versus beef cattle comparison (Italian Holstein–Friesian and Marchigiana; Fig. 1b) on BTA2, 4, 6, 7, 14, 18, and 26 and in the comparison between the two specialized beef breeds (Piemontese and Marchigiana; Fig. 1c) on BTA2, 5, 6, 13, 18, and 26.
Fig. 1.
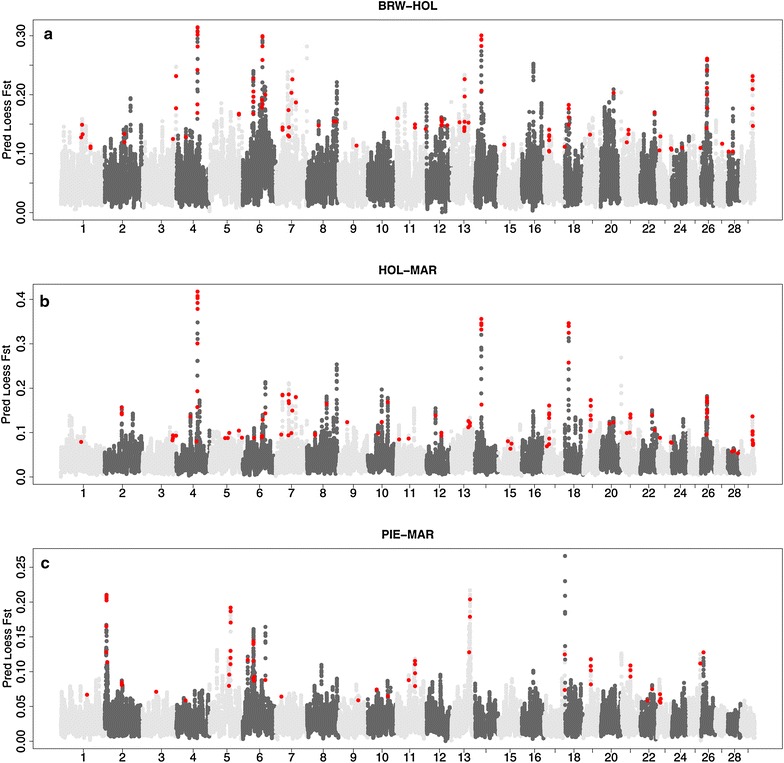
Manhattan plot of FST (light and dark grey dots) and canonical coefficients (red dots) for Italian Brown Swiss-Italian Holstein (a), Italian Holstein-Marchigiana (b), and Piemontese-Marchigiana (c) comparisons, respectively
Detection of signatures of selection that include known genes
More than 200 candidate genes that have a role in metabolic pathways of interest for the considered breeds were identified in the genomic regions flagged by the CDA [see Additional file 3 Table S2]. These results suggest a good reliability of this method. On BTA2 for example, the CVA4 was able to separate the Piemontese breed from the other breeds (Fig. 2). Among the SNPs that had the largest correlation with this CVA (Table 3), three were located between 6.6 and 6.8 Mb on BTA2, which is where the myostatin locus maps. CVA1, with two SNPs positioned between 5.8 and 6.1 Mb, distinctly separated the Italian Holstein- Friesian from the two beef breeds (Fig. 2), while the Italian Brown Swiss was found at an intermediate position between these two breeds. This region contains the inositol polyphosphate-1-phosphatase (INPP1) gene. Moreover, the CVA2 that separated the Italian Brown Swiss from the other breeds had six significant SNPs in the region around 62 Mb, which contains the lactase (LCT) gene.
Fig. 2.

Plot of the individual scores of the first, second and fourth canonical variables (CVA1, CVA2, and CVA4) extracted from BTA2 in the five breeds. Circles Italian Brown Swiss; flowers Italian Holstein; diamonds Piemontese; cubes Marchigiana; pyramids Italian Simmental
Table 3.
SNPs with the 1 % highest correlations with CVA4 for BTA2
| Marker | Position in Mb | Correlation with CVA4a |
|---|---|---|
| Hapmap55212-rs29013415 | 9,245,063 | 0.46 |
| Hapmap38411-BTA-48376 | 9,499,870 | 0.42 |
| Hapmap32300-BTA-133908 | 38,980,525 | 0.42 |
| Hapmap47560-BTA-30470 | 6,831,955 | 0.40 |
| ARS-BFGL-NGS-11319 | 6,763,227 | 0.40 |
| ARS-BFGL-NGS-112454 | 6,675,045 | 0.36 |
| BTB-01977132 | 7,520,210 | 0.35 |
| Hapmap51331-BTA-85692 | 8,272,673 | 0.354 |
| UA-IFASA-5029 | 111,206,088 | 0.349 |
| BTB-01929922 | 8,188,132 | 0.339 |
| Hapmap57611-rs29021061 | 5,464,367 | 0.338 |
| ARS-BFGL-NGS-28178 | 58,653,662 | 0.336 |
| Hapmap44381-BTA-47399 | 5,640,288 | 0.327 |
| ARS-BFGL-NGS-106761 | 5,601,419 | 0.314 |
| ARS-BFGL-NGS-90839 | 7,169,804 | 0.297 |
| ARS-BFGL-NGS-10357 | 132,764,293 | 0.293 |
| BTA-47785-no-rs | 4,958,110 | 0.292 |
| Hapmap39337-BTA-46816 | 4,488,303 | 0.292 |
| ARS-BFGL-NGS-18261 | 1,896,078 | 0.290 |
| BTB-00078691 | 7,492,224 | 0.283 |
| ARS-BFGL-NGS-5566 | 107,378,666 | 0.282 |
| Hapmap54594-rs29019168 | 113,899,270 | 0.281 |
| BTB-00078030 | 4,421,299 | 0.280 |
aFourth extracted canonical variable
On BTA6, CVA2 showed that the Marchigiana breed was separated from the other breeds (Fig. 3). The correlation structure of this canonical variable had large correlations with six SNPs that identified two closely-located clusters of genes between 37 and 39 Mb, that are known to affect dairy (PDK2, SPP1, MEPE, and ABCG2) and beef (IBSP, LAP3, NCAPG, and LOCRL) traits, respectively. On the same chromosome, CVA3 revealed a gradual separation between breeds according to production aptitudes (dairy ⇒ beef ⇒ dual purpose) (Fig. 3). The structure of this CVA (Table 4) showed large correlations with six SNPs that were located between 71.4 and 71.8 Mb, a region that contains the platelet derived growth factor receptor, alpha polypeptide (PDGFRA) gene.
Fig. 3.
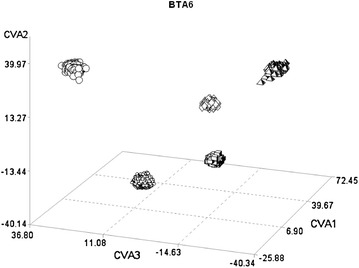
Plot of the individual scores of the first three canonical variables (CVA1, CVA2, and CVA3) extracted from BTA6 in the five breeds. Circles Italian Brown Swiss; flowers Italian Holstein; diamonds Piemontese; cubes Marchigiana; pyramids Italian Simmental
Table 4.
SNPs with the 1 % highest correlations with CVA3 for BTA6
| Marker | Position in Mb | Correlation with CVA3a |
|---|---|---|
| Hapmap31616-BTC-042811 | 71,873,004 | 0.672 |
| Hapmap42715-BTA-87995 | 80,128,784 | 0.640 |
| Hapmap44452-BTA-22099 | 89,399,736 | 0.633 |
| Hapmap27692-BTC-042876 | 71,519,635 | 0.623 |
| Hapmap56688-rs29025335 | 81,767,374 | 0.623 |
| Hapmap33128-BTC-041916 | 71,421,017 | 0.622 |
| ARS-BFGL-NGS-38827 | 71,476,002 | 0.621 |
| Hapmap32220-BTC-042831 | 71,552,977 | 0.612 |
| Hapmap26269-BTC-041695 | 71,452,210 | 0.609 |
| BTA-77011-no-rs | 82,773,692 | 0.594 |
| BTB-00272881 | 97,826,840 | 0.588 |
| BTA-110240-no-rs | 81,652,194 | 0.583 |
| Hapmap27224-BTA-161106 | 81,551,479 | 0.571 |
| Hapmap30962-BTC-032558 | 33,189,478 | 0.559 |
| BTA-20903-no-rs | 81,467,492 | 0.549 |
| ARS-BFGL-NGS-67658 | 105,075,435 | 0.536 |
| Hapmap52018-BTA-75646 | 29,355,660 | 0.530 |
| Hapmap48462-BTA-77136 | 93,080,797 | 0.530 |
| BTB-01312468 | 64,487,002 | 0.530 |
aThird extracted canonical variable
On BTA20, CVA1 identified a clear separation between Italian Holstein–Friesian and the other breeds (Fig. 4). This CVA1 was correlated with several SNPs that were within the genomic region that contains the growth hormone receptor (GHR) gene (Table 5).
Fig. 4.
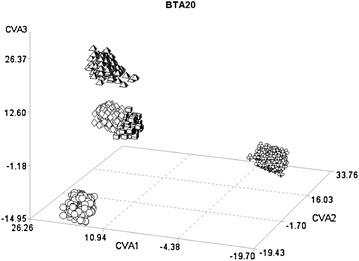
Plot of the individual scores of the first three canonical variables (CVA1, CVA2, and CVA3) extracted from BTA20 in the five breeds. Circles Italian Brown Swiss; flowers Italian Holstein; diamonds Piemontese; cubes Marchigiana; pyramids Italian Simmental
Table 5.
Top 1 % highest correlation coefficients between CVA1 and SNP genotypes for BTA20
| Marker | Position in Mb | Correlation with CVA1 |
|---|---|---|
| BTA-50702-no-rs | 46,405,056 | 0.812 |
| BTA-50697-no-rs | 46,346,416 | 0.780 |
| ARS-BFGL-NGS-102895 | 24,228,836 | 0.751 |
| Hapmap54326-rs29009836 | 21,160,226 | 0.744 |
| Hapmap42401-BTA-102906 | 39,538,676 | 0.724 |
| ARS-BFGL-NGS-10108 | 31,848,979 | 0.719 |
| BTB-00784875 | 44,452,488 | 0.697 |
| Hapmap52341-rs29025776 | 11,971,234 | 0.673 |
| ARS-BFGL-NGS-39275 | 70,454,164 | 0.665 |
| BTA-113191-no-rs | 33,256,096 | 0.660 |
| Hapmap51681-BTA-110411 | 18,882,445 | 0.657 |
| ARS-BFGL-NGS-93510 | 25,429,674 | 0.653 |
| BTB-01583562 | 55,425,112 | 0.648 |
Three well-known genes involved in the determinism of coat color in mammals were correlated with CDA: (1) on BTA6, CVA1 was correlated mainly with SNPs that were located close to the v-kit Hardy Zuckerman 4 feline sarcoma viral oncogene homolog (KIT) locus; (2) on BTA18, CVA1 was correlated with three SNPs that were located between 14.3 and 14.5 Mb, where the melanocortin 1 receptor (MC1R) gene is positioned; and (3) on BTA13, CVA2 separates the Marchigiana breed from the other ones and was mainly correlated with SNPs that mapped close to the agouti signalling protein (ASIP) gene.
Other known genes that were identified in the discrimination between the five breeds were the leptin receptor (LEPR) on BTA3, and the stearoyl-CoA deasturase (SCD) on BTA26 and the family of cathelicidins (CATHL) on BTA22, respectively.
Detection of signatures of selection that include candidate genes
The CDA analysis also identified several genomic regions that harbored genes, which have not been previously reported in studies on the detection of signatures of selection for cattle breeds. Two large signatures of selection were identified on BTA4 with (1) the glucokinase (hexokinase 4) (GCK), and the insulin like growth factor binding protein 3 and 1 (IGFBP1 and IGFBP3) located in the first signature of selection (between 77.7 and 77.9 Mb); and (2) the glutamate receptor metabotropic 3 (GRM3) in the second signature of selection. On BTA17, seven SNPs were identified within a region between 18.3 and 19.1 Mb that includes seven annotated genes (NDUFC1, RAB33B, CCRN4L, MGST2, ELF2, THOC7, and MGARP). Several signatures of selection in regions that harbor genes involved in the metabolism of milk oligosaccharides (MO) were detected across the genome [see Additional file 3 Table S2] i.e.: B3GALNT1 on BTA1 (two SNPs for CVA2), MGAT1 on BTA7 (one SNP for CVA3), GALNTL1 on BTA10 (one SNP for CVA3), POMT, ST6GAL2 and GALNT14 on BTA11 (four SNPs for CVA1 and one for CVA2, respectively).
Interestingly, on BTA13, CVA1 emphasized the separation between Italian Holstein–Friesian and Marchigiana [see Additional file 4 Figure S2], and revealed six significant SNPs between 47.1 and 48.3 Mb. Two genes are present in this region: the prion protein (PRNP) between 47,400,392 and 47,418,507 bp and the prion protein 2 (dublet) (PRND) between 47,444,352 and 47,449,390 bp. We analyzed the polymorphisms at these significant SNPs and found four C/T SNPs (Hapmap53245-rs29026914, BTB-01997512, Hapmap31215-BTA-32775 and BTB-01718516), one G/T SNP (Hapmap39323-BTA-32823) and one A/C SNP (ARS-BFGL-NGS-3711). Allele frequencies at each SNP differed between breeds (Table 6), with frequencies in the Italian Holstein–Friesian breed differing most from those in the other breeds; of particular interest is the frequency difference at the SNP BTB-01718516, which maps within the PRPN locus.
Table 6.
SNP Allele frequencies (%) for the SNP associated with CVA1 for BTA13
| Marker | ra(SNP, CVA1) | Breed | A | C | G | T |
|---|---|---|---|---|---|---|
| BTB-01997512 | 0.78973 | BRW | 0.08 | 0.92 | ||
| HOL | 0.84 | 0.16 | ||||
| MAR | 0.12 | 0.88 | ||||
| SIM | 0.14 | 0.86 | ||||
| PIE | 0.22 | 0.78 | ||||
| ARS-BFGL-NGS-3711 | 0.73262 | BRW | 0.05 | 0.95 | ||
| HOL | 0.82 | 0.18 | ||||
| MAR | 0.15 | 0.85 | ||||
| SIM | 0.34 | 0.66 | ||||
| PIE | 0.43 | 0.57 | ||||
| Hapmap39323-BTA-32823 | 0.67370 | BRW | 0.99 | 0.01 | ||
| HOL | 0.48 | 0.52 | ||||
| MAR | 1.00 | 0.00 | ||||
| SIM | 0.97 | 0.03 | ||||
| PIE | 0.98 | 0.02 | ||||
| Hapmap31215-BTA-32775 | 0.67348 | BRW | 0.99 | 0.01 | ||
| HOL | 0.43 | 0.57 | ||||
| MAR | 0.97 | 0.03 | ||||
| SIM | 0.90 | 0.10 | ||||
| PIE | 0.85 | 0.15 | ||||
| BTB-01718516 | 0.65564 | BRW | 0.98 | 0.02 | ||
| HOL | 0.02 | 0.98 | ||||
| MAR | 0.90 | 0.10 | ||||
| SIM | 0.40 | 0.60 | ||||
| PIE | 0.42 | 0.58 | ||||
| Hapmap53245-rs29026914 | 0.65456 | BRW | 0.15 | 0.85 | ||
| HOL | 0.80 | 0.20 | ||||
| MAR | 0.26 | 0.74 | ||||
| SIM | 0.30 | 0.70 | ||||
| PIE | 0.39 | 0.61 |
BRW Italian Brown Swiss, HOL Italian Holstein, MAR Marchigiana, SIM Italian Simmental, PIE Piemontese
aCorrelation between the SNP and the first canonical variable extracted from BTA13 that maps close to PRNP and PRND genes
Finally, three genes regulated by epigenetic mechanisms were detected. CVA1 for BTA3 was associated with two chromosome-wide significant SNPs located at around 36.5 Mb. The closest gene to these two SNPs is arginine methyltransferase 6 (PRMT6). On BTA21, CVA1 was correlated with a SNP located at 67.4 Mb, close to the maternally expressed gene 3 (MEG3). Finally, CVA3 for BTA28 was significantly associated with a SNP at 24.6 Mb, close to the sirtuin, type 1 (SIRT1) gene.
Discussion
Canonical discriminant analysis
The use of canonical discriminant analysis on 50 K SNP genotypes allowed the extraction of new variables that were able to maximize the separation between breeds. Interpretation of the canonical structure led to the identification of a large number of signatures of selection. The CDA approach is quite straightforward, based on simple visual inspection of individual locations in the canonical spaces and on interpretation of the canonical structure. Analyses were carried out separately for each chromosome in order to mitigate the large unbalance between the number of animals and the number of SNPs. An alternative would be to select SNPs based on their ability to discriminate among populations. However, the use of selected SNP panels for the discrimination of individuals between breeds may give different results depending on the metric used [38]. Moreover, SNP selection results in loss of information, while all SNPs are represented in each CVA.
A useful feature of CDA compared to other methods for detection of signatures of selection is that more than two groups can be compared in a single calculation step while other approaches may require repeated calculations. For example, in this study 10*39,833 FST values had to be calculated in order to carry out the comparisons among the five breeds.
In genetic diversity studies, a widely used multivariate method is principal component analysis. Figure 5 shows the plot of individual scores of the first three principal components (PC) extracted from BTA2. The comparison with Fig. 2, which shows the scores of the first three CVA extracted from the same chromosome, reveals larger within-breed variability in the PCA plot. These results are a consequence of theoretical differences between these two multivariate techniques [30]. PCA extraction is aimed at accounting for progressive descending amounts of the original variance (which includes both between- and within-group variation) without any assumption on sample stratification. In contrast, CVA extraction is aimed at maximizing variation between predefined groups. The greater ability of CVA to discriminate between groups is also enhanced by a different partition of the variance across the new variables. The number of PC is equal to the number of original variables, whereas the number of CVA is equal to the number of groups minus 1. In the example of BTA2, the first three canonical variables explained 88 % of the variance (Table 1) whereas the first three PC accounted for 13 % of the variance (8, 3, and 2 % respectively).
Fig. 5.
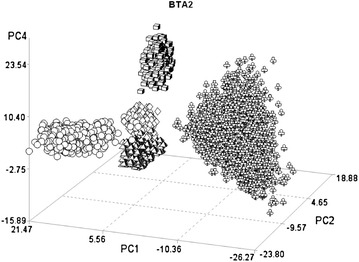
Plot of the individual scores of the first, second and fourth principal components (PC1, PC2, and PC4) extracted from BTA 2 for the five breeds. Circles Italian Brown Swiss; flowers Italian Holstein; diamonds Piemontese; cubes Marchigiana; pyramids Italian Simmental
Detection of signatures of selection
A large number of signatures of selection were detected and well-known or new candidate genes were identified. This result could be, at least partially, due to the structure of the sample analysed. Breeds with different production aptitudes and selection histories were considered. As a result, genes that are involved in specific biological functions or metabolic pathways of interest were detected [see Additional file 3 Table S2]. These results are consistent with those from previous studies [12, 14, 24, 39] and with our results obtained by using the popular FST approach. However, several of the identified regions did not contain genes, either because annotation of the bovine genome is incomplete or the SNP was positioned outside a coding region [14, 40]. In any case, compared to other studies that were based on SNP or whole-genome sequence data, the number of signatures of selection that we detected was relatively large. Moreover, the number of detected regions was larger than that previously obtained using the same data [41], or different methods [24, 40, 42]. Overall, the comparison of the results between CDA and FST analyses revealed 290 genes that were detected by both methods [see Additional file 5 Table S3].
Strong signatures of selection were observed on BTA13. Two adjacent genes (PRPN and PRND) are located within the peak at 47–48 Mb. The PRPN and PRND genes encode the prion protein (PrP) and the doppel protein (Dpl), respectively. PrP is a transmembrane glycoprotein whose normal function is still unknown [43]. It is widely known that the endogenous PrP is responsible for the occurrence of transmissible spongiform encephalopathies (TSE) [44]. In domestic and wild animals, several distinct TSE diseases are recognized. Among these, the best known are scrapie in sheep and goat, and the bovine spongiform encephalopathy (BSE) in cattle [45]. SNPs and indel events are responsible for the genetic polymorphism at the PRPN locus [46], with the SNPs being responsible for atypical forms of BSE, while indels appear to be involved in susceptibility to disease [44, 47]. However, the high degree of conservation of the PRPN gene and its ubiquitous expression among mammals suggest several biological roles, such as regulation of the circadian rhythm, central nervous system development, neuronal survival, and maintenance of cellular Ca+2 homeostasis [48]. In cattle, several studies recently revealed a large allelic variability at the PRPN and PRND loci [49–51] and also associations with susceptibility to BSE [52–54]. A recent investigation on the possible association between polymorphisms of the PRPN gene and milk production traits in cattle led to statistically significant results for milk fat content [55]. Using the same data as in our study but with a different approach, Mancini et al. [41] detected a signature of selection at the same position on BTA13 and identified the CDP-diacylglycerol synthase (CDS2) gene, which is involved in the phospholipid biosynthetic process. This signature of selection may be an effect of artificial selection but the signal that we detected here, in the region that contains the PRPN and PRND genes, could be the result of natural selection. However, more studies are necessary on e.g. the distribution and frequency of genetic variants, linkage between PRPN alleles, recombination rate, and haplotype diversity within and between populations, in order to improve management of the disease (especially atypical cases) and possibly production performance.
New candidate genes
A new result of interest in our study was the detection of signatures of selection in regions that harbor genes involved in the metabolism of bovine colostrum/milk oligosaccharides (MO). The first biochemical characterization of these molecules was done in the early 1980s [56]. Recently, several studies have been conducted to clarify the biological role of MO in mammals [57–59]. In mammalian milk, a large variability in concentration, composition and timing of oligosaccharides is observed during lactation. Changes in the quality and quantity of MO do not depend on the nutritional status of the mother [60]. Variations in glycans may be genetically driven but may also result from response to environmental pressures [61]. From an evolutionary point of view, this variability is explained by greater fitness [62]. In fact, presence of free oligosaccharides in the milk must have a selective advantage (for the mammary gland and for the offspring) [63]. These molecules do not play a nutritional role (although they are carbohydrates) since they pass undigested into the large intestine [60]. However, several studies have shown that MO play a critical role in development and maintenance of the intestinal bacterial flora and protection against enteric diseases [64–66]. The role of MO in human health [61, 67] and the genes involved in their metabolism have been investigated [68]. Currently, because of their role as micronutrients and prebiotics, there is much interest in elucidating their genetic basis in mammalian species [56]. Genes that are involved in the metabolism of MO in cattle were recently reported [69] and were consistent with about one third of those identified in our study. Bovine milk was studied as a possible source of functional oligosaccharides for improving human health [70].
Genes involved in epigenetic regulatory mechanisms
In our genome-wide survey, three SNPs defined three signatures of selection on BTA3, 21 and 28, respectively. Among the identified genes, PRMT6, MEG3 and SIRT1 are under epigenetic control and represent interesting candidate genes. Traditionally, for traits of economic interest, the relationship between genome and phenome has been investigated by considering that variability was the result of several combined genetic and environmental factors. Until a few years ago, epigenetics was neglected in livestock production. However, over the last 20 years, there have been numerous articles on this topic in humans, mouse and plants [71, 72]. Only recently, QTL that affect productive performance have been considered to be subject to epigenetic mechanisms [73]. Differences in the epigenome may explain some of the phenotypic variations observed within populations. Economically important traits such as milk composition and yield or muscle mass and fat deposition appear to be the result of a synergy between the genome and epigenome [74–76].
MEG3 on BTA21 was previously reported to be polymorphic in cattle but the polymorphism was not associated with production traits [75]. In beef breeds, CDA (CVA3) identified a strong signal on BTA28 where the sirtuin1 (SIRT1) gene is located. SIRT1 is a nicotinamide adenine dinucleotide (NAD)-dependent deacetylase that is involved in a plethora of biological processes, including metabolic regulation, aging and stress response [76, 77]. In humans, this gene has attracted much interest because polymorphisms at this gene have been associated with longevity [78] and obesity [79] and recently, a polymorphism at this locus was also associated with growth traits in the Nanyang cattle breed [80]. Based on these results, it is clear that it is important to elucidate, at the molecular level, the epigenetic mechanisms that control genes and to understand how they can influence production traits to improve animal production performance.
The issue of ascertainment bias
In this work, five breeds of different geographical origin, selection histories, morphological appearance and production aptitudes were compared. A main issue of the between-breed comparisons that were carried out is the ascertainment bias caused by the method used to identify the SNPs. On the one hand, although SNP editing in the present work was performed across breeds, it should be recalled that the beadchip used was developed for other ascertainment groups [81]. On the other hand, studies on the effect of ascertainment bias on estimation of genetic diversity parameters (such as FST or PCA) have led to conflicting results [82, 83]. In any case, none of the studies on genetic variability have considered methods to correct for ascertainment bias and its effect is, at present, not predictable [84]. The main reason of the lack of correction for ascertainment bias is that breed-specific SNP panels are not commercially available. Finally, it should be noted that the BovineSNP50 assay was tested on a panel of 21 indicine and taurine breeds, for which nearly 95 % of the considered SNPs were polymorphic [29], although these authors pointed out that the power of the assay for genome-wide association studies differed between populations.
Conclusions
Our results suggest that canonical discriminant analysis can be a valid tool for detection of signatures of selection based on 50 K SNP beadchip data. The approach is quite straightforward, allows the comparison of more than two groups at the same time, and relative distances between breeds can be visually appreciated. A large number of signatures of selection were detected, within which, several well known candidate genes that affect meat or milk production traits were identified e.g. myostatin and GHR. Moreover, several interesting new candidate genes were identified, such as those involved with metabolism of milk oligosaccharides or those known to be regulated by epigenetic mechanisms.
Authors’ contributions
SS, NPPM, CD conceived and designed the experiments. RS, MC, GG, GM performed the experiments. NPPM, SS, RS analyzed the data. AV, PAM, AS contributed reagents, materials and analysis tools. NPPM, SS wrote the paper. All authors read and approved the final manuscript.
Acknowledgements
Genotype data used in the present study were generated within two research projects funded by the Italian Ministry of Agriculture (grants SELMOL and INNOVAGEN) and one funded by the Fondazione CARIPLO (Grant PROZOO). The authors wish to thank the breed associations of Italian Holstein, Italian Brown, Italian Holstein, Piemontese and Marchigiana for their contribution.
Competing interests
The authors declare that they have no competing interests.
Additional Files
10.1186/s12711-016-0236-7 Matrices of Mahalanobis distances between the five breeds on the 29 autosomes. This table reports the Mahalanobis distance between the centroids of the five cattle populations calculated with the canonical discriminant analysis. The distances are reported for all the 29 autosomes. BRW = Italian Brown Swiss; HOL = Italian Holstein; MAR = Marchigiana; PIE = Piemontese; SIM = Italian Simmental.
10.1186/s12711-016-0236-7 Manhattan plot of FST values (light and dark grey dots) and canonical coefficients (red dots) for all ten pairwise comparisons. This plot reports the FST values and the canonical coefficient along the whole genome obtained in the ten pairwise comparisons between all the five breeds considered in this study, evidencing the concordance between the two approaches in the detection of selection signatures. BRW = Italian Brown Swiss; HOL = Italian Holstein; MAR = Marchigiana; PIE = Piemontese; ISIM = Italian Simmental.
10.1186/s12711-016-0236-7 List of putative candidate genes detected using CDA derived from Bos taurus UMD 3.1/bosTau6 assembly. This table reports the genes that have been identified considering an interval of 0.5 Mb around SNPs that have the highest (top 1 %) correlations with the canonical variables.
10.1186/s12711-016-0236-7 Plot of the individual scores of the first three canonical variables (CVA1, CVA2, and CVA3) extracted from BTA13 in the five breeds. This plot represents the clear separation between Italian Holstein and Marchigiana obtained on BTA13; circles = Italian Brown Swiss; flowers = Italian Holstein; diamonds = Piemontese; cubes = Marchigiana; pyramids = Italian Simmental.
10.1186/s12711-016-0236-7 List of markers and genes identified by both CDA and FST approaches. This table reports the markers and the genes in common between the two considered approaches for detection of selection signatures.
Contributor Information
Silvia Sorbolini, Email: ssorbolini@uniss.it.
Giustino Gaspa, Email: gigaspa@uniss.it.
Roberto Steri, Email: roberto.steri@entecra.it.
Corrado Dimauro, Email: cdimauro@uniss.it.
Massimo Cellesi, Email: mcellesi@uniss.it.
Alessandra Stella, Email: alessandra.stella@tecnoparco.org.
Gabriele Marras, Email: gabriele.marras@ptp.it.
Paolo Ajmone Marsan, Email: paolo.ajmone@unicatt.it.
Alessio Valentini, Email: alessio@unitus.it.
Nicolò Pietro Paolo Macciotta, Email: macciott@uniss.it.
References
- 1.Diamond J. Evolution, consequences and future of plant and animal domestication. Nature. 2002;418:700–707. doi: 10.1038/nature01019. [DOI] [PubMed] [Google Scholar]
- 2.Groenveld LF, Lenstra JA, Eding H, Toro MA, Scherf B, Pilling D, et al. Genetic diversity in farm animals—a review. Anim Genet. 2010;41:6–31. doi: 10.1111/j.1365-2052.2010.02038.x. [DOI] [PubMed] [Google Scholar]
- 3.Utsunomiya YT, Perez O’Brien AM, Sonstegard TS, Solkner J, Garcia JF. Genomic data as the “hitchhiker’s guide” to cattle adaptation: tracking the milestones of past selection in the bovine genome. Front Genet. 2015;6:36. doi: 10.3389/fgene.2015.00036. [DOI] [PMC free article] [PubMed] [Google Scholar]
- 4.Brotherstone S, Goddard M. Artificial selection and maintenance of genetic variance in the global dairy cow population. Philos Trans R Soc Lond B Biol Sci. 2005;360:1479–1488. doi: 10.1098/rstb.2005.1668. [DOI] [PMC free article] [PubMed] [Google Scholar]
- 5.Gomez-Raya L, Olsen HG, Lingaas F, Klungland H, Vage DI, Olsaker I, et al. The use of genetic markers to measure genomic responses to selection in livestock. Genetics. 2002;162:1381–1388. doi: 10.1093/genetics/162.3.1381. [DOI] [PMC free article] [PubMed] [Google Scholar]
- 6.Band MR, Larson JH, Rebeiz M, Green CA, Heyen DW, Donovan L, et al. An ordered comparative map of the cattle and human genomes. Genome Res. 2000;10:1359–1368. doi: 10.1101/gr.145900. [DOI] [PMC free article] [PubMed] [Google Scholar]
- 7.Burt DW. The cattle genome reveals its secrets. J Biol. 2009;8:36. doi: 10.1186/jbiol137. [DOI] [PMC free article] [PubMed] [Google Scholar]
- 8.Kemper KE, Goddard MG. Understanding and predicting complex traits: knowledge from cattle. Hum Mol Genet. 2012;21:R45–R51. doi: 10.1093/hmg/dds332. [DOI] [PubMed] [Google Scholar]
- 9.Kim Y, Stephan W. Detecting a local signature of genetic hitchhiking along a recombining chromosome. Genetics. 2002;60:765–777. doi: 10.1093/genetics/160.2.765. [DOI] [PMC free article] [PubMed] [Google Scholar]
- 10.Andersson L, Georges M. Domestic-animal genomics: deciphering the genetics of complex traits. Nat Rev Genet. 2004;5:202–212. doi: 10.1038/nrg1294. [DOI] [PubMed] [Google Scholar]
- 11.Sabeti PC, Schaffner SF, Fry B, Lohmueller J, Varilly P, Shamovsky O, et al. Positive natural selection in the humane lineage. Science. 2006;312:1614–1620. doi: 10.1126/science.1124309. [DOI] [PubMed] [Google Scholar]
- 12.Stella A, Ajmone-Marsan P, Lazzari B, Boettcher P. Identification of selection signatures in cattle breeds selected for dairy production. Genetics. 2010;185:1451–1461. doi: 10.1534/genetics.110.116111. [DOI] [PMC free article] [PubMed] [Google Scholar]
- 13.Gianola D, Simianer H, Qanbari S. A two-step method for detecting selection signatures using genetic markers. Genet Res (Camb). 2010;92:141–155. doi: 10.1017/S0016672310000121. [DOI] [PubMed] [Google Scholar]
- 14.Rothammer S, Seichter D, Förster M, Medugorac I. A genome-wide scan for signatures of differential artificial selection in ten cattle breeds. BMC Genomics. 2013;14:908. doi: 10.1186/1471-2164-14-908. [DOI] [PMC free article] [PubMed] [Google Scholar]
- 15.Akey JM. Constructing genomic maps of positive selection in humans: where do we go from here? Genome Res. 2009;19:711–722. doi: 10.1101/gr.086652.108. [DOI] [PMC free article] [PubMed] [Google Scholar]
- 16.Wright S. Coefficient of inbreeding and relationship. Am Nat. 1922;56:330–338. doi: 10.1086/279872. [DOI] [Google Scholar]
- 17.Pintus E, Sorbolini S, Albera A, Gaspa G, Dimauro C, Steri R, et al. Use of locally weighted scatterplot smoothing (LOWESS) regression to study selection signatures in Piedmontese and Italian Brown cattle breeds. Anim Genet. 2014;45:1–11. doi: 10.1111/age.12076. [DOI] [PubMed] [Google Scholar]
- 18.Kijas JW, Townley D, Dalrymple BP, Heaton MP, Maddox JF, McGrath A, et al. A genome wide survey of SNP variation reveals the genetic structure of sheep breeds. PLoS One. 2009;4:e4668. doi: 10.1371/journal.pone.0004668. [DOI] [PMC free article] [PubMed] [Google Scholar]
- 19.Flori L, Fritz S, Jaffrézic F, Boussaha M, Gut I, Heath S, et al. The genome response to artificial selection: a case of study in dairy cattle. PLoS One. 2009;4:e6595. doi: 10.1371/journal.pone.0006595. [DOI] [PMC free article] [PubMed] [Google Scholar]
- 20.MacEachern S, Hayes BJ, McEwan J, Goddard M. An examination of positive selection and changing effective population size in Angus and Holstein cattle populations (Bos taurus) using a high density SNP genotyping platform and the contribution of ancient polymorphism to genomic diversity in domestic cattle. BMC Genomics. 2009;10:181. doi: 10.1186/1471-2164-10-181. [DOI] [PMC free article] [PubMed] [Google Scholar]
- 21.Druet T, Perez-Pardal L, Charlier C, Gautier M. Identification of large selective sweeps associated with major genes in cattle. Anim Genet. 2013;44:758–762. doi: 10.1111/age.12073. [DOI] [PubMed] [Google Scholar]
- 22.Qanbari S, Pimentel ECG, Tetens J, Thaller G, Lichtner P, Sharifi AR, et al. A genome-wide scan for signature of recent selection in Holstein cattle. Anim Genet. 2010;41:377–389. doi: 10.1111/j.1365-2052.2009.02016.x. [DOI] [PubMed] [Google Scholar]
- 23.Schwarzenbacher H, Dolezal M, Flisikowski K, Seefried F, Wurmser C, Schlötterer C, et al. Combining evidence of selection with association analysis increases power to detect regions influencing complex traits in dairy cattle. BMC Genomics. 2012;13:48. doi: 10.1186/1471-2164-13-48. [DOI] [PMC free article] [PubMed] [Google Scholar]
- 24.Qanbari S, Pausch H, Jansen S, Somel M, Strom TM, Fries R, et al. Classic selective sweeps revealed by massive sequencing in cattle. PLoS Genet. 2014;10:e1004148. doi: 10.1371/journal.pgen.1004148. [DOI] [PMC free article] [PubMed] [Google Scholar]
- 25.Jombart T, Pontier D, Dufour AB. Genetic markers in the playground of multivariate analysis. Heredity (Edinb). 2009;102:330–341. doi: 10.1038/hdy.2008.130. [DOI] [PubMed] [Google Scholar]
- 26.Paschou P, Ziv E, Burchard EG, Choudry S, Rodriguez-Cintron W, Mahoney MW, et al. PCA-correlated SNPs for structure identification in worldwide human populations. PLoS Genet. 2007;3:1672–1686. doi: 10.1371/journal.pgen.0030160. [DOI] [PMC free article] [PubMed] [Google Scholar]
- 27.Zhao G, Maclean AL. A comparison of canonical discriminant analysis and principal component analysis for spectral transformation. Photogramm Eng Rem Sens. 2000;66:841–847. [Google Scholar]
- 28.Dimauro C, Cellesi M, Steri R, Gaspa G, Sorbolini S, Stella A, et al. Use of the canonical discriminant analysis to select SNP markers for bovine breed assignment and traceability purposes. Anim Genet. 2013;44:377–382. doi: 10.1111/age.12021. [DOI] [PubMed] [Google Scholar]
- 29.Matukumalli LK, Lawley CT, Schnabel RD, Taylor JF, Allan MF, Heaton MP, et al. Development and characterization of a high density SNP genotyping assay for cattle. PLoS One. 2009;4:e5350. doi: 10.1371/journal.pone.0005350. [DOI] [PMC free article] [PubMed] [Google Scholar]
- 30.Krzanowsky WJ. Principles of multivariate analysis. New York: Oxford University Press Inc.; 2003. [Google Scholar]
- 31.Bumb B. Factor analysis and development. J Dev Econ. 1982;11:109–112. doi: 10.1016/0304-3878(82)90046-3. [DOI] [Google Scholar]
- 32.Patterson N, Price AL, Reich D. Population structure and eigenanalysis. PLoS Genet. 2006;2:e190. doi: 10.1371/journal.pgen.0020190. [DOI] [PMC free article] [PubMed] [Google Scholar]
- 33.Hine E, Blows MW. Determining the effective dimensionality of the genetic variance-covariance matrix. Genetics. 2006;173:1135–1144. doi: 10.1534/genetics.105.054627. [DOI] [PMC free article] [PubMed] [Google Scholar]
- 34.Macciotta NPP, Gaspa G, Steri R, Nicolazzi EL, Dimauro C, Pieramati C, et al. Using eigenvalues as variance priors in the prediction of genomic breeding values by principal component analysis. J Dairy Sci. 2010;93:2765–2774. doi: 10.3168/jds.2009-3029. [DOI] [PubMed] [Google Scholar]
- 35.Hair JF, Jr, Andreson RE, Tatham RL. Multivariate data analysis, with readings. 2. New York: Macmillian; 1987. [Google Scholar]
- 36.de Oliveira CC, Manfrin MH, Sene FM, Jackson LL, Etges WJ. Variations on a theme: diversification of cuticular hydrocarbons in a clade of cactophilic Drosophila. BMC Evol Biol. 2011;11:179. doi: 10.1186/1471-2148-11-179. [DOI] [PMC free article] [PubMed] [Google Scholar]
- 37.Nei M. F-statistic and analysis of gene diversity in subdivided populations. Ann Hum Genet. 1977;41:225–233. doi: 10.1111/j.1469-1809.1977.tb01918.x. [DOI] [PubMed] [Google Scholar]
- 38.Wilkinson S, Wiener P, Archibald AL, Law A, Schnabel RD, McKay SD, et al. Evaluation of approaches for identifying population informative markers form high density SNP chips. BMC Genet. 2011;12:45. doi: 10.1186/1471-2156-12-45. [DOI] [PMC free article] [PubMed] [Google Scholar]
- 39.Sorbolini S, Marras G, Gaspa G, Dimauro C, Cellesi M, Valentini A, et al. Detection of selection signatures in Piemontese and Marchigiana cattle, two breeds with similar production aptitudes but different selection histories. Genet Sel Evol. 2015;47:52. doi: 10.1186/s12711-015-0128-2. [DOI] [PMC free article] [PubMed] [Google Scholar]
- 40.Ramey HR, Decker JE, McKay SD, Rolf MM, Schnabel RD, Taylor JF. Detection of selective sweeps in cattle using genome-wide SNP data. BMC Genomics. 2013;14:382. doi: 10.1186/1471-2164-14-382. [DOI] [PMC free article] [PubMed] [Google Scholar]
- 41.Mancini G, Gargani M, Chillemi G, Nicolazzi EL, Ajmone-Marsan P, Valentini A, et al. Signatures of selection in five Italian cattle breeds detected by a 54 K SNP panel. Mol Biol Rep. 2014;41:957–965. doi: 10.1007/s11033-013-2940-5. [DOI] [PMC free article] [PubMed] [Google Scholar]
- 42.Barendse W, Harrison BE, Bunch RJ, Thomas MB, Turner LB. Genome wide signatures of positive selection: the comparison of independent samples and identification of regions associated to traits. BMC Genomics. 2009;10:178. doi: 10.1186/1471-2164-10-178. [DOI] [PMC free article] [PubMed] [Google Scholar]
- 43.Hu W, Rosenberg RN, Stüve O. Prion proteins: a biological role beyond prion diseases. Acta Neurol Scand. 2007;116:75–82. doi: 10.1111/j.1600-0404.2007.00868.x. [DOI] [PubMed] [Google Scholar]
- 44.Juling K, Schwarzenbacher H, Williams JL, Fries R. A major genetic component of BSE susceptibility. BMC Biol. 2006;4:33. doi: 10.1186/1741-7007-4-33. [DOI] [PMC free article] [PubMed] [Google Scholar]
- 45.Richt JA, Hall SM. BSE case associated with prion protein gene mutation. PLoS Pathog. 2008;4:e1000156. doi: 10.1371/journal.ppat.1000156. [DOI] [PMC free article] [PubMed] [Google Scholar]
- 46.Goldmann W, Hunter N, Martin T, Dawson M, Hope J. Different forms of the bovine PrP gene have five or six copies of a short, G-C rich element within the protein coding exon. J Gen Virol. 1991;72:201–204. doi: 10.1099/0022-1317-72-1-201. [DOI] [PubMed] [Google Scholar]
- 47.Greenlee JJ, Smith JD. West Greenlee MH, Nicholson EM. Clinical and pathological features of H-type bovine spongiform encephalopathy associated with E211 K prion protein polymorphism. PLoS One. 2012;7:e38678. doi: 10.1371/journal.pone.0038678. [DOI] [PMC free article] [PubMed] [Google Scholar]
- 48.Chiesa R, Harris DA. Fishing for prion protein function. PLoS Biol. 2009;7:e1000075. doi: 10.1371/journal.pbio.1000075. [DOI] [PMC free article] [PubMed] [Google Scholar]
- 49.Kashkevich K, Humeny A, Ziegler U, Groschup MH, Nicken P, Leeb T, et al. Functional relevance of DNA polymorphisms within the promoter region of the prion protein and their association to BSE infection. FASEB J. 2007;21:1574–1585. doi: 10.1096/fj.06-7522com. [DOI] [PubMed] [Google Scholar]
- 50.Magshoodi SM, Miraei-Ashtani SR, Banabazi MH, Yeganeh HM. Polymorphism of prion protein gene (PRNP) in Iranian Holstein and two local cattle populations (Golpayegani and Sistani) of Iran. Iran J Biotechnol. 2011;9:115–119. [Google Scholar]
- 51.Uchida L, Heriyanto A, Thongchai C, Hanlt TT, Horiuchi M, Ishihara K, et al. Genetic diversity in the prion protein gene (PRNP) of domestic cattle and water buffaloes in Vietnam, Indonesia and Thailand. J Vet Med Sci. 2014;76:1001–1008. doi: 10.1292/jvms.13-0642. [DOI] [PMC free article] [PubMed] [Google Scholar]
- 52.Clawson ML, Heaton MP, Keele JW, Smith TPL, Harhay GP, Laegreid WL. Prion gene haplotypes of U.S. cattle. BMC Genet. 2006;7:51. doi: 10.1186/1471-2156-7-51. [DOI] [PMC free article] [PubMed] [Google Scholar]
- 53.Murdoch BM, Clawson ML, Yue S, Basu U, McKay S, Settles M, et al. PRPN haplotypes associated with classical BSE incidence in European Holstein cattle. PLoS One. 2010;5:e12786. doi: 10.1371/journal.pone.0012786. [DOI] [PMC free article] [PubMed] [Google Scholar]
- 54.Vernerova K, Tothova L, Mikova A, Vodraska P, Simek B, Hanusova L. BSE-associated polymorphisms in the prion protein gene: an investigation. J Anim Breed Genet. 2014;131:403–408. doi: 10.1111/jbg.12090. [DOI] [PubMed] [Google Scholar]
- 55.Rzewcka-Wojcik E, Frost A, Jedrezejczak M, Zabroski D, Pilarczyk R, Szatkowska I, et al. The PRNP ins/indel and octapeptide repeat polymorphism in Jersey cattle and their associations with production traits. J Appl Anim Res. 2013;41:244–248. doi: 10.1080/09712119.2012.742442. [DOI] [Google Scholar]
- 56.Gopal PK, Gill SH. Oligosaccharides and glycoconjugates in bovine milk and colostrum. Br J Nutr. 2000;84:S69–S74. doi: 10.1017/S0007114500002270. [DOI] [PubMed] [Google Scholar]
- 57.Ruhaak LR, Lebrilla CB. Analysis and role of oligosaccharides in milk. BMB Rep. 2012;45:442–451. doi: 10.5483/BMBRep.2012.45.8.161. [DOI] [PubMed] [Google Scholar]
- 58.Jeurnik PV, vanEsch BC, Rijnierse A, Garssen J, Knippels LM. Mechanisms underlying immune-effects of dietary oligosaccharides. Am J Clin Nutr. 2013;98:572S–577S. doi: 10.3945/ajcn.112.038596. [DOI] [PubMed] [Google Scholar]
- 59.Hennet T, Weiss A, Borsig L. Decoding breast milk oligosaccharides. Swiss Med Wkly. 2014;144:w13927. doi: 10.4414/smw.2014.13927. [DOI] [PubMed] [Google Scholar]
- 60.Tao N, Wu S, Kim J, An HJ, Hinde HJ, Power ML, et al. Evolutionary glycomics: characterization of milk oligosaccharides in primates. J Proteome Res. 2011;10:1548–1557. doi: 10.1021/pr1009367. [DOI] [PMC free article] [PubMed] [Google Scholar]
- 61.Hunt KM, Preuss J, Nissan C, Davlin CA, Williams JE, Shafi B, et al. Human milk oligosaccharides promote the growth of Staphylococci. Appl Environ Microbiol. 2012;78:4763–4770. doi: 10.1128/AEM.00477-12. [DOI] [PMC free article] [PubMed] [Google Scholar]
- 62.Gagneux P, Varki A. Evolutionary considerations in relating oligosaccharide diversity to biological function. Glycobiology. 1999;9:747–755. doi: 10.1093/glycob/9.8.747. [DOI] [PubMed] [Google Scholar]
- 63.Marcobal A, Sonnenburg JL. Human milk oligosaccharides consumption by intestinal microbiota. Clin Microbiol Infect. 2012;18:12–15. doi: 10.1111/j.1469-0691.2012.03863.x. [DOI] [PMC free article] [PubMed] [Google Scholar]
- 64.Newburg DS, Ruiz-Palacios GM, Morrow AL. Human milk glycans protects infants against enteric pathogens. Annu Rev Nutr. 2005;25:37–58. doi: 10.1146/annurev.nutr.25.050304.092553. [DOI] [PubMed] [Google Scholar]
- 65.Jeong K, Nguyen V, Kim J. Human milk oligosaccharides: the novel modulators of intestinal microbiota. BMB Rep. 2012;45:433–441. doi: 10.5483/BMBRep.2012.45.8.168. [DOI] [PubMed] [Google Scholar]
- 66.Newburg DS, Walker WA. Protection of the neonate by the innate immune system of developing gut and human milk. Pediatr Res. 2007;61:2–8. doi: 10.1203/01.pdr.0000250274.68571.18. [DOI] [PubMed] [Google Scholar]
- 67.Newburg DS, Ruiz-Palacios GM, Altaye M, Chaturvedi P, Meinzen-Derr J, Guerrero Mde L, et al. Innate protection conferred by fucosylated oligosaccharides of human milk against diarrhea in breastfed infants. Glycobiology. 2004;14:253–263. doi: 10.1093/glycob/cwh020. [DOI] [PubMed] [Google Scholar]
- 68.Lee HW, Panchalee P, Quarterman J, Jo JH, Han NS, Miller MJ, et al. Whole cell biosynthesis of a functional oligosaccharide, 2-fucosyllactose, using engineered Escherichia coli. Microb Cell Fact. 2012;11:48. doi: 10.1186/1475-2859-11-48. [DOI] [PMC free article] [PubMed] [Google Scholar]
- 69.Wickramasinghe A, Hua S, Rincon G, Islas-Trejo A, German JB, Lebrilla CB, et al. Transcriptome profiling of bovine milk oligosaccharide metabolism genes using RNA-sequencing. PLoS One. 2011;6:e18895. doi: 10.1371/journal.pone.0018895. [DOI] [PMC free article] [PubMed] [Google Scholar]
- 70.Zivkovic AM, Barile D. Bovine milk as a source of functional oligosaccharides for improving human health. Adv Nutr. 2011;2:284–289. doi: 10.3945/an.111.000455. [DOI] [PMC free article] [PubMed] [Google Scholar]
- 71.Kim JK, Samaranayake M, Pradhan S. Epigenetic mechanisms in mammals. Cell Mol Life Sci. 2009;66:596–612. doi: 10.1007/s00018-008-8432-4. [DOI] [PMC free article] [PubMed] [Google Scholar]
- 72.Scott RJ, Spielman M. Epigenetics: imprinting in plants and mammals—the same but different? Curr Biol. 2004;14:R201–R203. doi: 10.1016/j.cub.2004.02.022. [DOI] [PubMed] [Google Scholar]
- 73.Jammes H, Junien C, Chavatte-Palmer P. Epigenetic control of development and expression of quantitative traits. Reprod Fertil Dev. 2011;23:64–74. doi: 10.1071/RD10259. [DOI] [PubMed] [Google Scholar]
- 74.Singh K, Erdman RA, Swanson KM, Molenaar AJ, Maqbool NJ, Wheeler TT. Epigenetic regulation of milk production in dairy cows. J Mammary Gland Biol Neoplasia. 2010;15:101–112. doi: 10.1007/s10911-010-9164-2. [DOI] [PubMed] [Google Scholar]
- 75.Magee DA, Sikora KM, Berkowicz EW, Berry DP, Howard DJ, Mullen MP. DNA sequence polymorphisms in panel of eight candidate bovine imprinted genes and their association with performance traits in Irish Holstein–Friesian cattle. BMC Genet. 2010;11:93. doi: 10.1186/1471-2156-11-93. [DOI] [PMC free article] [PubMed] [Google Scholar]
- 76.Singh K, Molenaar AJ, Swanson KM, Gudex B, Arias JA, Erdman RA, et al. Epigenetics: a possible role in acute and trans-generational regulation of dairy cow milk production. Animal. 2012;6:375–381. doi: 10.1017/S1751731111002564. [DOI] [PubMed] [Google Scholar]
- 77.Gonfloni S, Iannizzotto V, Maiani G, Bellusci G, Ciccone S, Diederich M. P53 and Sirt1: routes of metabolisms and genome stability. Biochem Pharmacol. 2014;92:149–156. doi: 10.1016/j.bcp.2014.08.034. [DOI] [PubMed] [Google Scholar]
- 78.Zhang B, Chen J, Cheng ASL, Ko BCB. Depletion of sirtuin 1 (SIRT1) leads to epigenetic modifications of telomerase (TERT) gene in hepatocellular carcinoma cells. PLoS One. 2012;9:e84931. doi: 10.1371/journal.pone.0084931. [DOI] [PMC free article] [PubMed] [Google Scholar]
- 79.Kim S, Bi X, Czarny-Ratajczack M, Dai J, Welsh DA, Myers L, et al. Telomere maintenance genes SIRT1 and XRCC6 impact age-related decline in telomere length but only SIRT1 is associated with human longevity. Biogerontology. 2012;13:119–131. doi: 10.1007/s10522-011-9360-5. [DOI] [PMC free article] [PubMed] [Google Scholar]
- 80.Zillikens MC, van Meurs JB, Rivadeneira F, Amin N, Hofman A, Oostra BA, et al. SIRT1 genetic variation is related to BMI and risk of obesity. Diabetes. 2009;58:2828–2834. doi: 10.2337/db09-0536. [DOI] [PMC free article] [PubMed] [Google Scholar]
- 81.Li M, Sun X, Hua L, Lai X, Lau X, Lei C, et al. SIRT1 gene polymorphisms are associated with growth traits in Nanyang cattle. Mol Cell Probes. 2013;27:215–220. doi: 10.1016/j.mcp.2013.07.002. [DOI] [PubMed] [Google Scholar]
- 82.Zhao F, McParland S, Kearney F, Du L, Berry DP. Detection of selection signatures in dairy and beef cattle using high-density genomic information. Genet Sel Evol. 2015;47:49. doi: 10.1186/s12711-015-0127-3. [DOI] [PMC free article] [PubMed] [Google Scholar]
- 83.Porto-Neto LR, Barendse W. Effect of SNP origin on analyses of genetic diversity in cattle. Anim Prod Sci. 2010;50:792–800. doi: 10.1071/AN10073. [DOI] [Google Scholar]
- 84.McTavish EJ, Hillis DM. How do SNP ascertainment schemes and population demographics affect inferences about population history? BMC Genomics. 2015;16:266. doi: 10.1186/s12864-015-1469-5. [DOI] [PMC free article] [PubMed] [Google Scholar]