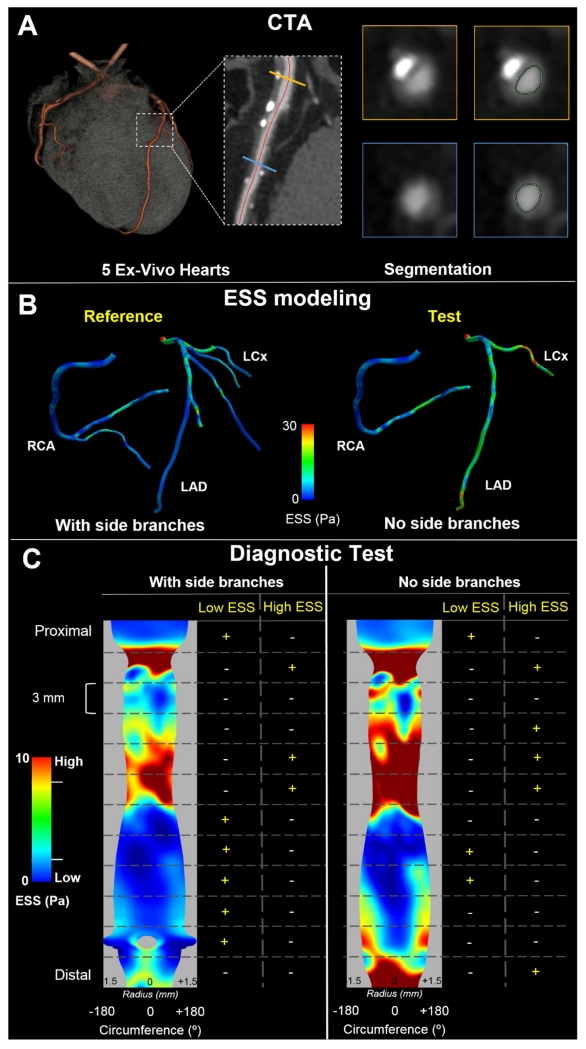
Fig. 1. Study design and methodology.
(A) 5 ex-vivo hearts were scanned with computed tomography angiography (CTA) and coronary arteries were segmented. First, the arterial centerline was semi-automatically delineated followed by semi-automated segmentation of the axial cross-sections of the lumen (inset shows two representative examples of axial lumen segmentation in the locations marked with the orange and yellow lines, respectively). (B) ESS calculation in the two models used: the entire right and left arterial tree (with side branches >1 mm; reference standard) on the left and omitting side branches (no side branches; test model) on the right. (C) Methodology used to examine the diagnostic test characteristics of the test model to detect regions of pathologic ESS. In a representative example of the mid portion of an RCA, the ESS distribution was reshaped into a 2D map and divided into 3 mm-long sections. For both the reference and the test model, a binary outcome variable was assigned to each 3 mm-long section depending on whether it was categorized as low ESS, and a second binary outcome variable was assigned based on whether it was categorized as high ESS. Branch is denoted as grey void in the reference model.

