

Abstract
Despite a wealth of evidence for the role of genetics in attention deficit hyperactivity disorder (ADHD), specific and definitive genetic mechanisms have not been identified. Pathway analyses, a subset of gene-set analyses, extend the knowledge gained from genome-wide association studies (GWAS) by providing functional context for genetic associations. However, there are numerous methods for association testing of gene sets and no real consensus regarding the best approach. The present study applied six pathway analysis methods to identify pathways associated with ADHD in two GWAS datasets from the Psychiatric Genomics Consortium. Methods that utilize genotypes to model pathway-level effects identified more replicable pathway associations than methods using summary statistics. In addition, pathways implicated by more than one method were significantly more likely to replicate. A number of brain-relevant pathways, such as RhoA signaling, glycosaminoglycan biosynthesis, fibroblast growth factor receptor activity, and pathways containing potassium channel genes, were nominally significant by multiple methods in both datasets. These results support previous hypotheses about the role of regulation of neurotransmitter release, neurite outgrowth and axon guidance in contributing to the ADHD phenotype and suggest the value of cross-method convergence in evaluating pathway analysis results.
Keywords: ADHD, pathway analyses, GWAS
INTRODUCTION
Attention deficit hyperactivity disorder (ADHD) is a common and heritable neurodevelopmental disorder that affects approximately 5% of children worldwide. The disorder is characterized by symptoms of inattention, hyperactivity, and impulsivity, and frequently persists in impairing form into adulthood [Faraone et al., 2006].
While the heritability of ADHD has been estimated to be 60–80% [Faraone et al., 2005], definitive genetic mechanisms have not yet been identified. Meta-analyses of candidate gene studies have identified genes consistently associated with ADHD (DAT1, DRD4, DRD5, 5-HTT, HTR1B, SNAP25), although collectively these account for less than 5% of genetic variance in ADHD and none are diagnostic. Unsurprisingly, such studies have also highlighted the genetic heterogeneity among ADHD patients [Faraone et al., 2005; Faraone and Khan, 2006; Kebir et al., 2009; Gizer et al., 2009; Stergiakouli and Thapar, 2010].
Genome-wide association studies (GWAS) [Neale et al., 2008; Lasky-Su et al., 2008a, b; Lesch et al., 2008; Mick et al., 2010; Neale et al., 2010a; Hinney et al., 2011; Stergiakouli et al., 2012; Ebejer et al., 2013; Yang et al., 2013; Weber et al., 2014; Sánchez-Mora et al., 2015; Zayats et al., 2015] have revealed additional candidate genes (e.g., CDH13, SPOCK3, KCNC1, KCNIP1, KCNIP4), although these variants have not achieved genome-wide significance [Franke et al., 2009; Neale et al., 2010b; Hinney et al., 2011; Sánchez-Mora et al., 2015]. The most consistent finding is the CDH13 gene, which has been implicated in two family-based GWAS [Lasky-Su et al., 2008a; Neale et al., 2008] and two case-control GWAS [Lesch et al., 2008; Neale et al., 2010a]. Results from studies of other neuropsychiatric disorders [Schizophrenia Working Group of the Psychiatric Genomics Consortium, 2014] suggest that studies with tens of thousands of subjects will likely be needed to reveal more definitive single variant associations. While these are forthcoming, additional biologically relevant analytic approaches provide opportunities for insight.
Gene set methods, which test for association between groups of genes and a trait, offer one such means of extending and contextualizing the knowledge gained from GWAS for several reasons. First, ADHD, like other complex diseases, is polygenic in nature, so testing for association with sets of related variants (e.g., those influencing a biochemical pathway) can provide a functional context for multiple genetic risk factors and potentially yield new mechanisms and treatment targets.
Second, because the number of gene sets is far fewer than the number of SNPs in a GWAS, examining gene sets improves power to detect genetic correlates by reducing the multiple testing correction. A third advantage is that effects due to genetic heterogeneity can be detected. This is related to the issue of small effect sizes, since the result of genetic heterogeneity in a study population will be a mixture of small-effect variants. If multiple small effects are present within a pathway it may be possible to detect their cumulative effect using pathway analysis methods.
ADHD is an ideal candidate for pathway analysis given the evidence supporting a polygenic model of disease susceptibility [Hamshere et al., 2013; Yang et al., 2013; Groen-Blokhuis et al., 2014; Martin et al., 2014]. A few pathway analyses, using a variety of pathway definitions and statistical methods, have been conducted on ADHD datasets. Poelmans et al. [2011] identified the top 85 genes reported in five ADHD GWAS and performed a literature search for gene functions. They reported that 45 of the 85 GWAS hits could be assigned to a neurodevelopment network involved in directed neurite outgrowth. Similarly, Cristino et al. [2014] found that ADHD-associated genes are significantly more interconnected in a protein-protein interaction network than expected by chance.
Stergiakouli et al. [2012] performed a pathway analysis on an ADHD GWAS dataset comprising 727 children with ADHD and 5,081 controls. Using the ALIGATOR method [Holmans et al., 2009] they found 13 significant pathways, and these pathways were also found to contain an excess of CNV-affected genes. Pathways related to cholesterol metabolism, cation channel activity, and CNS development were implicated.
Yang et al. [2013] applied three analysis methods, INRICH [Lee et al., 2012], DAPPLE [Rossin et al., 2011], and GREAT [McLean et al., 2010], to a GWAS dataset consisting of 1,400 cases and 963 controls of Chinese descent. Although results from the three methods differed somewhat, common processes, such as cell adhesion, glutamate synaptic development, and axon development, were implicated.
A few other studies used a candidate pathway approach, rather than testing all available pathways. Bralten et al. performed a candidate pathway analysis using data from the International Multi-site ADHD Genetics (IMAGE) study [Neale et al., 2008], consisting of 909 trios. Three candidate gene sets (dopamine/norepinephrine pathway, serotonin pathway, and neurite outgrowth pathway) were defined using the Ingenuity software (www.ingenuity.com) and a literature review. The three pathways combined were associated with hyperactive/impulsive symptomatology but not inattention symptomatology [Bralten et al., 2013].
Hammerschlag et al. tested 17 expert-curated gene sets of pre-and post-synaptic genes in the IMAGE2 case-control dataset, which consists of 896 cases and 2,455 controls [Neale et al., 2010a]. However, none were more strongly associated with ADHD than random gene sets of equal size [Hammerschlag et al., 2014].
These previous studies collectively provide further evidence of the polygenic nature of ADHD. However, they also underscore the challenge of interpreting pathway analyses, due in part to the variation among methods. This challenge is substantial because of the large number of ways to define gene sets and to test for association between a gene set and a phenotype [Mooney et al., 2014]. This issue was highlighted in the recent study [Network and Pathway Analysis Subgroup of Psychiatric Genomics Consortium, 2015] that examined gene set (a mixture of Gene Ontology and pathway models) enrichment across five different methods to rank pathways associated with schizophrenia, major depression and bipolar disorder [Network and Pathway Analysis Subgroup of Psychiatric Genomics Consortium, 2015]. They argued that combining results across analysis methods and across disorders provided the most informative and robust results.
While we follow O’Dushlaine et al. [Network and Pathway Analysis Subgroup of Psychiatric Genomics Consortium, 2015] in comparing the results of multiple methods, the present study is unlike prior pathway analyses in ADHD, in that it focuses on methods that use genotypes (rather than summary statistics) to model gene- or pathway-level association measures.
The main hypothesis was that methods utilizing genotypes would better represent the underlying genetic architecture (i.e., they do not rely solely on SNP main effects) and therefore would identify more replicable pathway associations. We applied four such methods, and compared them with two commonly used methods that utilize summary statistics.
Because we expected different results from different pathway analysis algorithms, we aimed to discover robust pathway-level effects by identifying a consensus of pathway significance across the methods and in two independent data sets. Our second hypothesis was that this ensemble approach for identifying robust pathway effects would confirm prior findings that neuro-developmental processes are important genetic mechanisms in ADHD.
DATA AND METHODS
Participants and Genotype Data
Two independent, ADHD case-control, GWAS datasets from the Psychiatric Genomics Consortium, which will be referred to as the (a) IMAGE2 (N = 3351; mean age = 10.5, SD = 2.9) and (b) German ADHD GWAS (N = 1793; mean age = 11, SD = 2.7) datasets, were used for our analysis [Neale et al., 2010a; Hinney et al., 2011]. Details about these datasets and the genotype QA/QC procedures are available in the Supplementary Methods.
Gene Sets
The pathways tested were obtained from the Pathway Commons database (www.pathwaycommons.org; version 4) [Cerami et al., 2011], which included a total of 3,074 human pathways from the following sources: Reactome (www.reactome.org; v46) [Croft et al., 2014], NCI Pathway Interaction Database (pid.nci.nih.gov; 16-AUG-2012) [Schaefer et al., 2009], HumanCyc (humancyc.org; 17.1) [Romero et al., 2005], and PANTHER (www.pantherdb.org/pathway/; 3.2.1) [Mi et al., 2013]. This initial collection of pathways was filtered by removing those with only a single gene, those with more than 300 genes, and duplicates (same name and same genes). If two pathways shared the same name, but contained different members, the gene members were merged to create a single pathway. Uniprot IDs were converted to Ensemble gene IDs using the mapping contained in the Ensembl database (version 74). The final set of 2,233 pathways ranged in size from two to 284 genes (mean = 31, SD = 39). Because of the different requirements of each analysis method, very small pathways were not tested by all methods. Of the final set of 2,233 pathways, 1980 and 2057 were tested by all methods in the IMAGE 2 and German ADHD GWAS datasets, respectively. Figure 1 provides an overview of our pathway analysis workflow.
FIG. 1.
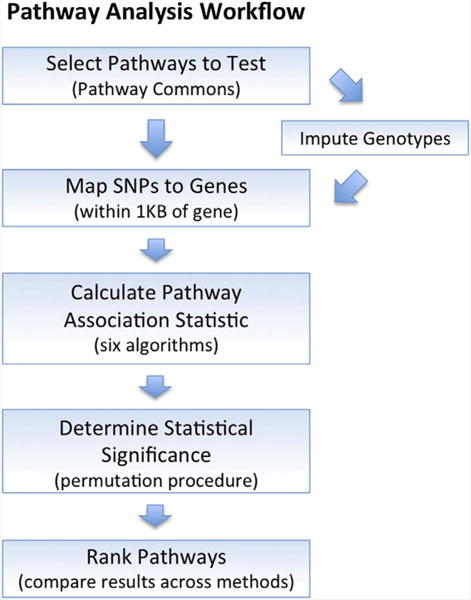
Pathway analysis workflow. Pathways tested were retrieved from the Pathway Commons database. Genotyped (and imputed) SNPs were mapped to genes in the pathways, and six pathway analysis algorithms were used to test for association with ADHD. A random pathway permutation procedure was used to adjust pathway significance for pathway size. Finally, pathways were ranked based on the number of methods reporting significance and the median P-value across methods. [Color figure can be seen in the online version of this article, available at http://wileyonlinelibrary.com/journal/ajmgb]
Mapping SNPs to Genes
SNPs were mapped to pathway genes if located within 1Kb of the gene boundaries. Gene and SNP locations were obtained from the Ensembl database (www.ensembl.org; v74). For the IMAGE 2 dataset, 52921 SNPs were mapped to 5093 pathway genes. For the German ADHD GWAS dataset, 103128 SNPs were mapped to 6136 pathway genes.
Pathway Analysis Methods
Six pathway analysis methods were applied to both datasets. Four were previously published methods that use the original genotype data rather than SNP P values: GRASS, PCgamma, PoDA, and NBF [Chen et al., 2010; Braun and Buetow, 2011; Biernacka et al., 2012; Evangelou et al., 2014]. Two were previously published methods that utilize SNP P values: GSEA [Wang et al., 2007] and Fisher’s method for combining P values [Fisher, 1932; Evangelou et al., 2014]. See the supplementary methods for more details on these algorithms. To examine the individual SNP effects contributing to pathway associations, SNP-level P values were calculated using the logistic regression procedure in Plink v1.07 [Purcell et al., 2007].
Adjustment for Pathway Size
Although often overlooked, an obvious confound in interpreting pathway analysis results is that pathways with more SNPs (“larger” pathways) are more likely to be associated with the phenotype [Wang et al., 2007, 2010; Ramanan et al., 2012; Mooney et al., 2014]. The degree of correlation between pathway size and pathway significance was therefore examined for all methods. When a significant correlation was seen, pathway P values were adjusted as follows.
For each pathway, a collection of random pathways was constructed in order to calculate a null distribution of P values. These random pathways were created to approximately match the number of genes and SNPs in the target pathway. This was accomplished by binning all genes according to the number of SNPs assigned to each gene. Because genes with a large number of SNPs are rare, bins were merged so that each contained approximately 25 genes. Random pathways were then created by sampling the appropriate number of genes from each bin. The adjusted P-value is simply the proportion of random pathways with a P-value smaller than the P-value of the target pathway.
RESULTS
Accounting for Pathway Size
We first considered the effect of pathway size in the IMAGE 2 data set. Both the PoDA and GSEA methods have built-in permutation procedures that successfully corrected for size bias (correlation P values >0.2). The four other methods, which do not inherently correct for pathway size, all had significant correlations between pathway size and significance of association to ADHD. These effects were small for PCgamma and GRASS (Pearson’s correlation coefficients, r, of 0.169 and 0.068, respectively; P values <0.002). However, the results from Fisher’s method were highly correlated with pathway size (r = 0.95, P-value <2 × 10⁻¹⁶). In addition, for the NBF method there was a significant negative correlation between pathway size and pathway significance (the inverse of the Bayes Factor) (r = −0.40, P-value <2 × 10⁻¹⁶).
Therefore, P values from the PCgamma, GRASS, and Fisher’s methods were adjusted for pathway size as described in Methods. This procedure successfully corrected the size bias for PCgamma and Fisher’s methods (correlation P values >0.13), but “overcorrected” and resulted in a slight negative correlation between size and significance for GRASS (r = −0.045, P value = 0.036) (Supplementary Fig. S1). However, the adjusted P-value was retained. The results from the NBF method could not be corrected because the hierarchical model used in that method does not allow for the application of permutation-based correction.
Similar results regarding the relationship between pathway size and significance were seen in the German ADHD GWAS (data not shown), and therefore corrections were applied in the same way. All pathway P values reported below are adjusted for pathway size either inherently or by our permutation procedure. All pathway-level association statistics (both adjusted and unadjusted) and the number of genes and SNPs in each pathway are reported in Supplementary Tables S1–S4.
Comparing Pathway Analysis Algorithms
A total of 1980 pathways were tested by all methods in the IMAGE2 dataset; the number of pathways reported as nominally significant ranged from 88 for GSEA to 61 for the NBF method. Pathways reported as nominally significant by PCgamma, Fisher’s, and GRASS were most likely to also be significant by at least one other method (74.4%, 72.2%, and 63.9%, respectively), while those reported as nominally significant by NBF were least likely to be confirmed by a second method (23.0%) (Table I).
TABLE I.
Number of Nominally Significant Pathways in the IMAGE2 Dataset
| Method | Proportion of nominally significant pathways (P ≤ 0.05) confirmed in at least one other method | Proportion of nominally significant pathways (P ≤ 0.05) confirmed in the German ADHD GWAS dataset |
|---|---|---|
| PCgamma | 61/82 (74.4%) | 14/82 (17.1%) |
| GRASS | 39/61 (63.9%) | 8/61 (13.1%) |
| PoDA | 42/66 (63.6%) | 7/66 (10.6%) |
| GSEA | 45/88 (51.1%) | 8/88 (9.1%) |
| FM | 57/79 (72.2%) | 3/79 (6.3%) |
| NBF | 14/61 (23.0%) | 1/61 (1.6%) |
Here we refer to a pathway as confirmed in two different ways: (1) when it is nominally significant (P≤0.05) by a second analysis method in the IMAGE2 dataset (center column); or (2) when it is nominally significant using the same analysis method in an independent dataset (the German ADHD GWAS dataset; right column).
This initial finding replicated well in the German ADHD GWAS dataset, with the Fisher’s, PCgamma, and GRASS methods overlapping most with other methods (73.3%, 70.6%, and 70.4%, respectively) and the NBF method overlapping the least (25.0%).
Fleiss’ Kappa measure demonstrates that overall agreement among methods is low (k = 0.183 in IMAGE 2 and 0.208 in the German dataset), but that agreement increases among similar methods (for GRASS and PCgamma, k = 0.465 and 0.524 in the IMAGE 2 and German data sets, respectively; for GSEA and Fisher’s method, k = 0.372 and 0.227).
With regard to cross-sample replication of particular pathways associated with ADHD, PCgamma had the highest proportion of nominally significant pathways that were also reported as nominally significant in the German ADHD GWAS dataset (17.1%), followed by GRASS (13.1%) and PoDA (10.6%). For the PCgamma method, the number of pathways found to be nominally significant in both datasets is significantly greater than would be expected by chance (Fisher’s exact test P-value = 4.09 × 10⁻⁵). GSEA, Fisher’s Method, and the NBF method all had replication rates below 10% (Table I). This finding is consistent with our hypothesis that methods utilizing genotypes would identify more replicable associations, the NBF method being an exception.
Next, for each pathway, P values from both cohorts were combined, into a single P-value for each algorithm, using Fisher’s method [Fisher, 1932]. This resulted in five P values for each pathway, one for each of the analysis methods (excluding NBF, which reports a Bayes factor, not a P-value).
Then for each pathway, we counted the number of methods reporting a P-value ≤0.05 and calculated the median P-value. Table II shows the top 25 most significant pathways ranked by median pooled P-value.
TABLE II.
Top 25 Most Significant Pathways
| Pathway | Pathway size (SNP count) IMAGE2/German ADHD GWAS | Methods with nominal significance | Median pooled P-value |
|---|---|---|---|
| Ca activated K+ channels* | 262/487 | 5 | 0.0010 |
| FGFR1b ligand binding and activation | 56/126 | 5 | 0.0011 |
| FGFR2b ligand binding and activation | 64/145 | 5 | 0.0023 |
| Potassium channels | 1065/2117 | 4 | 0.0026 |
| Signaling mediated by p38-gamma and p38-delta | 58/108 | 4 | 0.0043 |
| Validated targets of C-MYC transcriptional repression* | 243/548 | 5 | 0.0060 |
| RhoA signaling pathway | 295/507 | 4 | 0.0075 |
| tnf/stress related signaling | 111/217 | 5 | 0.0089 |
| Histidine degradation III* | 41/79 | 3 | 0.0113 |
| Dermatan sulfate biosynthesis | 85/206 | 4 | 0.0116 |
| Chondroitin sulfate biosynthesis | 219/451 | 4 | 0.0157 |
| Metabolism of angiotensinogen to angiotensins* | 70/143 | 3 | 0.0160 |
| Clearance of nuclear envelope membranes from chromatin* | 39/83 | 4 | 0.0165 |
| Histidine catabolism* | 21/52 | 4 | 0.0184 |
| FGFR1 ligand binding and activation | 69/166 | 5 | 0.0197 |
| RAC1 signaling pathway | 282/446 | 4 | 0.0197 |
| Regulation of signaling by CBL | 180/322 | 3 | 0.0224 |
| Caspase-mediated cleavage of cytoskeletal proteins | 128/208 | 4 | 0.0238 |
| FGFR2 ligand binding and activation | 81/201 | 4 | 0.0240 |
| Human cytomegalovirus and map kinase pathways | 69/143 | 3 | 0.0295 |
| Thromboxane A2 receptor signaling* | 821/1586 | 3 | 0.0299 |
| LKB1 signaling events | 305/482 | 3 | 0.0304 |
| FGFR ligand binding and activation | 103/243 | 3 | 0.0312 |
| Nitric oxide stimulates guanylate cyclase | 843/1710 | 4 | 0.0324 |
| Role of mal in rho-mediated activation of srf* | 66/107 | 3 | 0.0337 |
Pathways in bold were reported nominally significant by multiple methods in both the IMAGE2 and German ADHD GWAS datasets. Pathways marked with an* were also nominally significant by at least one method in the post-imputation analysis (Supplementary Tables S3 and S4). For each pathway the following information is provided: the number of SNPs assigned to the pathway in each data set, the number of analysis methods reporting the pathway nominally significant, and the median pooled P-value across all the analysis methods.
Examination of Discordant Pathways
Given the limited amount of overlap seen among the different methods, discordant pathways were examined in order to gain a better understanding of the differences between methods. We use the term “discordant pathway” to mean one that is reported as significant by only a single method (9.3% of pathways tested by all methods).
We hypothesize that differences in the distribution of SNP-level P values among pathways may explain some of the discordance across methods. In other words, different methods may detect different type of genetic effects. For instance, some methods may be more sensitive to pathways containing a few strong to moderate SNP effects, while others are more sensitive to pathways with many small SNP effects.
To examine differences in genetic effects for discordant pathways, SNP-level P values were calculated using the logistic regression procedure in Plink v1.07 [Purcell et al., 2007]. Next, each gene was assigned the minimum P-value among all SNPs in that gene. The distribution of the minimum gene-level P-value and the median gene-level P-value for each method’s discordant pathways are plotted in Supplementary Figures S2 and S3. These plots show that gene-level effects within pathways implicated by one method are, in some cases, significantly different from the gene-level effects within pathways implicated by another method. For example, pathways reported as significant by only PCgamma tend to have a smaller minimum gene-level P-value compared to pathways reported as significant by only GSEA (t-test P-value <0.0005 for both IMAGE 2 and German ADHD GWAS datasets). This suggests that PCgamma is sensitive to pathways with only a few moderate SNP effects, while GSEA is sensitive to pathways with many small effects. This difference can also been seen when comparing the proportion of pathways reported as nominally significant between two distinct subsets of pathways: 1) pathways containing no SNPs with moderate main effects (P ≤ 0.001), but at least 10% SNPs with weak effects (P ≤ 0.05); and 2) pathways with at least 1% SNPs with a moderate main effect (P ≤ 0.001). In the IMAGE 2 dataset, the proportion of pathways reported nominally significant by PCgamma and GSEA are 9.0% and 12.7%, respectively for subset 1, and 24.1% and 8.33%, respectively for subset 2. A similar pattern is seen for the German ADHD GWAS data set (Supplemental Figures S4 and S5).
While these results are suggestive of different sensitivities across analysis methods, further study is needed. In particular, methods should be compared in GWAS datasets with different overall P-value distributions.
However, these observations clearly support previous assertions [Gui et al., 2011; Network and Pathway Analysis Subgroup of Psychiatric Genomics Consortium, 2015] that it may be beneficial to apply multiple analysis methods to a dataset, since the results from different methods can be complementary. Furthermore, as others have suggested [Network and Pathway Analysis Subgroup of Psychiatric Genomics Consortium, 2015], it is likely that pathways reported as significant by multiple methods are more stable and replicable (not due to spurious genetic effects).
For example, in the IMAGE2 data set 40 pathways were reported as nominally significant by three or more methods, while 179 pathways were nominally significant by only a single method. A significantly higher proportion of the pathways identified by three or more methods replicated in the German ADHD GWAS dataset (13 of 40; 32.5%), compared to the pathways identified by only a single method (27 of 179; 15.1%) (Fisher’s exact test P-value = 0.021).
In addition to the different sensitivities among analysis methods, the small sample size of each data set is likely a contributing factor for the discordance between results in the two datasets. Because of this we place higher confidence in pathways that are implicated by multiple methods in both datasets.
Seven pathways were reported to be nominally significant by more than one method in both cohorts (pathways bold in Table II). Q–Q plots of SNP-level P values for all SNPs in each of these pathways show an excess of weak effects (Fig. 2). While these seven pathways do not capture all SNP associations in our data sets, the concentration of association signal within these pathways provides support for their role in the etiology of ADHD, and is consistent with a polygenic model of disease risk for ADHD, as has been demonstrated previously [Hamshere et al., 2013; Yang et al., 2013; Groen-Blokhuis et al., 2014; Martin et al., 2014; Wray et al., 2014].
FIG. 2.
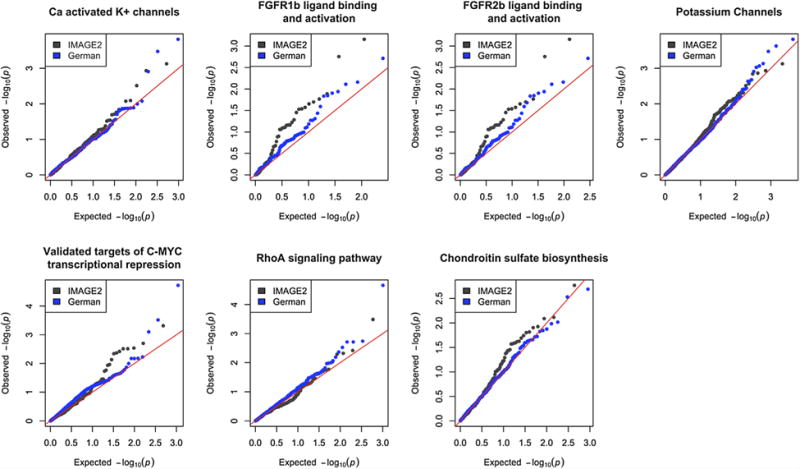
Q–Q plots for seven pathways found nominally significant in both cohorts. Each pathway shows an excess of small SNP effects consistent with a polygenic model of disease risk. [Color figure can be seen in the online version of this article, available at http://wileyonlinelibrary.com/journal/ajmgb]
Supplemental analyses were done to evaluate the use of imputed genotypes for pathway analysis (Supplementary Tables S5 and S6).
Given the small effect sizes seen for many genetic associations identified in complex diseases, increased sample sizes are going to be necessary to produce high-confidence findings. Combining data sets for a mega-analysis is not always possible, however, since array differences and population structure make it difficult to integrate genotype data from different studies. Because we focused on genotype-based analysis methods, we chose to apply methods to each cohort individually and then compare results. Pathway analysis methods that utilize summary statistics have the advantage of more easily allowing the integration of data from multiple studies. However, even with a large sample size, it will be important to replicate findings in an independent data set.
Specific Pathway Findings for ADHD
Pathways reported as nominally significant by at least two methods in both data sets are: Ca activated K+ channels, FGFR1b ligand binding and activation, FGFR2b ligand binding and activation, Potassium Channels, Validated targets of C-MYC transcriptional repression, RhoA signaling pathway, and Chondroitin sulfate biosynthesis. All of these are expressed in the brain and are relevant to neuro-development. Given the limited sample sizes of our data sets, these results should be viewed as preliminary. However, there is ample evidence in the literature that these pathways may play a role in ADHD. Here we summarize this evidence and present biological context for these pathways.
The most significant pathway by any method in our analysis was the Potassium Channels pathway, with a pooled size-adjusted P-value of 4.11 × 10⁻⁵ for the GRASS algorithm. Potassium channel genes have been implicated in a number of previous GWAS and pathway analyses of ADHD using different data sets from those analyzed here [Lasky-Su et al., 2008a; Lesch et al., 2008; Neale et al., 2008; Franke et al., 2009; Yang et al., 2013]. These findings from genetic studies are supported by research on the role of potassium channels in the regulation of dopaminergic transmission [Dragicevic et al., 2015]. For instance, Fulton et al. found that a Kv1 channel blocker significantly increased dopamine release in mouse midbrain dopamine neurons, and provided evidence that the D2 dopamine autoreceptor attenuates dopamine release through regulation of Kv1 voltage-gated potassium channels [Fulton et al., 2011].
Pharmacological studies provide additional support for the role of potassium channels in ADHD. Kobayashi et al. found that atomoxetine, a norepinephrine reuptake inhibitor approved for the treatment of ADHD, significantly reduced inward currents through G-protein-activated inwardly rectifying K+ (GIRK) channels expressed in Xenopus oocytes [Kobayashi et al., 2010]. And Sasaki et al. conducted a preliminary study on the efficacy of tipepidine, reported to inhibit GIRK channel currents [Hamasaki et al., 2013], to treat childhood ADHD. They found that ADHD Rating Scale IV scores improved significantly for 10 ADHD patients after taking 30 mg of tipepidine daily for 4 weeks [Sasaki et al., 2014].
Figure 3 shows gene-level association measures (minimum SNP P-value) for all potassium channel genes, along with interactions from the STRING protein-protein interaction database (low-confidence interactions excluded) [Franceschini et al., 2013]. Also plotted are the distributions of distance scores, S, (as calculated by the PoDA algorithm) showing a significant difference between cases and controls (odds ratios of 1.41 and 1.81 for the IMAGE 2 and German ADHD GWAS study groups, respectively; FDR adjusted P values <3 × 10⁻¹³).
FIG. 3.
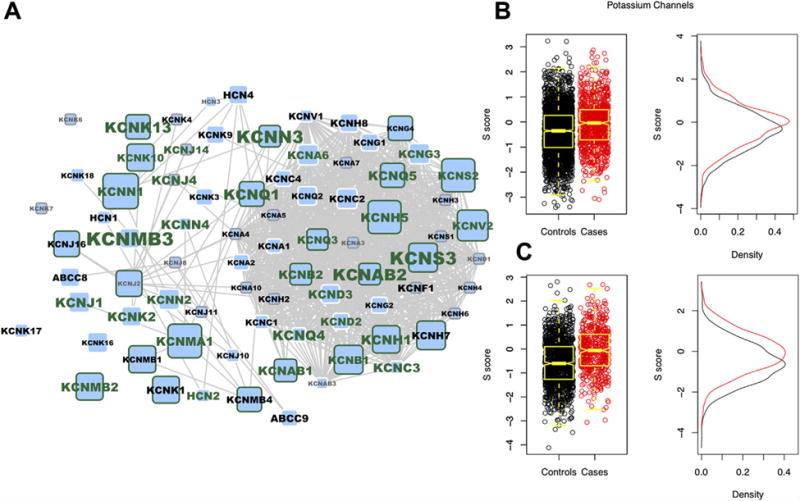
(A) The Potassium Channels pathway genes overlaid onto the STRING protein–protein interaction network (low confidence interactions, STRING score <0.5, were removed). Node size is proportion to the IMAGE2 gene P-value, while label size is proportional to the German ADHD GWAS gene P-value. Green node border indicates a gene P-value ≤0.05 in the IMAGE2 dataset, and a green label indicates the same in the German ADHD GWAS dataset. Gray border or label indicates no SNPs present in a particular gene. (B and C) Pathway of Distinction Analysis (PoDA) S scores showing a difference in the distribution between cases and controls in both the IMAGE2 and German ADHD GWAS datasets, respectively. [Color figure can be seen in the online version of this article, available at http://wileyonlinelibrary.com/journal/ajmgb]
One hypothesis regarding the etiology of ADHD involves a dysregulation of developmental processes, particularly axon guidance and neurite outgrowth [Poelmans et al., 2011; Rivero et al., 2013]. A number of the pathways implicated in this study contribute to these neuro-developmental processes, namely the RhoA signaling pathway, pathways involved in proteoglycan metabolism, and pathways involved in fibroblast growth factor receptor activation. Although the role of c-Myc in neurodevelopment has not been studied extensively [Mainwaring et al., 2010], c-Myc knockout models show significant effects on brain growth [Wey and Knoepfler, 2010], and the interaction between c-Myc and RhoA in cancer is well known [Sauzeau et al., 2010].
A recent review by Stankiewicz and others summarizes the abundance of literature describing the role of Rho family GTPases in neurodevelopment [Stankiewicz and Linseman, 2014]. RhoA in particular has been shown to regulate neuronal survival and migration during development [Sanno et al., 2010; Katayama et al., 2011; Cappello et al., 2012]. Note that 14 of 45 genes (31%) in the RhoA signaling pathway are also members of the much larger axon guidance pathway (280 genes).
Chondroitin sulfate proteoglycans (CSPGs) are thought to act as inhibitory signals to guide neuronal growth [Maeda et al., 2011; Siebert and Osterhout, 2011]. It has been proposed that the inhibitory effect of the Rho/ROCK pathway on neurite growth is mediated by CSPGs [Monnier et al., 2003; Siebert et al., 2014]. Monnier et al. demonstrated that both an inhibitor of Rho and an inhibitor of the ROCK kinase were able to block CSPG inhibition of axon growth [Monnier et al., 2003]. Siebert et al. confirmed this finding and further showed that chondroitinase ABC, which removes the glycosaminoglycan chains from CSPGs, counteracts the inhibition of axon growth [Siebert and Osterhout, 2011].
Interestingly, the SPOCK3 gene, which encodes a calcium-binding proteoglycan expressed in the brain, has previously been implicated in GWAS of ADHD and personality disorders [Neale et al., 2008; Weber et al., 2014].
Like CSPGs, heparan sulfate proteoglycans (HSPGs) have been shown to play a role in axon guidance and neuronal growth [de Wit and Verhaagen, 2007; Nishimura et al., 2010]. HSPGs may exert their effect through the activation of fibroblast growth factor receptor (FGFR) signaling pathways [Jastrebova et al., 2006], which are important in neurite outgrowth [Anderson et al., 2005; Beesley et al., 2014] and other neuronal development processes [Woodbury and Ikezu, 2014]. It has also been suggested that FGRFs may interact with the ADHD-susceptibility gene CDH13 [Rivero et al., 2013].
DISCUSSION
An abundance of data on the genetics of ADHD has been produced in recent years. Although results have been inconsistent, patterns are beginning to emerge. First, multiple studies have demonstrated the polygenic nature of the disorder [Yang et al., 2013; Hamshere et al., 2013; Groen-Blokhuis et al., 2014; Martin et al., 2014]. The observation that ADHD is likely due to the cumulative effect of many genes, each contributing only a small effect on their own, may explain much of the discordance among previous genetic association studies, which have largely been underpowered to detect small effects.
The predictive value of polygenic risk scores provides hope that larger studies will be able to produce more definitive genetic associations [Wray et al., 2014]. Furthermore, when taking a higher-level view of the reported genetic associations, a number of cellular processes have consistently been implicated. For instance, genes involved in cell-cell signaling, adhesion, and neural development have been top hits in multiple studies.
Gaining insights by taking this process-level view is precisely the goal of pathway analyses. Given the variety of algorithms for aggregating SNP-level effects, we aimed to combine the results from multiple analysis methods to identify pathways most likely associated with ADHD—as well as to evaluate different types of pathway methods and the merits of an ensemble approach.
We identified seven pathways reported as nominally significant by multiple analysis methods in two independent data sets (Table II). Each of these pathways contains an excess of small SNP effects consistent with a polygenic model of disease risk. While confirmation in larger studies is needed, these pathway associations provide additional support for previous hypotheses about the etiology of ADHD, particularly related to the regulation of neurotransmitter release, and neuro-developmental processes.
Methods that test for the cumulative effect of multiple genes increase the strength of secondary analyses, and allow researchers to extract additional information from currently available datasets. Our results provide much needed guidance regarding the methodology of investigating gene-set (or pathway) associations in complex diseases. In particular our results suggest that identifying a consensus across multiple methods provides more replicable associations.
In addition, our results suggest that not all pathway methods are created equal. First, they do not all effectively handle gene set size bias, which must be taken into account in future analyses. Second, methods utilizing genotypes may be more robust than those that rely on summary statistics. Further investigation of this second point should be a priority.
In conclusion, these findings will help improve our ability to place individual genetic associations within a meaningful biological context, and in turn will help focus future research and guide the development of hypotheses about the mechanisms of susceptibility to ADHD and other complex diseases.
Supplementary Material
Acknowledgments
Work on this project was supported by the following grants: MH099064 (Drs. Nigg, Wilmot, and Mooney), NIH/NCATS UL1TR000128 (Drs. McWeeney, Mooney and Wilmot), and DFG HE1446/9-1 (Drs. Hinney and Hebebrand). Professor Faraone was supported by the K.G. Jebsen Centre for Research on Neuropsychiatric Disorders, University of Bergen, Bergen, Norway, the European Community’s Seventh Framework Programme (FP7/2007–2013) under grant agreement n°602805, and NIMH grants R13MH059126 and R01MH094469. Barbara Franke was supported by grants from the Netherlands Organization for Scientific Research (NWO), that is, the NWO Brain & Cognition Excellence Program (grant 433-09-229) and a Vici grant (grant 016-130-669). She also received funding from the European Community’s Seventh Framework Programme under grant agreements n°602805 (Aggressotype) and n°602450 (IMAGEMEND), from the European Community’s Horizon 2020 Programme under grant agreement n°643051 (MiND), and from the BD2 K Initiative of NIH (grant number U54 EB020403). Andreas Reif was supported by the European Community’s Seventh Framework Programme (FP7/2007–2013) under grant agreement n°602805.
IMAGE2 Consortium
Stephen V. Faraone (Departments of Psychiatry and Neuroscience & Physiology, State University of New York, Syracuse, New York, USA, and K.G. Jebsen Centre for Neuropsychiatric Disorders, Department of Biomedicine, University of Bergen, Bergen, Norway); Marcel Romanos and Andreas Warnke (Department Of Child and Adolescent Psychiatry, Psychosomatics and Psychotherapy, University of Würzburg, Würzburg, Germany); Andreas Reif (Department of Psychiatry, University of Frankfurt, Frankfurt, Germany); Susanne Walitza (Department of Child and Adolescent Psychiatry, University of Zurich, Zurich, Switzerland, and Department of Child and Adolescent Psychiatry, Psychosomatics and Psychotherapy, University of Würzburg, Würzburg, Germany); Herbert Roeyers (Ghent University, Belgium); Barbara Franke (Radboud University Medical Centre, Department of Genetics and Department of Psychiatry, Nijmegen, The Netherlands); Jan K. Buitelaar (Radboud University Medical Centre, Nijmegen, The Netherlands); Klaus-Peter Lesch (Division of Molecular Psychiatry, ADHD Clinical Research Unit, Department of Psychiatry, Psychosomatics and Psychotherapy, University of Würzburg, Germany, and Department of Neuroscience, School for Mental Health and Neuroscience (MHENS), Maastricht University, The Netherlands); Lindsey Kent (School of Medicine, University of St Andrews, St Andrews, Fife, Scotland, UK); Alejandro Arias Vasquez (Radboud University Medical Centre, Nijmegen, Donders Institute for Brain Cognition and Behavior, Departments of Psychiatry, Human Genetics and Cognitive Neuroscience, The Netherlands); Anita Thapar, Joanna Martin, Michael C. O’Donovan, Michael J. Owen (MRC Centre for Neuropsychiatric Genetics and Genomics and Institute of Psychological Medicine and Clinical Neurosciences, Cardiff, Wales, UK); Nigel Williams and Peter Holmans (MRC Centre for Neuropsychiatric Genetics and Genomics, Department of Psychological Medicine and Neurology, School of Medicine, Cardiff University, Cardiff, Wales, UK); Kate Langley (MRC Centre for Neuropsychiatric Genetics and Genomics, School of Medicine, Cardiff University, Cardiff, Wales, UK); Christine Freitag (Department of Child and Adolescent Psychiatry, Psychosomatics and Psychotherapy, JW Goethe University, Frankfurt am Main, Germany); Nanda Lambregts-Rommelse (Karakter Child and Adolescent Psychiatry University Center and Department of Psychiatry, Donders Institute for Brain, Cognition and Behavior, Radboud University Nijmegen Medical Centre, Nijmegen, The Netherlands); Richard J.L. Anney (Department of Psychiatry, Trinity College Dublin, Trinity Centre for Health Sciences, St. James’s Hospital, Dublin, Ireland); Aisling Mulligan (School of Medicine and Medical Science, University College Dublin, Dublin, Ireland); Aribert Rothenberger (University Medical Centre Göttingen, Germany); Hans-Christoph Steinhausen (Research Unit for Child and Adolescent Psychiatry, Psychiatric Hospital, Aalborg University Hospital, Denmark; Clinical Psychology and Epidemiology, Department of Psychology, University of Basel, Switzerland; Department of Child and Adolescent Psychiatry, University of Zurich, Switzerland); Michael Gill (Department of Psychiatry, School of Medicine, Trinity College Dublin, Dublin, Ireland); Philip Asherson (Social, Genetic & Developmental Psychiatry Centre, Institute of Psychiatry, King’s College London, London, UK); T. Trang Nguyen (University of Marburg, Marburg, Germany); Joseph Biederman (Massachusetts General Hospital; Harvard Medical School, USA); Alysa E. Doyle (Massachusetts General Hospital, USA); Jasmin Romanos (Department of Child and Adolescent Psychiatry, Psychosomatics and Psychotherapy, University of Würzburg, Würzburg, Germany); Olga Rivero (Division of Molecular Psychiatry, ADHD Clinical Research Unit, Department of Psychiatry, Psychosomatics and Psychotherapy, University of Würzburg, Germany); Haukur Palmason (Institute of Psychobiology, Department of Neurobehavioral Genetics, University of Trier, Trier, Germany); Jobst Meyer (Institute of Psychobiology, Department of Neurobehavioral Genetics, University of Trier, Trier, Germany); Tobias J. Renner (Department of Child and Adolescent Psychiatry, Universitätsklinikum Tübingen, Tübingen, Germany).
German ADHD GWAS Group
Anke Hinney, Özgür Albayrak, Anna-Lena Volckmar, and Johannes Hebebrand (Department of Child and Adolescent Psychiatry, Psychosomatics and Psychotherapy, University Hospital Essen, University of Duisburg-Essen, Essen, Germany); Astrid Dempfle (Institute of Medical Informatics and Statistics, Christian-Albrechts University Kiel, Kiel, Germany); Sven Cichon and Per Hoffmann (Institute of Neuroscience and Medicine (INM-1), Structural and Functional Organization of the Brain, Genomic Imaging, Research Center Juelich, Juelich, Germany and Institute of Human Genetics, University of Bonn, Bonn, Germany and Human Genomics Research Group, Division of Medical Genetics, University Hospital Basel, Department of Biomedicine); Markus M. Nöthen (Institute of Human Genetics, University of Bonn, Bonn, Germany and Department of Genomics, Life & Brain Center, University of Bonn, Bonn, Germany); Stefan Schreiber (Institute of Clinical Molecular Biology, University Hospital Schleswig-Holstein, Kiel, Germany); Susanne Möbus (Institute for Medical Informatics, Biometry and Epidemiology (IMIBE), University of Duisburg-Essen, Essen, Germany); H.-Erich Wichmann (Institute of Epidemiology I, Helmholtz Zentrum München, German Research Center for Environmental Health, Ingolstädter Landstr. 1, 85764 Neuherberg, Germany; Institute of Medical Informatics, Biometry and Epidemiology, Ludwig-Maximilians-Universität, Munich, Germany; and Institute of Medical Statistics and Epidemiology, Technical University Munich, Germany); Beate Herpertz-Dahlmann (Department of Child and Adolescent Psychiatry, Psychosomatics and Psychotherapy, RWTH Aachen, University Clinics, Aachen, Germany); Judith Sinzig (Department of Child and Adolescent Psychiatry, University of Cologne, Cologne, Germany and Department of Child and Adolescent Psychiatry and Psychotherapy, LVR – Clinic Bonn, Bonn, Germany); Gerd Lehmkuhl (Department of Child and Adolescent Psychiatry, University of Cologne, Cologne, Germany); Tobias J. Renner (Department of Child and Adolescent Psychiatry, Universitätsklinikum Tübingen, Tübingen, Germany); Marcel Romanos (Department of Child and Adolescent Psychiatry, University of Würzburg, Würzburg, Germany); Benno G. Schimmelmann (University Hospital of Child- and Adolescent Psychiatry, University of Bern, Bern, Switzerland).
Footnotes
Conflict of interest: Barbara Franke received a speaker fee from Merz. All other authors declare no conflict of interest.
SUPPORTING INFORMATION
Additional supporting information may be found in the online version of this article at the publisher’s web-site.
References
- Anderson AA, Kendal CE, Garcia-Maya M, Kenny AV, Morris-Triggs SA, Wu T, Reynolds R, Hohenester E, Saffell JL. A peptide from the first fibronectin domain of NCAM acts as an inverse agonist and stimulates FGF receptor activation, neurite outgrowth and survival. J Neurochem. 2005;95(2):570–583. doi: 10.1111/j.1471-4159.2005.03417.x. [DOI] [PubMed] [Google Scholar]
- Beesley PW, Herrera-Molina R, Smalla KH, Seidenbecher C. The Neuroplastin adhesion molecules: Key regulators of neuronal plasticity and synaptic function. J Neurochemistry. 2014;131(3):268–283. doi: 10.1111/jnc.12816. [DOI] [PubMed] [Google Scholar]
- Biernacka JM, Jenkins GD, Wang L, Moyer AM, Fridley BL. Use of the gamma method for self-contained gene-set analysis of SNP data. Eur J Hum Genet. 2012;20(5):565–571. doi: 10.1038/ejhg.2011.236. [DOI] [PMC free article] [PubMed] [Google Scholar]
- Bralten J, Franke B, Waldman I, Rommelse N, Hartman C, Asherson P, Banaschewski T, Ebstein RP, Gill M, Miranda A, Oades RD, Roeyers H, Rothenberger A, Sergeant JA, Oosterlaan J, Sonuga-Barke E, Steinhausen HC, Faraone SV, Buitelaar JK, Arias-Vásquez A. Candidate genetic pathways for attention-deficit/hyperactivity disorder (ADHD) show association to hyperactive/impulsive symptoms in children with ADHD. J Am Acad Child Adolesc Psychiatry. 2013;52(11):1204–1212.e1. doi: 10.1016/j.jaac.2013.08.020. [DOI] [PubMed] [Google Scholar]
- Braun R, Buetow K. Pathways of distinction analysis: A new technique for multi-SNP analysis of GWAS data. PLoS Genet. 2011;7(6):e1002101. doi: 10.1371/journal.pgen.1002101. [DOI] [PMC free article] [PubMed] [Google Scholar]
- Cappello S, Böhringer CR, Bergami M, Conzelmann KK, Ghanem A, Tomassy GS, Arlotta P, Mainardi M, Allegra M, Caleo M, van Hengel J, Brakebusch C, Götz M. A radial glia-specific role of RhoA in double cortex formation. Neuron. 2012;73(5):911–924. doi: 10.1016/j.neuron.2011.12.030. [DOI] [PubMed] [Google Scholar]
- Cerami EG, Gross BE, Demir E, Rodchenkov I, Babur O, Anwar N, Schultz N, Bader GD, Sander C. Pathway commons, a web resource for biological pathway data. Nucleic Acids Res. 2011;39:D685–D690. doi: 10.1093/nar/gkq1039. [DOI] [PMC free article] [PubMed] [Google Scholar]
- Chen LS, Hutter CM, Potter JD, Liu Y, Prentice RL, Peters U, Hsu L. Insights into colon cancer etiology via a regularized approach to gene set analysis of GWAS data. Am J Hum Genet. 2010;86(6):860–871. doi: 10.1016/j.ajhg.2010.04.014. [DOI] [PMC free article] [PubMed] [Google Scholar]
- Cristino AS, Williams SM, Hawi Z, An JY, Bellgrove MA, Schwartz CE, Costa Lda F, Claudianos C. Neurodevelopmental and neuropsychiatric disorders represent an interconnected molecular system. Mol Psychiatry. 2014;19(3):294–301. doi: 10.1038/mp.2013.16. [DOI] [PubMed] [Google Scholar]
- Croft D, Mundo AF, Haw R, Milacic M, Weiser J, Wu G, Caudy M, Garapati P, Gillespie M, Kamdar MR, Jassal B, Jupe S, Matthews L, May B, Palatnik S, Rothfels K, Shamovsky V, Song H, Williams M, Birney E, Hermjakob H, Stein L, D’Eustachio P. The reactome pathway knowledgebase. Nucleic Acids Res. 2014;42:D472–D477. doi: 10.1093/nar/gkt1102. (Database issue) [DOI] [PMC free article] [PubMed] [Google Scholar]
- de Wit J, Verhaagen J. Proteoglycans as modulators of axon guidance cue function. Adv Exp Med Biol. 2007;600:73–89. doi: 10.1007/978-0-387-70956-7_7. [DOI] [PubMed] [Google Scholar]
- Dragicevic E, Schiemann J, Liss B. Dopamine midbrain neurons in health and Parkinson’s disease: Emerging roles of voltage-gated calcium channels and ATP-sensitive potassium channels. Neuroscience. 2015;284C:798–814. doi: 10.1016/j.neuroscience.2014.10.037. [DOI] [PubMed] [Google Scholar]
- Ebejer JL, Duffy DL, van der Werf J, Wright MJ, Montgomery G, Gillespie NA, Hickie IB, Martin NG, Medland SE. Genome-wide association study of inattention and hyperactivity-impulsivity measured as quantitative traits. Twin Res Hum Genet. 2013;16(2):560–574. doi: 10.1017/thg.2013.12. [DOI] [PubMed] [Google Scholar]
- Evangelou M, Dudbridge F, Wernisch L. Two novel pathway analysis methods based on a hierarchical model. Bioinformatics. 2014;30(5):690–697. doi: 10.1093/bioinformatics/btt583. [DOI] [PMC free article] [PubMed] [Google Scholar]
- Faraone SV, Khan SA. Candidate gene studies of attention-deficit/hyperactivity disorder. J Clin Psychiatry. 2006;67(Suppl 8):13–20. [PubMed] [Google Scholar]
- Faraone SV, Perlis RH, Doyle AE, Smoller JW, Goralnick JJ, Holmgren MA, Sklar P. Molecular genetics of attention-deficit/hyperactivity disorder. Biol Psychiatry. 2005;57(11):1313–1323. doi: 10.1016/j.biopsych.2004.11.024. [DOI] [PubMed] [Google Scholar]
- Faraone SV, Biederman J, Mick E. The age-dependent decline of attention deficit hyperactivity disorder: A meta-analysis of follow-up studies. Psychol Med. 2006;36(2):159–165. doi: 10.1017/S003329170500471X. [DOI] [PubMed] [Google Scholar]
- Fisher RA. Statistical methods for research workers. 4th. London: Oliver and Boyd; 1932. [Google Scholar]
- Franceschini A, Szklarczyk D, Frankild S, Kuhn M, Simonovic M, Roth A, Lin J, Minguez P, Bork P, von Mering C, Jensen LJ. STRING v9.1: Protein–protein interaction networks, with increased coverage and integration. Nucleic Acids Res. 2013;41:D808–D815. doi: 10.1093/nar/gks1094. (Database issue) [DOI] [PMC free article] [PubMed] [Google Scholar]
- Franke B, Neale BM, Faraone SV. Genome-wide association studies in ADHD. Hum Genet. 2009;126(1):13–50. doi: 10.1007/s00439-009-0663-4. [DOI] [PMC free article] [PubMed] [Google Scholar]
- Fulton S, Thibault D, Mendez JA, Lahaie N, Tirotta E, Borrelli E, Bouvier M, Tempel BL, Trudeau LE. Contribution of Kv1.2 voltage-gated potassium channel to D2 autoreceptor regulation of axonal dopamine overflow. J Biol Chem. 2011;286(11):9360–9372. doi: 10.1074/jbc.M110.153262. [DOI] [PMC free article] [PubMed] [Google Scholar]
- Gizer IR, Ficks C, Waldman ID. Candidate gene studies of ADHD: A meta-analytic review. Hum Genet. 2009;126(1):51–90. doi: 10.1007/s00439-009-0694-x. [DOI] [PubMed] [Google Scholar]
- Groen-Blokhuis MM, Middeldorp CM, Kan KJ, Abdellaoui A, van Beijsterveldt CE, Ehli EA, Davies GE, Scheet PA, Xiao X, Hudziak JJ, Hottenga JJ, Psychiatric Genomics Consortium ADHD Working Group. Neale BM, Boomsma DI. Attention-deficit/hyperactivity disorder polygenic risk scores predict attention problems in a population-based sample of children. J Am Acad Child Adolesc Psychiatry. 2014;53(10):1123–9.e6. doi: 10.1016/j.jaac.2014.06.014. [DOI] [PubMed] [Google Scholar]
- Gui H, Li M, Sham PC, Cherny SS. Comparisons of seven algorithms for pathway analysis using the WTCCC Crohn’s Disease dataset. BMC Res Notes. 2011;7(4):386. doi: 10.1186/1756-0500-4-386. [DOI] [PMC free article] [PubMed] [Google Scholar]
- Hamasaki R, Shirasaki T, Soeda F, Takahama K. Tipepidine activates VTA dopamine neuron via inhibiting dopamine D2 receptor-mediated inward rectifying K+ current. Neuroscience. 2013;12(252):24–34. doi: 10.1016/j.neuroscience.2013.07.044. [DOI] [PubMed] [Google Scholar]
- Hammerschlag AR, Polderman TJ, de Leeuw C, Tiemeier H, White T, Smit AB, Verhage M, Posthuma D. Functional gene-set analysis does not support a major role for synaptic function in attention deficit/hyperactivity disorder (ADHD) Genes (Basel) 2014;5(3):604–614. doi: 10.3390/genes5030604. [DOI] [PMC free article] [PubMed] [Google Scholar]
- Hamshere ML, Langley K, Martin J, Agha SS, Stergiakouli E, Anney RJ, Buitelaar J, Faraone SV, Lesch KP, Neale BM, Franke B, Sonuga-Barke E, Asherson P, Merwood A, Kuntsi J, Medland SE, Ripke S, Steinhausen HC, Freitag C, Reif A, Renner TJ, Romanos M, Romanos J, Warnke A, Meyer J, Palmason H, Vasquez AA, Lambregts-Rommelse N, Roeyers H, Biederman J, Doyle AE, Hakonarson H, Rothenberger A, Banaschewski T, Oades RD, McGough JJ, Kent L, Williams N, Owen MJ, Holmans P, O’Donovan MC, Thapar A. High loading of polygenic risk for ADHD in children with comorbid aggression. Am J Psychiatry. 2013;170(8):909–916. doi: 10.1176/appi.ajp.2013.12081129. [DOI] [PMC free article] [PubMed] [Google Scholar]
- Hinney A, Scherag A, Jarick I, Albayrak O, Pütter C, Pechlivanis S, Dauvermann MR, Beck S, Weber H, Scherag S, Nguyen TT, Volckmar AL, Knoll N, Faraone SV, Neale BM, Franke B, Cichon S, Hoffmann P, Nöthen MM, Schreiber S, Jöckel KH, Wichmann HE, Freitag C, Lempp T, Meyer J, Gilsbach S, Herpertz-Dahlmann B, Sinzig J, Lehmkuhl G, Renner TJ, Warnke A, Romanos M, Lesch KP, Reif A, Schimmelmann BG, Hebebrand J, Psychiatric GWAS Consortium: ADHD subgroup Genome-wide association study in German patients with attention deficit/hyperactivity disorder. Am J Med Genet B Neuropsychiatr Genet. 2011;156B(8):888–897. doi: 10.1002/ajmg.b.31246. [DOI] [PubMed] [Google Scholar]
- Holmans P, Green EK, Pahwa JS, Ferreira MA, Purcell SM, Sklar P, Owen MJ, O’Donovan MC, Craddock N. Gene ontology analysis of GWA study data sets provides insights into the biology of bipolar disorder. Am J Hum Genet. 2009;85(1):13–24. doi: 10.1016/j.ajhg.2009.05.011. [DOI] [PMC free article] [PubMed] [Google Scholar]
- Jastrebova N, Vanwildemeersch M, Rapraeger AC, Giménez-Gallego G, Lindahl U, Spillmann D. Heparan sulfate-related oligosaccharides in ternary complex formation with fibroblast growth factors 1 and 2 and their receptors. J Biol Chem. 2006;281(37):26884–26892. doi: 10.1074/jbc.M600806200. [DOI] [PubMed] [Google Scholar]
- Katayama K, Melendez J, Baumann JM, Leslie JR, Chauhan BK, Nemkul N, Lang RA, Kuan CY, Zheng Y, Yoshida Y. Loss of RhoA in neural progenitor cells causes the disruption of adherens junctions and hyperproliferation. Proc Natl Acad Sci USA. 2011;108(18):7607–7612. doi: 10.1073/pnas.1101347108. [DOI] [PMC free article] [PubMed] [Google Scholar]
- Kebir O, Tabbane K, Sengupta S, Joober R. Candidate genes and neuropsychological phenotypes in children with ADHD: Review of association studies. J Psychiatry Neurosci. 2009;34(2):88–101. [PMC free article] [PubMed] [Google Scholar]
- Kobayashi T, Washiyama K, Ikeda K. Inhibition of G-protein-activated inwardly rectifying K+ channels by the selective norepinephrine reuptake inhibitors atomoxetine and reboxetine. Neuropsychopharmacology. 2010;35(7):1560–1569. doi: 10.1038/npp.2010.27. [DOI] [PMC free article] [PubMed] [Google Scholar]
- Lasky-Su J, Neale BM, Franke B, Anney RJ, Zhou K, Maller JB, Vasquez AA, Chen W, Asherson P, Buitelaar J, Banaschewski T, Ebstein R, Gill M, Miranda A, Mulas F, Oades RD, Roeyers H, Rothenberger A, Sergeant J, Sonuga-Barke E, Steinhausen HC, Taylor E, Daly M, Laird N, Lange C, Faraone SV. Genome-wide association scan of quantitative traits for attention deficit hyperactivity disorder identifies novel associations and confirms candidate gene associations. Am J Med Genet B Neuropsychiatr Genet. 2008;147B(8):1345–1354. doi: 10.1002/ajmg.b.30867. [DOI] [PubMed] [Google Scholar]
- Lasky-Su J, Anney RJ, Neale BM, Franke B, Zhou K, Maller JB, Vasquez AA, Chen W, Asherson P, Buitelaar J, Banaschewski T, Ebstein R, Gill M, Miranda A, Mulas F, Oades RD, Roeyers H, Rothenberger A, Sergeant J, Sonuga-Barke E, Steinhausen HC, Taylor E, Daly M, Laird N, Lange C, Faraone SV. Genome-wide association scan of the time to onset of attention deficit hyperactivity disorder. Am J Med Genet B Neuropsychiatr Genet. 2008;147B(8):1355–1358. doi: 10.1002/ajmg.b.30869. [DOI] [PMC free article] [PubMed] [Google Scholar]
- Lee PH, O’Dushlaine C, Thomas B, Purcell SM. INRICH: Interval-based enrichment analysis for genome-wide association studies. Bioinformatics. 2012;28(13):1797–1799. doi: 10.1093/bioinformatics/bts191. [DOI] [PMC free article] [PubMed] [Google Scholar]
- Lesch KP, Timmesfeld N, Renner TJ, Halperin R, Röser C, Nguyen TT, Craig DW, Romanos J, Heine M, Meyer J, Freitag C, Warnke A, Romanos M, Schäfer H, Walitza S, Reif A, Stephan DA, Jacob C. Molecular genetics of adult ADHD: Converging evidence from genome-wide association and extended pedigree linkage studies. J Neural Transm. 2008;115(11):1573–1585. doi: 10.1007/s00702-008-0119-3. [DOI] [PubMed] [Google Scholar]
- Maeda N, Ishii M, Nishimura K, Kamimura K. Functions of chondroitin sulfate and heparan sulfate in the developing brain. Neurochem Res. 2011;36(7):1228–1240. doi: 10.1007/s11064-010-0324-y. [DOI] [PubMed] [Google Scholar]
- Mainwaring LA, Bhatia B, Kenney AM. Myc on my mind: A transcription factor family’s essential role in brain development. Oncotarget. 2010;1(2):86–88. doi: 10.18632/oncotarget.113. [DOI] [PMC free article] [PubMed] [Google Scholar]
- Martin J, Hamshere ML, Stergiakouli E, O’Donovan MC, Thapar A. Genetic risk for attention-deficit/hyperactivity disorder contributes to neurodevelopmental traits in the general population. Biol Psychiatry. 2014;76(8):664–671. doi: 10.1016/j.biopsych.2014.02.013. [DOI] [PMC free article] [PubMed] [Google Scholar]
- McLean CY, Bristor D, Hiller M, Clarke SL, Schaar BT, Lowe CB, Wenger AM, Bejerano G. GREAT improves functional interpretation of cis-regulatory regions. Nat Biotechnol. 2010;28(5):495–501. doi: 10.1038/nbt.1630. [DOI] [PMC free article] [PubMed] [Google Scholar]
- Mi H, Muruganujan A, Thomas PD. PANTHER in modeling the evolution of gene function, and other gene attributes, in the context of phylogenetic trees. Nucleic Acids Res. 2013;41:D377–D386. doi: 10.1093/nar/gks1118. (Database issue) [DOI] [PMC free article] [PubMed] [Google Scholar]
- Mick E, Todorov A, Smalley S, Hu X, Loo S, Todd RD, Biederman J, Byrne D, Dechairo B, Guiney A, McCracken J, McGough J, Nelson SF, Reiersen AM, Wilens TE, Wozniak J, Neale BM, Faraone SV. Family-based genome-wide association scan of attention-deficit/hyperactivity disorder. J Am Acad Child Adolesc Psychiatry. 2010;49(9):898–905.e3. doi: 10.1016/j.jaac.2010.02.014. [DOI] [PMC free article] [PubMed] [Google Scholar]
- Monnier PP, Sierra A, Schwab JM, Henke-Fahle S, Mueller BK. The Rho/ROCK pathway mediates neurite growth-inhibitory activity associated with the chondroitin sulfate proteoglycans of the CNS glial scar. Mol Cell Neurosci. 2003;22(3):319–330. doi: 10.1016/s1044-7431(02)00035-0. [DOI] [PubMed] [Google Scholar]
- Mooney MA, Nigg JT, McWeeney SK, Wilmot B. Functional and genomic context in pathway analysis of GWAS data. Trends Genet. 2014;30(9):390–400. doi: 10.1016/j.tig.2014.07.004. [DOI] [PMC free article] [PubMed] [Google Scholar]
- Neale BM, Lasky-Su J, Anney R, Franke B, Zhou K, Maller JB, Vasquez AA, Asherson P, Chen W, Banaschewski T, Buitelaar J, Ebstein R, Gill M, Miranda A, Oades RD, Roeyers H, Rothenberger A, Sergeant J, Steinhausen HC, Sonuga-Barke E, Mulas F, Taylor E, Laird N, Lange C, Daly M, Faraone SV. Genome-wide association scan of attention deficit hyperactivity disorder. Am J Med Genet B Neuropsychiatr Genet. 2008;147B(8):1337–1344. doi: 10.1002/ajmg.b.30866. [DOI] [PMC free article] [PubMed] [Google Scholar]
- Neale BM, Medland S, Ripke S, Anney RJ, Asherson P, Buitelaar J, Franke B, Gill M, Kent L, Holmans P, Middleton F, Thapar A, Lesch KP, Faraone SV, Daly M, Nguyen TT, Schäfer H, Steinhausen HC, Reif A, Renner TJ, Romanos M, Romanos J, Warnke A, Walitza S, Freitag C, Meyer J, Palmason H, Rothenberger A, Hawi Z, Sergeant J, Roeyers H, Mick E, Biederman J. Case-control genome-wide association study of attention-deficit/hyperactivity disorder. J Am Acad Child Adolesc Psychiatry. 2010;49(9):906–920. doi: 10.1016/j.jaac.2010.06.007. [DOI] [PMC free article] [PubMed] [Google Scholar]
- Neale BM, Medland SE, Ripke S, Asherson P, Franke B, Lesch KP, Faraone SV, Nguyen TT, Schäfer H, Holmans P, Daly M, Steinhausen HC, Freitag C, Reif A, Renner TJ, Romanos M, Romanos J, Walitza S, Warnke A, Meyer J, Palmason H, Buitelaar J, Vasquez AA, Lambregts-Rommelse N, Gill M, Anney RJ, Langely K, O’Donovan M, Williams N, Owen M, Thapar A, Kent L, Sergeant J, Roeyers H, Mick E, Biederman J, Doyle A, Smalley S, Loo S, Hakonarson H, Elia J, Todorov A, Miranda A, Mulas F, Ebstein RP, Rothenberger A, Banaschewski T, Oades RD, Sonuga-Barke E, McGough J, Nisenbaum L, Middleton F, Hu X, Nelson S, Psychiatric GWAS Consortium: ADHD Subgroup Meta-analysis of genome-wide association studies of attention-deficit/hyperactivity disorder. J Am Acad Child Adolesc Psychiatry. 2010;49(9):884–897. doi: 10.1016/j.jaac.2010.06.008. [DOI] [PMC free article] [PubMed] [Google Scholar]
- Network and Pathway Analysis Subgroup of Psychiatric Genomics Consortium. Psychiatric genome-wide association study analyses implicate neuronal, immune and histone pathways. Nat Neurosci. 2015;18(2):199–209. doi: 10.1038/nn.3922. [DOI] [PMC free article] [PubMed] [Google Scholar]
- Nishimura K, Ishii M, Kuraoka M, Kamimura K, Maeda N. Opposing functions of chondroitin sulfate and heparan sulfate during early neuronal polarization. Neuroscience. 2010;169(4):1535–1547. doi: 10.1016/j.neuroscience.2010.06.027. [DOI] [PubMed] [Google Scholar]
- Poelmans G, Pauls DL, Buitelaar JK, Franke B. Integrated genome-wide association study findings: Identification of a neurodevelopmental network for attention deficit hyperactivity disorder. Am J Psychiatry. 2011;168(4):365–377. doi: 10.1176/appi.ajp.2010.10070948. [DOI] [PubMed] [Google Scholar]
- Purcell S, Neale B, Todd-Brown K, Thomas L, Ferreira MA, Bender D, Maller J, Sklar P, de Bakker PI, Daly MJ, Sham PC. PLINK: A tool set for whole-genome association and population-based linkage analyses. Am J Hum Genet. 2007;81(3):559–575. doi: 10.1086/519795. [DOI] [PMC free article] [PubMed] [Google Scholar]
- Ramanan VK, Shen L, Moore JH, Saykin AJ. Pathway analysis of genomic data: Concepts, methods, and prospects for future development. Trends Genet. 2012;28(7):323–332. doi: 10.1016/j.tig.2012.03.004. [DOI] [PMC free article] [PubMed] [Google Scholar]
- Rivero O, Sich S, Popp S, Schmitt A, Franke B, Lesch KP. Impact of the ADHD-susceptibility gene CDH13 on development and function of brain networks. Eur Neuropsychopharmacol. 2013;23(6):492–507. doi: 10.1016/j.euroneuro.2012.06.009. [DOI] [PubMed] [Google Scholar]
- Romero P, Wagg J, Green ML, Kaiser D, Krummenacker M, Karp PD. Computational prediction of human metabolic pathways from the complete human genome. Genome Biol. 2005;6(1):R2. doi: 10.1186/gb-2004-6-1-r2. [DOI] [PMC free article] [PubMed] [Google Scholar]
- Rossin EJ, Lage K, Raychaudhuri S, Xavier RJ, Tatar D, Benita Y, International Inflammatory Bowel Disease Genetics Constortium. Cotsapas C, Daly MJ. Proteins encoded in genomic regions associated with immune-mediated disease physically interact and suggest underlying biology. PLoS Genet. 2011;7(1):e1001273. doi: 10.1371/journal.pgen.1001273. [DOI] [PMC free article] [PubMed] [Google Scholar]
- Sánchez-Mora C, Ramos-Quiroga JA, Bosch R, Corrales M, Garcia-Martínez I, Nogueira M, Pagerols M, Palomar G, Richarte V, Vidal R, Arias-Vasquez A, Bustamante M, Forns J, Gross-Lesch S, Guxens M, Hinney A, Hoogman M, Jacob C, Jacobsen KK, Kan CC, Kiemeney L, Kittel-Schneider S, Klein M, Onnink M, Rivero O, Zayats T, Buitelaar J, Faraone SV, Franke B, Haavik J, Johansson S, Lesch KP, Reif A, Sunyer J, Bayés M, Casas M, Cormand B, Ribasés M. Case-control genome-wide association study of persistent attention-deficit hyperactivity disorder identifies FBXO33 as a novel susceptibility gene for the disorder. Neuropsychopharmacology. 2015;40(4):915–926. doi: 10.1038/npp.2014.267. [DOI] [PMC free article] [PubMed] [Google Scholar]
- Sanno H, Shen X, Kuru N, Bormuth I, Bobsin K, Gardner HA, Komljenovic D, Tarabykin V, Erzurumlu RS, Tucker KL. Control of postnatal apoptosis in the neocortex by RhoA-subfamily GTPases determines neuronal density. J Neurosci. 2010;30(12):4221–4231. doi: 10.1523/JNEUROSCI.3318-09.2010. [DOI] [PMC free article] [PubMed] [Google Scholar]
- Sasaki T, Hashimoto K, Tachibana M, Kurata T, Okawada K, Ishikawa M, Kimura H, Komatsu H, Ishikawa M, Hasegawa T, Shiina A, Hashimoto T, Kanahara N, Shiraishi T, Iyo M. Tipepidine in children with attention deficit/hyperactivity disorder: A 4-week, open-label, preliminary study. Neuropsychiatr Dis Treat. 2014;24(10):147–151. doi: 10.2147/NDT.S58480. [DOI] [PMC free article] [PubMed] [Google Scholar]
- Sauzeau V, Berenjeno IM, Citterio C, Bustelo XR. A transcriptional cross-talk between RhoA and c-Myc inhibits the RhoA/Rock-dependent cytoskeleton. Oncogene. 2010;29(26):3781–3792. doi: 10.1038/onc.2010.134. [DOI] [PMC free article] [PubMed] [Google Scholar]
- Schaefer CF, Anthony K, Krupa S, Buchoff J, Day M, Hannay T, Buetow KH. PID: The pathway interaction database. Nucleic Acids Res. 2009;37:D674–D679. doi: 10.1093/nar/gkn653. (Database issue) [DOI] [PMC free article] [PubMed] [Google Scholar]
- Schizophrenia Working Group of the Psychiatric Genomics Consortium. Biological insights from 108 schizophrenia-associated genetic loci. Nature. 2014;511(7510):421–427. doi: 10.1038/nature13595. [DOI] [PMC free article] [PubMed] [Google Scholar]
- Siebert JR, Osterhout DJ. The inhibitory effects of chondroitin sulfate proteoglycans on oligodendrocytes. J Neurochem. 2011;119(1):176–188. doi: 10.1111/j.1471-4159.2011.07370.x. [DOI] [PubMed] [Google Scholar]
- Siebert JR, Conta Steencken A, Osterhout DJ. Chondroitin sulfate proteoglycans in the nervous system: Inhibitors to repair. Biomed Res Int. 2014;2014:845323. doi: 10.1155/2014/845323. [DOI] [PMC free article] [PubMed] [Google Scholar]
- Stankiewicz TR, Linseman DA. Rho family GTPases: Key players in neuronal development, neuronal survival, and neurodegeneration. Front Cell Neurosci. 2014;7(8):314. doi: 10.3389/fncel.2014.00314. [DOI] [PMC free article] [PubMed] [Google Scholar]
- Stergiakouli E, Thapar A. Fitting the pieces together: Current research on the genetic basis of attention-deficit/hyperactivity disorder (ADHD) Neuropsychiatr Dis Treat. 2010;6:551–560. doi: 10.2147/NDT.S11322. [DOI] [PMC free article] [PubMed] [Google Scholar]
- Stergiakouli E, Hamshere M, Holmans P, Langley K, Zaharieva I, deCODE Genetics; Psychiatric GWAS Consortium. Hawi Z, Kent L, Gill M, Williams N, Owen MJ, O’Donovan M, Thapar A. Investigating the contribution of common genetic variants to the risk and pathogenesis of ADHD. Am J Psychiatry. 2012;169(2):186–194. doi: 10.1176/appi.ajp.2011.11040551. [DOI] [PMC free article] [PubMed] [Google Scholar]
- Wang K, Li M, Bucan M. Pathway-based approaches for analysis of genomewide association studies. Am J Hum Genet. 2007;81(6):1278–1283. doi: 10.1086/522374. [DOI] [PMC free article] [PubMed] [Google Scholar]
- Wang K, Li M, Hakonarson H. Analysing biological pathways in genome-wide association studies. Nat Rev Genet. 2010;11(12):843–854. doi: 10.1038/nrg2884. [DOI] [PubMed] [Google Scholar]
- Weber H, Scholz CJ, Jacob CP, Heupel J, Kittel-Schneider S, Erhardt A, Hempel S, Schmidt B, Kiel T, Gessner A, Lesch KP, Reif A. SPOCK3, a risk gene for adult ADHD and personality disorders. Eur Arch Psychiatry Clin Neurosci. 2014;264(5):409–421. doi: 10.1007/s00406-013-0476-2. [DOI] [PubMed] [Google Scholar]
- Wey A, Knoepfler PS. C-myc and N-myc promote active stem cell metabolism and cycling as architects of the developing brain. Oncotarget. 2010;1(2):120–130. doi: 10.18632/oncotarget.116. [DOI] [PMC free article] [PubMed] [Google Scholar]
- Woodbury ME, Ikezu T. Fibroblast growth factor-2 signaling in neurogenesis and neurodegeneration. J Neuroimmune Pharmacol. 2014;9(2):92–101. doi: 10.1007/s11481-013-9501-5. [DOI] [PMC free article] [PubMed] [Google Scholar]
- Wray NR, Lee SH, Mehta D, Vinkhuyzen AA, Dudbridge F, Middeldorp CM. Research review: Polygenic methods and their application to psychiatric traits. J Child Psychol Psychiatry. 2014;55(10):1068–1087. doi: 10.1111/jcpp.12295. [DOI] [PubMed] [Google Scholar]
- Yang L, Neale BM, Liu L, Lee SH, Wray NR, Ji N, Li H, Qian Q, Wang D, Li J, Faraone SV, Wang Y, Doyle AE, Reif A, Rothenberger A, Franke B, Sonuga-Barke EJ, Steinhausen HC, Buitelaar JK, Kuntsi J, Biederman J, Lesch KP, Kent L, Asherson P, Oades RD, Loo SK, Nelson SF, Faraone SV, Smalley SL, Banaschewski T, Arias Vasquez A, Todorov A, Charach A, Miranda A, Warnke A, Thapar A, Neale BM, Cormand B, Freitag C, Mick E, Mulas F, Middleton F, HakonarsonHakonarson H, Palmason H, Schäfer H, Roeyers H, McGough JJ, Romanos J, Crosbie J, Meyer J, Ramos-Quiroga JA, Sergeant J, Elia J, Langely K, Nisenbaum L, Romanos M, Daly MJ, Ribasés M, Gill M, O’Donovan M, Owen M, Casas M, Bayés M, Lambregts-Rommelse N, Williams N, Holmans P, Anney RJ, Ebstein RP, Schachar R, Medland SE, Ripke S, Walitza S, Nguyen TT, Renner TJ, Hu X. Polygenic transmission and complex neuro developmental network for attention deficit hyperactivity disorder: Genome-wide association study of both common and rare variants. Am J Med Genet B Neuropsychiatr Genet. 2013;162B(5):419–430. doi: 10.1002/ajmg.b.32169. [DOI] [PMC free article] [PubMed] [Google Scholar]
- Zayats T, Athanasiu L, Sonderby I, Djurovic S, Westlye LT, Tamnes CK, Fladby T, Aase H, Zeiner P, Reichborn-Kjennerud T, Knappskog PM, Knudsen GP, Andreassen OA, Johansson S, Haavik J. Genomewide analysis of attention deficit hyperactivity disorder in norway. PLoS ONE. 2015;10(4):e0122501. doi: 10.1371/journal.pone.0122501. [DOI] [PMC free article] [PubMed] [Google Scholar]
Associated Data
This section collects any data citations, data availability statements, or supplementary materials included in this article.