

Abstract
Biomedical in vivo imaging has been playing an essential role in diagnoses and treatment in modern medicine. However, compared with the fast development of medical imaging systems, the medical imaging informatics, especially automated prediction, has not been fully explored. In our paper, we compared different feature extraction and classification methods for prediction pipeline to analyze in vivo endomicroscopic images, obtained from patients who are at risks for the development of gastric disease, esophageal adenocarcionoma. Extensive experiment results show that the selected feature representation and prediction algorithms achieved high accuracy in both binary and multi-class prediction tasks.
I INTRODUCTION
Barretts esophagus (BE) is a well-known risk factor for esophageal adenocarcinoma (EAC) and traditional methods usually uses histopathology to reach a diagnosis [1]. Over the last 9 years, new techniques, termed as optical endomi-croscopy (OE), has emerged as a new biomedical imaging modality that allow physicians to make real-time clinical decisions about the grade of dysplasia, and potentially treat the patient during the same endoscopic session, rather than waiting for biopsy results to return before performing any treatments.
Currently, the pathophysiology of BE is poorly understood, and there are no widely accepted screening tests to determine the prevalence of this disease. To this fact, physicians identify patients with BE by either selectively screening patients using risk factors or identify patients with BE at the time of an upper endoscopy performed for an unrelated reason.
Although this new paradigm for diagnostic and treatment protocols shows promises, wide clinical acceptance of OE still faces several key challenges, mainly in the identification of patients with potential diseases, and the interpretation of the images obtained.
The recent advancement of computer vision methods has enabled us to find a meaningful representation for images, based on the keypoints in the image collection, and these representations not only provide a semantic understanding of the images but also help in classifying images to different categories using machine learning algorithms.
In this paper, we propose an automated prediction pipeline to provide decision support for physicians. The difficulties in image classification tasks lie in the extraction of features to represent images [2], and we examined various feature extraction techniques in Section III. We then applied our pipeline to two classification tasks: discriminating of low-risk patients from high-risk patients, and identification of progressive stages of dysplasia in the optical biopsies of BE patients. Experiments results presented in Section IV validated effectiveness of our pipelines.
II BACKGROUND AND RELATED WORK
A. Endomicroscopic Imaging
Currently, three types of commercial OE systems are available for clinical use: endoscope-based confocal laser endomicroscopy (eCLE), confocal laser en-domicroscopy (pCLE), and volumetric laser endomicroscopy (VLE). Among these technologies, eCLE, pCLE and VLE have been developed and approved in 2004, 2006 and 2013 respectively.
Published trials using two technologies, eCLE and pCLE, on OE applications in diagnosing high-risk BE patients, where low-risk BE patients have non-dysplastic BE (NDBE) or low-grade dysplasia (LGD) and high-risk patients have high-grade dysplasia (HGD) or intramucosal carcinoma (IMC), suggest that eCLE has better performance than pCLE in diagnosis of esophageal diseases [3]. Therefore, we have developed automated classification algorithms for eCLE images.
B. Image Classification
Image classification is the task that identify the category of an image based on its content. The success of an image classification relies heavily on the representation of an image, or the term ‘Feature Extraction’. Once we pick a proper set of features to represent the images, we then can apply most classification algorithms in machine learning to classify a new image based on the knowledge we learn from training data.
Extensive work has been researched in the computer vision and medical imaging community to learn suitable features for images. Typically, there three categories of feature learning methods that are commonly used: local features including Scale-Invariant Features (SIFT) features [4] and related visual words method, discriminative methods including Bag-of-Words representation [5], Spatial Pyramid matching, and generative methods like topic models.
III METHODS
In this part, we first briefly describe the dataset we used in this study, and then introduce our pipeline of image classification using common Bag-of-Words method.
A. Data Collection
Endomicroscopic images used in our experiment are obtained in Division of Digestive Diseases, Emory University School of Medicine with approval. In our dataset, we have images collected from patients undergoing endoscope-based Confocal Laser Endomicroscopy (eCLE) procedures for BE. Their optical esophageal biopsies were captured prospectively and annotated by an expert gastrointestinal endomicroscopists as SQ, NDBE, LGD, HGD or IMC. The description and statistics of these images are summarized in Table I.
Table 1.
Statistics about BE dataset
| Subtype | Number of Images |
|---|---|
| Squamous | 42 |
| Non-Dysplastic BE | 154 |
| Low Grade Dysplasia | 24 |
| High Grade Dysplasia | 4 |
| Intraepithelial Carcinoma | 44 |
We subcategorized these images into two groups: low-risk (SQ, NDBE and LGD) and high-risk (HGD and IMC) categories. Biopsies characterized to be low-risk have 220 images in total, while images identified as high-risk including 49 images in total. Figure 1 illustrates sample images from each type.
Fig 1.
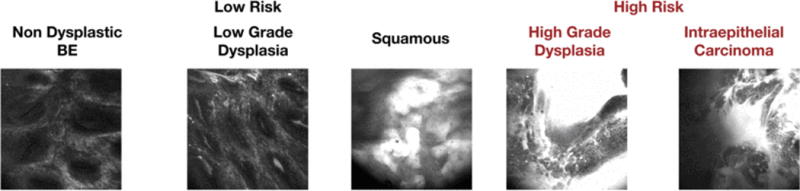
Sample optical endomicroscopy from low-risk and high-risk patients
B. Feature Extraction
The feature extraction part is performed in a bag-of-words fashion, as illustrated in Fig. 2.
Fig 2.
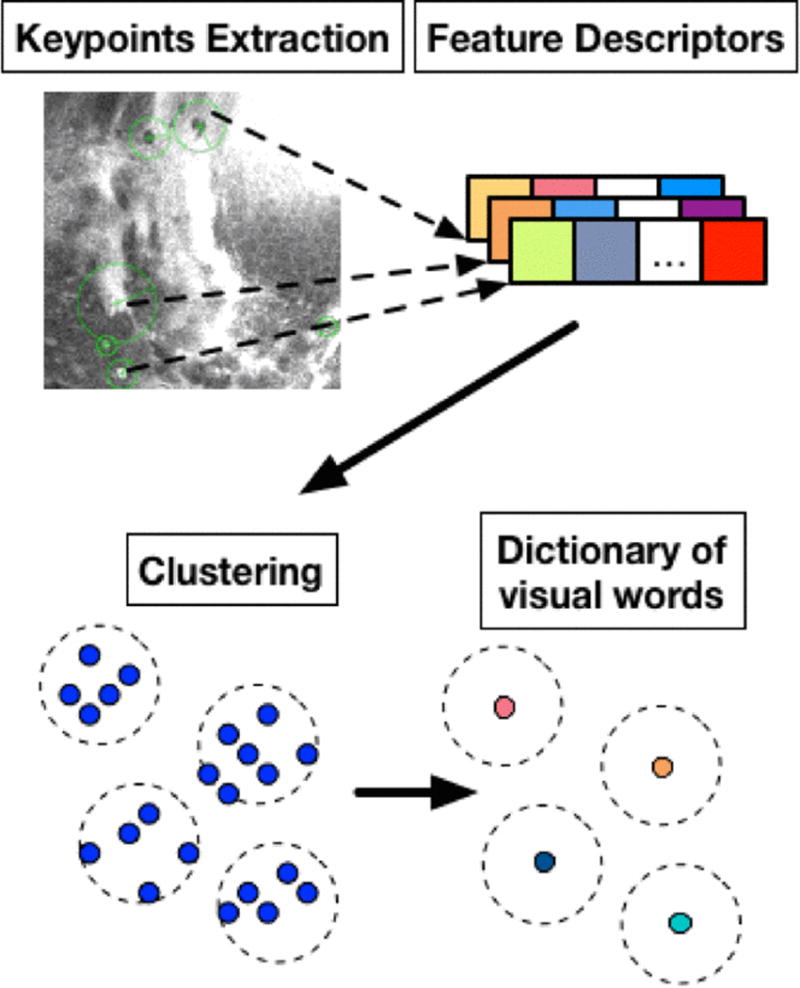
Feature extraction step
We can detect keypoints of an image and obtain summary descriptor vectors of the image region surrounding these keypoints. Given a large collection of images from different classes, similar images from the same class are supposed to share more similar keypoints and descriptors among them. Such proximity can be evaluated through a clustering process, in which similar descriptors fall into the same cluster, and the clustering centers, usually term as visual words, form a dictionary to quantitively characterize the similarity between descriptors. Matching similar descriptors help to match similar keypoints and thus helps to categorize images. In our dataset, around 500 keypoints are detected for each image.
Once the dictionary is built, for an incoming new image, we can extract features using the dictionary, as shown in Fig. 3. We first detect keypoints in this image, and assign each keypoint to its closest visual words, the count of these clustering assignment is then used a feature vector to represent an image.
Fig 3.
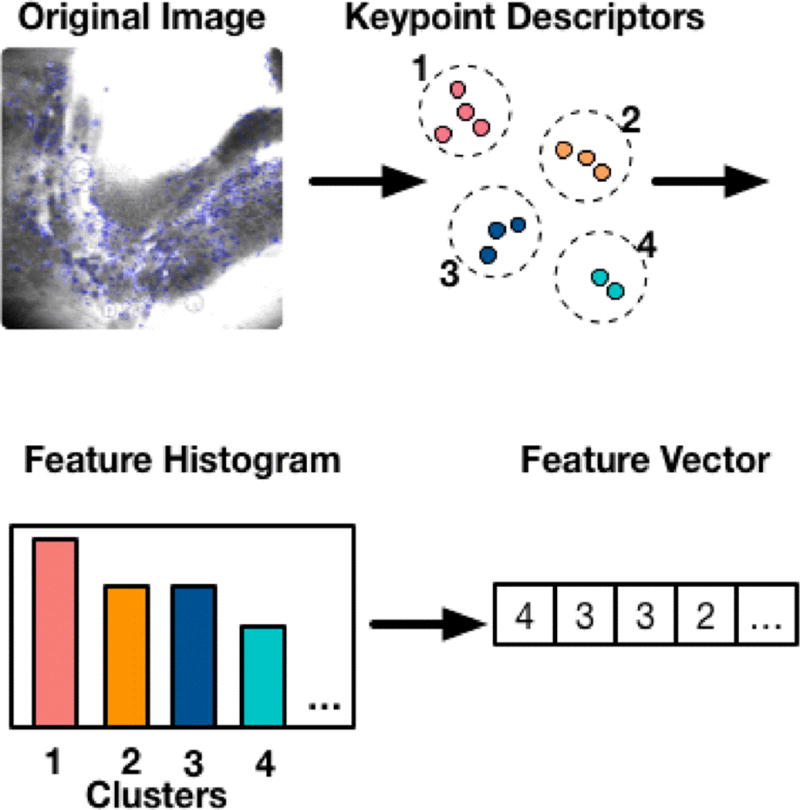
Feature extraction for a new image
A keypoint can be found based on the spatial information, color information and the image gradient changes in local regions. We examined 4 notable keypoint descriptors and summarized their key ideas as follows:
1) Color
Khan et al. [6] described a novel method to cluster colors based on their ability to classify images, using an information theoretic approach. Images are converted to color names and universal color descriptors are constructed to form the dictionary.
In eCLE data, although all images are collected in grayscale, they still contain a considerable amount of variations in the geometry, illuminant changes, so we still tested this feature in our experiments.
2) GIST
GIST is an abstract representation of “a scene that spontaneously activates memory representations of scene categories” [7]. Based on this idea, several perceptual dimensions are proposed to quantize the spatial structure of a scene, including “naturalness, openness, roughness, expansion, and ruggedness”.
3) Histograms of Oriented Gradients (HOG)
Histograms of oriented gradients (HOG) [8] focuses on aggregating the gradient information of each block over overlapping spatial blocks and constructs histograms over several detection windows. We choose two sizes of spatial blocks when constructing histograms, denoted as ‘HOG2×2′ and ‘HOG 3×3′ later.
4) Scale Invariant Feature Transform (SIFT)
Compared with most other algorithms, keypoints detected by SIFT [4] are not only rotation-invariant, but more importantly, scale-invariant. This property ensures that SIFT descriptor can robustly identify objects even in a messy condition or under partial occlusion.
C. Classification
After we construct the dictionary during the feature extraction step, every time we need to find a feature vector representation for a new image, we proceed as follows: 1) Build the keypoint descriptors; 2) Assign these descriptors to their closest visual words; 3) Construct a feature histogram counting the occurrences of each visual word in the image; 4) Use the number of counts as a feature vector representation.
Once we have the feature vector representation, we can apply any classification algorithms to classify the image. In our experiments, we use Support Vector Machine (SVM), Logistic Regression (LR), Random Forest (RF) and K-nearest neighbor classifiers (KNN).
IV RESULTS AND DISCUSSION
A. Experiment Setup and Evaluation Metrics
In the binary prediction task, to account for the imbalance of the high-risk and low-risk patients, besides accuracy (percentage of correctly classified samples), we also use F1-score (the harmonic mean of precision and recall), ROC-AUC (Area under Receiver-Operation-Characteristic Curve); and in the multi-class case, we use accuracy and Fl-score as ROC-AUC is not well-defined in this setting. Fl-score is computed by averaging Fl-scores in each class. We use stratified sampling to split the images into training and testing sets. All results are obtained by 5-fold cross-validation and plotted with error bars.
Feature extraction is performed by the MATLAB® Feature Extraction package provided by [9] and classification tasks are done in Python using scikit-learn [10].
B. Binary Prediction Result
The binary prediction performance is varied for different combinations of feature extraction methods and classifiers. For accuracy (Figure 4b), feature extractions based on color, HOG2×2, HOG3×3, and SIFT have comparable performance for all four different classifiers (though color based feature extraction performance is slightly underperformed in KNN classifier). GIST based feature extraction method has the worst accuracy for any classifier since it is more suitable in understanding scenes of images.
Fig 4.
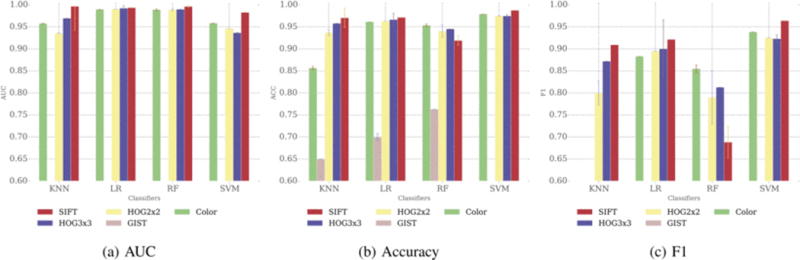
Binary prediction results
Based on Fl-score (Figure 4c), we can further confirm that GIST has the worst performance for this prediction task. On the contrary, HOG3×3 has a relatively robust performance for any of the four classifiers we investigated in this study. Also, SVM outperformed all the other three classifiers, while random forest has the least performance in terms of F1-score. The AUC is relatively stable among different feature extraction methods and classifiers, except for GIST (Figure 4a).
C. Multi-Class Prediction Result
For multi-class prediction, the performance of color and HOG3×3 based feature extraction methods are robust for different classifiers (Figure 5). However, SIFT achieves high accuracy and Fl-score only when combined with Logistic Regression and SVM, but has relatively poor performance when combined with KNN or Random Forest. GIST still has the worst performance among these four feature extraction methods.
Fig 5.
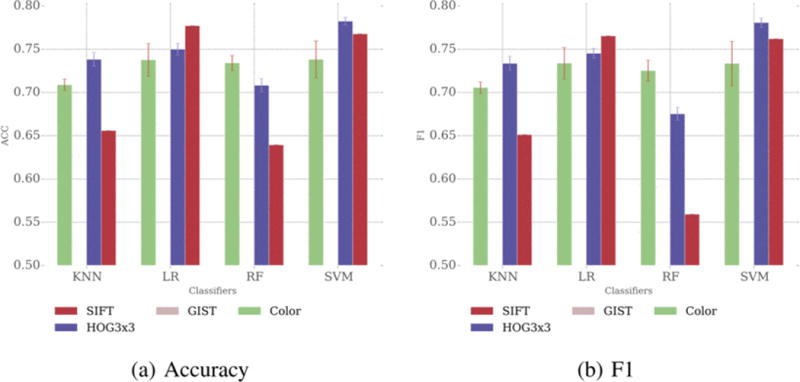
Multi-class prediction results
D. Discussion
Based on the evaluation of different classification, to achieve both high and robust performance for binary or multi-class classification, we recommend applying HOG3×3 for feature extraction, especially when coupled with Logistic Regression or SVM.
The advantage of our current method is that it is fast to compute and don’t need to specify many parameters. Also, it showed high performance in binary prediction. However, in multi-class prediction, the result is not as good as in binary prediction, and such performance suggests features extracted is not well suited for multi-class prediction.
V CONCLUSION
In this paper, we examined different feature extraction methods in the application of endomicroscopic image classification tasks. Extensive results show that Formula combined with SVM yields the best predictive performance. As for future work, it will be interesting to design better distance metrics to improve the multi-class prediction performance. Also, in this study we only use one modality of OE images for classification. In the future, we plan to integrate all modalities of OE images to provide a comprehensive evaluation of patients’ conditions.
Contributor Information
Sonal Kothari, Email: sonalkothari86@gmail.com, Dept. of Biomedical Engineering, Georgia Institute of Technology and Emory University, Atlanta, GA 30332, USA.
Hang Wu, Email: hangwu@gatech.edu, Dept. of Biomedical Engineering, Georgia Institute of Technology and Emory University, Atlanta, GA 30332, USA.
Li Tong, Email: ltong9@gatech.edu, Dept. of Biomedical Engineering, Georgia Institute of Technology and Emory University, Atlanta, GA 30332, USA.
Kevin E. Woods, Email: kevin.woods@emory.edu, Division of Digestive Diseases, Emory University School of Medicine.
May D. Wang, Dept. of Biomedical Engineering, Georgia Institute of Technology and Emory University, Atlanta, GA 30332, USA.
References
- 1.Evans JA, Early DS, Fukami N, Ben-Menachem T, Chandrasekhara V, Chathadi KV, Decker GA, Fanelli RD, Fisher DA, Foley KQ, et al. The role of endoscopy in barrett’s esophagus and other premalignant conditions of the esophagus. Gastrointestinal endoscopy. 2012;76(6):1087–1094. doi: 10.1016/j.gie.2012.08.004. [DOI] [PubMed] [Google Scholar]
- 2.Nixon M, Nixon MS, Aguado AS. Feature extraction and image processing for Computer Vision. Academic Press; 2012. [Google Scholar]
- 3.Li CQ, Zuo XL, Guo J, Zhang JY, Liu JW, Li YQ. A paralleled comparison between two sets of confocal laser endomicroscopy in gastrointestinal tract. Journal of digestive diseases. 2015 doi: 10.1111/1751-2980.12245. [DOI] [PubMed] [Google Scholar]
- 4.Lowe DG. Computer vision, 1999. The proceedings of the seventh IEEE international conference on. Vol. 2. Ieee; 1999. Object recognition from local scale-invariant features; pp. 1150–1157. [Google Scholar]
- 5.Fei-Fei L, Perona P. Computer Vision and Pattern Recognition, 2005. CVPR 2005. IEEE Computer Society Conference on. Vol. 2. IEEE; 2005. A bayesian hierarchical model for learning natural scene categories; pp. 524–531. [Google Scholar]
- 6.Khan R, Van de Weijer J, Shahbaz Khan F, Muselet D, Ducottet C, Barat C. Computer Vision and Pattern Recognition (CVPR), 2013 IEEE Conference on. IEEE; 2013. Discriminative color descriptors; pp. 2866–2873. [Google Scholar]
- 7.Oliva A, Torralba A. Modeling the shape of the scene: A holistic representation of the spatial envelope. International journal of computer vision. 2001;42(3):145–175. [Google Scholar]
- 8.Dalal N, Triggs B. Computer Vision and Pattern Recognition, 2005. CVPR 2005. IEEE Computer Society Conference on. Vol. 1. IEEE; 2005. Histograms of oriented gradients for human detection; pp. 886–893. [Google Scholar]
- 9.Khosla A, Xiao J, Torralba A, Oliva A. Memorability of image regions. Advances in Neural Information Processing Systems. 2012:305–313. [Google Scholar]
- 10.Pedregosa F, Varoquaux G, Gramfort A, Michel V, Thirion B, Grisel O, Blondel M, Prettenhofer P, Weiss R, Dubourg V, Vanderplas J, Passos A, Cournapeau D, Brucher M, Perrot M, Duchesnay E. Scikit-learn: Machine learning in Python. Journal of Machine Learning Research. 2011;12:2825–2830. [Google Scholar]