Abstract
Next-generation sequencing (NGS) has brought human genomic research to an unprecedented era. RNA-Seq is a branch of NGS that can be used to quantify gene expression and depends on accurate annotation of the human genome (i.e., the definition of genes and all of their variants or isoforms). Multiple annotations of the human genome exist with varying complexity. However, it is not clear how the choice of genome annotation influences RNA-Seq gene expression quantification. We assess the effect of different genome annotations in terms of (1) mapping quality, (2) quantification variation, (3) quantification accuracy (i.e., by comparing to qRT-PCR data), and (4) the concordance of detecting differentially expressed genes. External validation with qRT-PCR suggests that more complex genome annotations result in higher quantification variation.
I. INTRODUCTION
Next-generation sequencing (NGS) technology provides an alternative approach for understanding and interpreting a broad range of genomic mechanisms, e.g., miRNA regulatory networks, single nucleotide polymorphisms (SNPs), and differential gene expression [1–3]. Compared to first generation sequencing technology (i.e., Sanger sequencing), NGS dramatically increases sequencing throughput. Thus, it is capable of sequencing an entire human genome. Transcriptome sequencing, or RNA-Seq, is an important application of NGS technology. RNA-Seq can quantify gene expression by sequencing RNA molecules and mapping the sequences back to the human genome [4]. However, this process depends on the knowledge of genome annotation. Due to the multiple existing human genome annotations, we examine the effect of genome annotation choice on quantification of gene expression using RNA-Seq.
Genome annotation is an important component of RNA-Seq. It is the process of assigning genomic features (i.e., exons, introns, coding sequences, and regulatory elements) to the human genome at specific coordinates. Thus, the quantification of a gene or an isoform (i.e., a splice variant of a gene) is only possible if the components of that gene or isoform have been annotated. Much effort has been devoted to human genome annotation, including the RefSeq database and the Vertebrate Genome Annotation (Vega) database [5, 6]. The methodologies and data sources of each genome annotation project are different. Thus, the detail and depth of genomic features varies greatly among the existing annotations. Some annotations tend to be more conservative, i.e., they include a smaller number of isoforms for each gene. Other annotations may be more exploratory or predictive in nature and, thus, may contain more complex gene models with more isoforms.
There are currently no guidelines for selecting a human genome annotation for RNA-Seq. Thus, it is not clear how the choice of annotation affects downstream RNA-Seq data analysis. We aim to provide some insights into the effect of human genome annotation on RNA-Seq quantification.
II. HUMAN GENOME ANNOTATIONS
We use six human genome annotations from various databases and projects, including the AceView project led by the National Center for Biotechnology Information (NCBI) [7], the Ensembl project led by EMBL-EBI and Wellcome Trust Sanger Institute (WTSI) [8], the H-InvDB database based on the Genome Information Integration Project [9], the RefSeq database built by NCBI [5], the UCSC Known Genes database constructed by the University of California Santa Cruz (UCSC) [10], and the Vega database built by WTSI [6]. Table I summarizes key features of each annotation.
TABLE I.
Comparison of Human Genome Annotations
| Genome Annotations |
|||||||
|---|---|---|---|---|---|---|---|
|
AceView Genes |
Ensembl Genes |
H-InvDB Genes |
Vega Genes |
UCSC Known Genes |
RefSeq Genes |
||
| Version | 2010 | 67 | 8.0 | 48 | - | - | |
| Last Updated Date | Nov. 12, 2011 | May 1, 2012 | Apr. 20, 2012 | June 26, 2012 | Dec. 21, 2011 | July 23, 2012 | |
| Number of Genes | 72,376 | 53,970 | 43,893 | 44,880 | 30,355 | 24,016 | |
| Number of Isoforms | 259,426 | 183,011 | 236,861 | 158,835 | 77,080 | 41,250 | |
| Number of Exons | 1,400,140 | 1,187,758 | 1,665,651 | 957,195 | 699,043 | 402,372 | |
| Average Number of Isoforms per Gene | 3.58 | 3.39 | 5.40 | 3.54 | 2.54 | 1.72 | |
| Maximum Number of Isoforms per Gene | 119 | 82 | 885 | 77 | 129 | 77 | |
| Annotation Base Coverage (%) | Gene | 52.93 | 49.78 | 45.09 | 48.36 | 43.09 | 39.39 |
| Exon | 5.71 | 3.66 | 3.72 | 3.54 | 2.71 | 2.27 | |
| CDS | 1.72 | 1.14 | 1.43 | 1.05 | 1.13 | 1.08 | |
The annotation base coverage is the total length of the genomic feature (gene, exon, or CDS) over the length of the human genome
The Last Updated Date was noted in July, 2012
CDS: coding sequence
In Table I, we order the human genome annotations from left to right by decreasing complexity. We define the complexity using two rules: (1) the number of genes in the annotation is directly proportional to complexity and (2) the average number of isoforms per gene is directly proportional to complexity. We hypothesize that an annotation with more genes and more isoforms per gene will increase the difficulty of RNA-Seq mapping and quantification because of overlapping annotation and ambiguous mapping issues. In this study, we focus on gene level analysis. Thus, rule (1) (i.e., the number of genes in the annotation is directly proportional to complexity) should have higher priority than rule (2) (i.e., the average number of isoforms per gene is directly proportional to complexity). In the case that the number of genes is similar, e.g., H-InvDB annotation and Vega annotation, we apply rule (2) to determine which annotation has higher complexity.
The data source and methodology of each human genome annotation is briefly described below:
AceView Genes – The data sources of the AceView genes are mRNA sequences from GenBank and RefSeq as well as single pass cDNA sequences from dbEST and Trace. It summarizes all sequences into a comprehensive evidence-based gene annotation. It is a fully automatic process and uses heuristics to closely reproduce manual curation.
Ensembl Genes – The data sources of the Ensembl genes include (1) the automated Ensembl gene annotation pipeline “genebuild”, (2) manually curated genes from the Havana Group at the WTSI, and (3) consensus coding sequences (CCDS). The final Ensembl genes result from clustering and merging these data sources.
H-InvDB Genes – H-InvDB genes are collected from six high-throughput sequencing projects [11]. It uses BLAST to map full-length cDNAs to the human genome, and then annotates the genome based on clustering results. It assigns a standardized functional annotation to each H-Inv transcript by manual curation.
Vega Genes – The Vega database focuses on the browsing and maintenance of manually annotated data, including manually curated sequences from Havana, RIKEN, JGI, and Washington University.
UCSC Known Genes – The data sources of the UCSC known genes include protein data from Swiss-Prot/TrEMBL (UniProt) and the associated mRNA data from GenBank. It uses a fully automated process to annotate the genome.
RefSeq Genes – The data sources of the RefSeq genes include all sequences submitted to the International Nucleotide Sequence Database Collaboration (INSDC), which consists of DDBJ, ENA, and GenBank. It combines an automatic genome annotation pipeline and a significant level of manual curation.
III. METHODS
The goal of this paper is to evaluate the effect of human genome annotation complexity on RNA-Seq quantification. The typical analysis pipeline for this type of study includes mapping, quantification, normalization, and differentially expressed gene detection. At each analysis step, we propose several evaluation criteria to demonstrate the performance difference induced by annotation complexities.
A. NGS Data
We use a publicly available RNA-Seq dataset from the Sequence Read Archive (SRA) repository (accession number: SRP008482). The SRP008482 dataset studies the effect of thrombin treatment on endothelial function. It uses RNA-Seq technology to profile the transcriptome in human pulmonary microvascular endothelial cells (HMVEC-L) that were treated with thrombin for six hours [12]. It includes five samples, three of which are thrombin-treated technical replicates while the other two are controls. The Illumina HiScanSQ system was used for sequencing. Each technical replicate contains around 50 million read pairs with read lengths of 2×101 base pairs.
The original study validated the differential expression of three genes using qRT-PCR technology. These genes include CELF1, FANCD2, and TRAF1. Fold-changes of these genes from qRT-PCR provide an external ground truth for validating and evaluating RNA-Seq results.
B. Sequence Read Mapping
We use Omicsoft Sequence Aligner (OSA) to map sequence reads to the human genome guided by different genome annotations. OSA is a spliced mapping tool (Figure 1) that can handle reads that cross exon splice junctions when directly mapping to the genome. It is faster than other spliced mapping tools and has been shown to have higher sensitivity and fewer false positives compared to TopHat, SoapSplice, and RUM pipelines [13].
Figure 1.
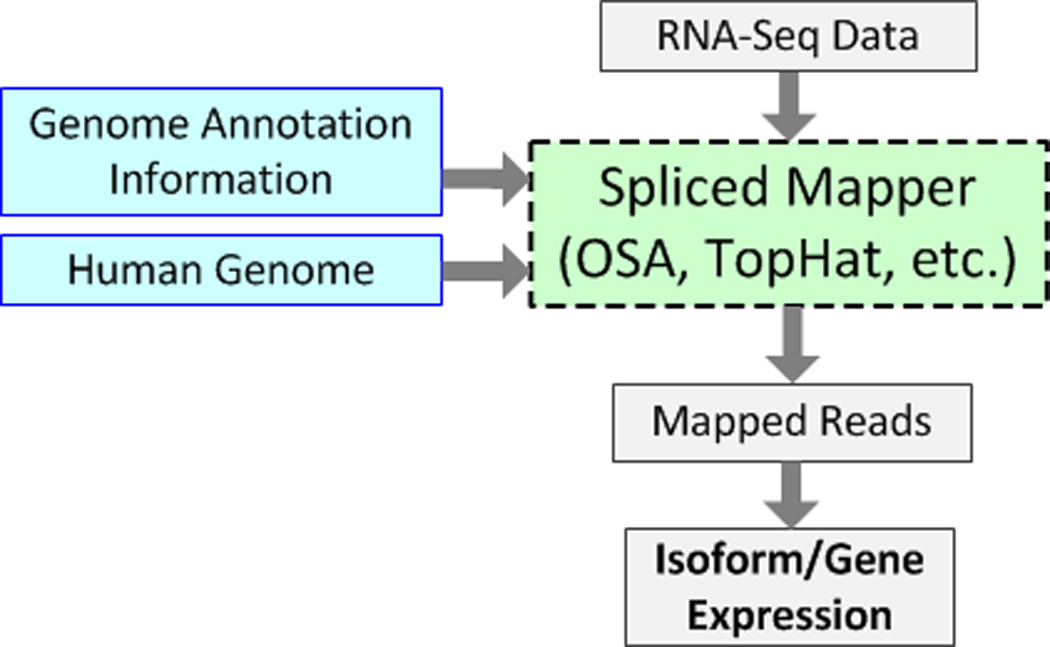
The workflow of typical RNA-Seq spliced mapping pipelines. The genome annotation defines the exon splice junction information for spliced mappers. Various sets of exon junction information from different genome annotations affect the output of spliced mappers.
We use UCSC hg19 as the reference human genome for OSA. The contigs of the UCSC hg19 include 24 main chromosomes, 20 unplaced contigs (belonging to known chromosomes but unknown location), and 39 un-localized contigs (belonging to unknown chromosome).
The first evaluation criterion for the mapping step is categorization of read mapping results, including uniquely paired reads, non-uniquely paired reads, uniquely mapped singletons, non-uniquely mapped singletons, and unmapped reads. The second evaluation criterion is a count of the number of reads mapped to the annotated and unannotated genomic regions.
C. Expression Quantification and Normalization
OSA provides functionality for quantifying and normalizing gene and isoform expression. It estimates expression using the Transcripts Per Million (TPM) normalization method [14]. We also use HTSeq to quantify gene expression as a count of the number of reads mapping to each gene. In this study, the gene count from HTSeq is only applied to differential expression calling. All other evaluation criteria are based on TPM expression.
After normalization, we use the stability of TPM expression between technical replicates as an evaluation criterion. Using gene identifiers provided by the HUGO Gene Nomenclature Committee (HGNC), we identify 13,082 common genes across the six genome annotations. For each genome annotation, we remove genes from the common gene set that have zero expression for all replicates and calculate the average coefficient of variation (CV). We then assess the relation between average CV and annotation complexity. We also apply this technique to the set of uncommon genes (i.e., genes that are not common among all six annotations) and to all gene isoforms.
The second evaluation criterion is a count of the percentage of genes or isoforms that have zero expression across all replicates. Because some annotations contain significantly more genes or isoforms compared to other annotations, we use this criterion to demonstrate the usefulness of the additional information for RNA-Seq gene expression quantification studies.
D. Differentially Expressed Gene Detection
We use the edgeR package to detect differentially expressed genes. edgeR fits read count data to a negative binomial distribution, and then uses a log-likelihood ratio test or Fisher’s exact test to determine the significance of each gene in terms of differential expression [15]. We select the top 20 differentially expressed genes for each annotation, and observe the concordance of these genes. We closely examine the functionalities of genes that only occur once across the six annotations.
Three genes were selected for qRT-PCR fold-change in the original study [12]. We use the qRT-PCR result as a ground truth to estimate the “error” (i.e., the average absolute deviation from the qRT-PCR fold-change) of RNA-Seq-based fold-change for each of the six annotations. We then examine the relationship between genome annotation complexity and differential expression quantification error.
IV. RESULTS AND DISCUSSIONS
A. Complexity of Six Genome Annotations
In Table I, we summarize key features of each human genome annotation. We use these features to define the complexity of various genome annotations. The annotation base coverage generally follows our definition of genome complexity (i.e., AceView is the most complex because it has the most genes and RefSeq is the least complex because it has the least genes). The only exception is the H-InvDB genome annotation, which has a similar number of genes as the Vega annotation, but has almost 1.5 times the number of isoforms. Moreover, there is one gene (HIX0006010; HGNC: EEF1A1) that has 885 isoforms in the annotation. Thus, the annotation base coverage of H-InvDB deviates from the expected trend.
B. Effect of Annotation Complexity on Mapping
We propose two evaluation criteria for the mapping step. First, we examine the distribution of reads in terms of mapping categories. As shown in Figure 2, the RefSeq annotation has the highest percentage of uniquely paired reads, followed by the UCSC annotation. The trend in this measurement matches our definition of annotation complexity. More complex annotations increase the difficulty for read mapping because of the need to deal with more complex exon splice junctions and more overlapping genes.
Figure 2.
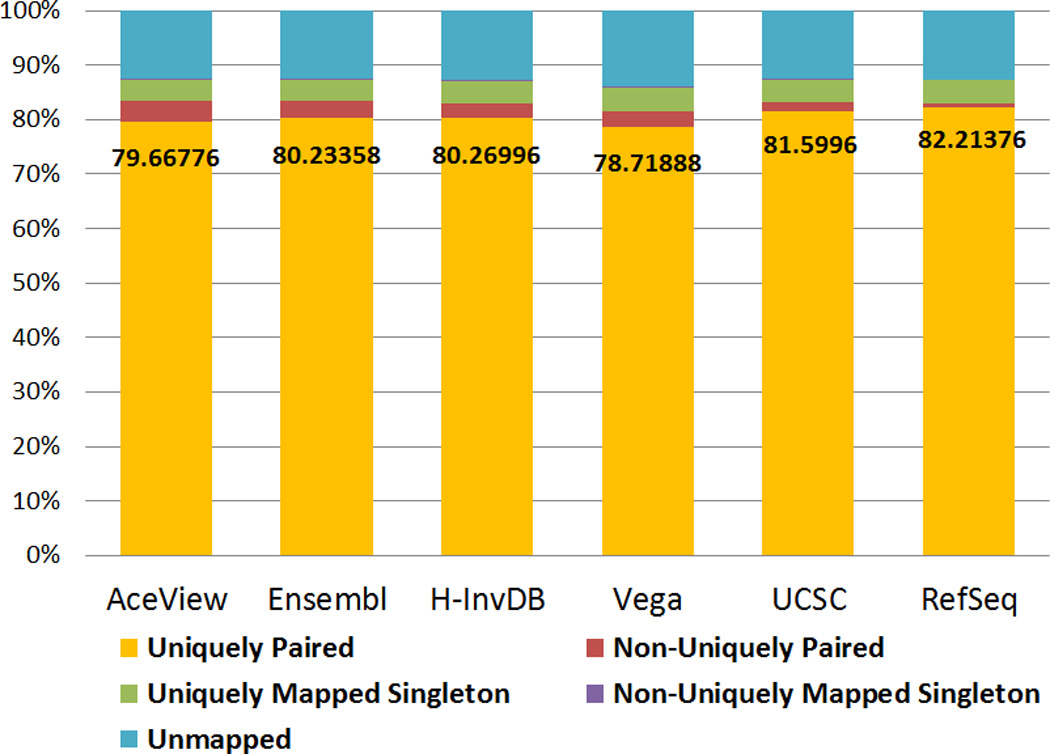
The distribution of five paired-end read mapping categories as shown in the legend. These results demonstrate that differences among mapping percentages to each category are related to annotation complexity. RefSeq, the least complex annotation results in the smallest percentage of non-uniquely paired read mappings.
Second, we examine the number of reads mapping to the annotated and unannotated genomic regions. More reads mapping to the annotated regions imply that the annotation is more comprehensive in terms of annotating functional elements. From Figure 3, we can see that the AceView annotation has the highest percentage of reads that fall into annotated regions, while Vega, UCSC, and RefSeq have a lower percentage. This observation is concordant with our definition of annotation complexity.
Figure 3.
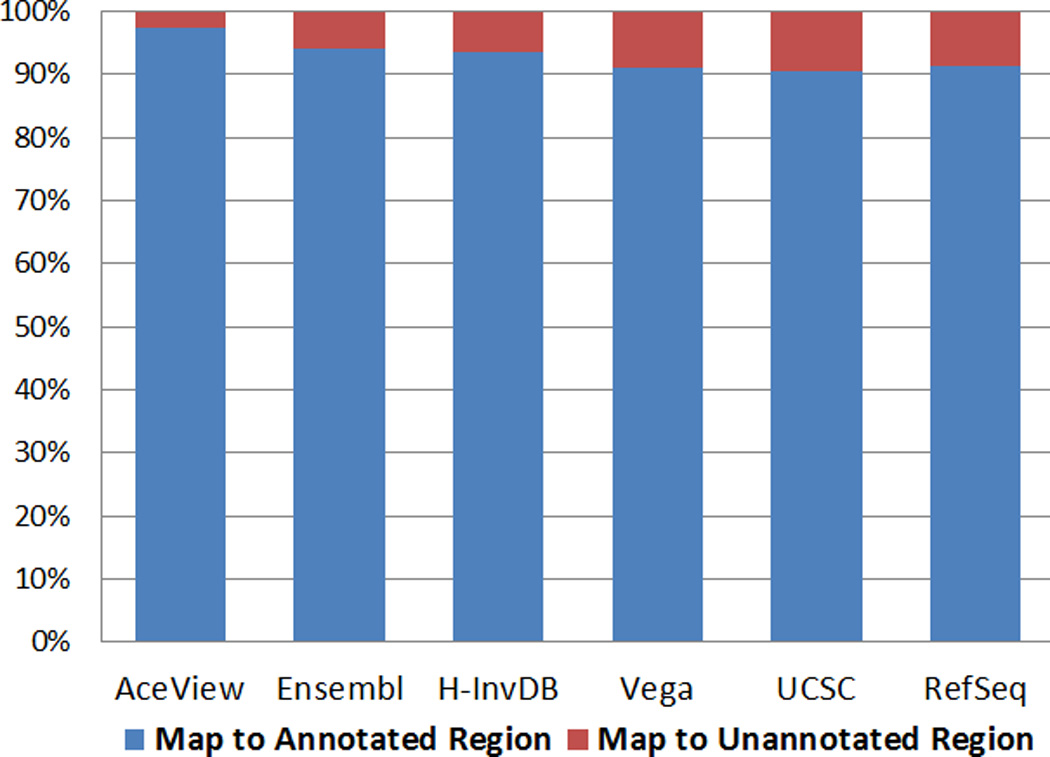
The percentage of reads mapped to the annotated and unannotated genomic regions. AceView, the most complex annotation, is also the most comprehensive. Thus, a higher percentage of reads map to annotated regions.
C. Effect of Annotation Complexity on Quantification
We propose two evaluation criteria for the quantification step. First, we assess the effect of annotation complexity on the stability of expression estimation in gene and isoform levels. Figure 4 shows the average CV across targeted genes or isoforms. We focus on three groups of targets: 13,082 common genes across six annotations, uncommon genes of each annotation track that are not included in common genes, and all isoforms of each annotation. The average CV will be low if the variance of expression estimation between replicates is small. For common genes, the RefSeq annotation has the lowest average CV while the AceView annotation has the largest average CV. However, the difference is not large. For uncommon genes and isoforms, the variation between annotations becomes larger because more annotation-specific features are being considered. The trend of average CV follows annotation complexity. More complex annotations are more difficult for quantification since more ambiguous mapping occurs. The AceView annotation is the most complex genome annotation; thus, it has the highest average CV. RefSeq is the simplest genome annotation and has the lowest average CV. Note that the Vega annotation does not follow the trend in Figure 4. A possible reason for this is that the Vega annotation also includes functional small RNAs. Since the data we are analyzing was subject to poly-A selection, only mRNA is retained in the final RNA samples. Thus, most of the functional small RNAs tend to have zero expression or low expression. We refer to these zero expressing features as absent genomic features. The inclusion of additional low expressing genomic features in the Vega annotation results in larger CV. The Ensembl annotation also includes small RNAs; however, due to the complexity of the Ensembl mRNA annotation, the effect of additional small RNA features on the CV is not as prominent.
Figure 4.
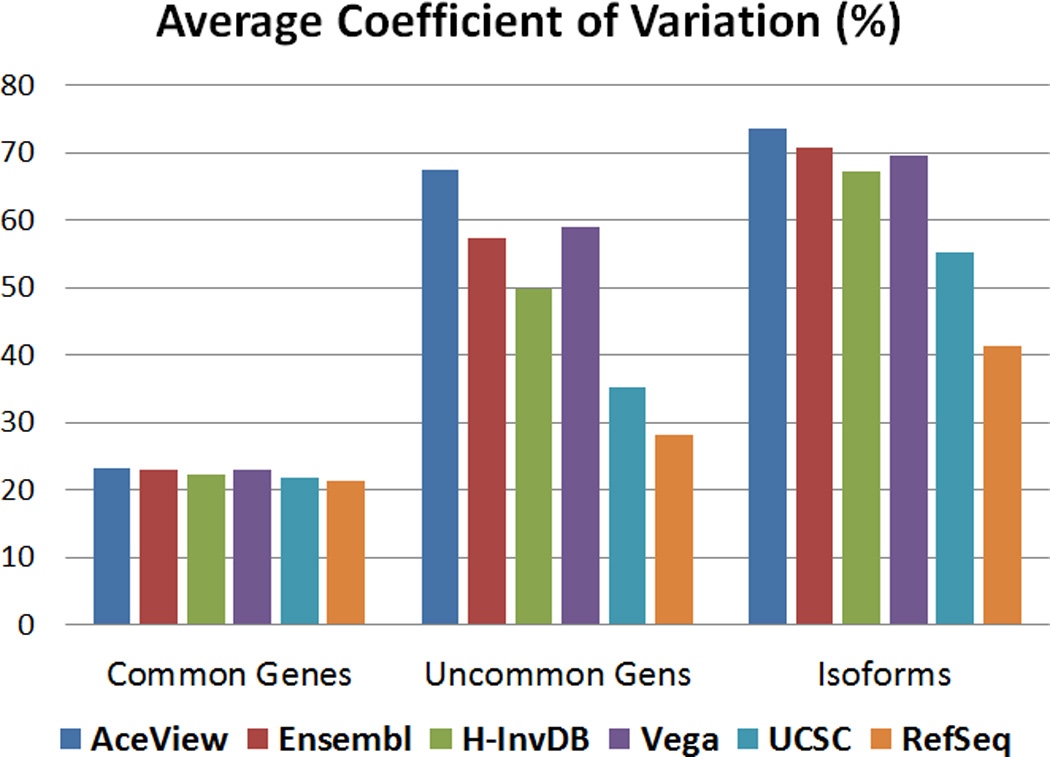
The average CV for 13,082 common genes, uncommon genes of each annotation, and all isoforms of each annotation based on TPM expression from OSA. This result demonstrates that average expression CV is related to genome annotation complexity. Annotations are ordered from left to right by decreasing complexity.
Figure 5 shows the results of the second evaluation criterion for the quantification step. The number of absent genomic features depends on the annotation. We define absent as a genomic feature that has zero expression across all technical replicates. For common genes, all six annotations have a similar number of absent genes. For all genes, uncommon genes, and all isoforms, the trend among the six annotations looks similar. In most cases, the AceView annotation has a higher percentage of absence than the H-InvDB annotation, followed by the UCSC annotation and the RefSeq annotation. For the Ensembl and Vega annotations, as we described earlier, many functional small RNAs are included in the annotations. Because of the poly-A selection process, most of these are identified as absent, which correspondingly increases the percentage of genes or isoforms being identified as absent.
Figure 5.
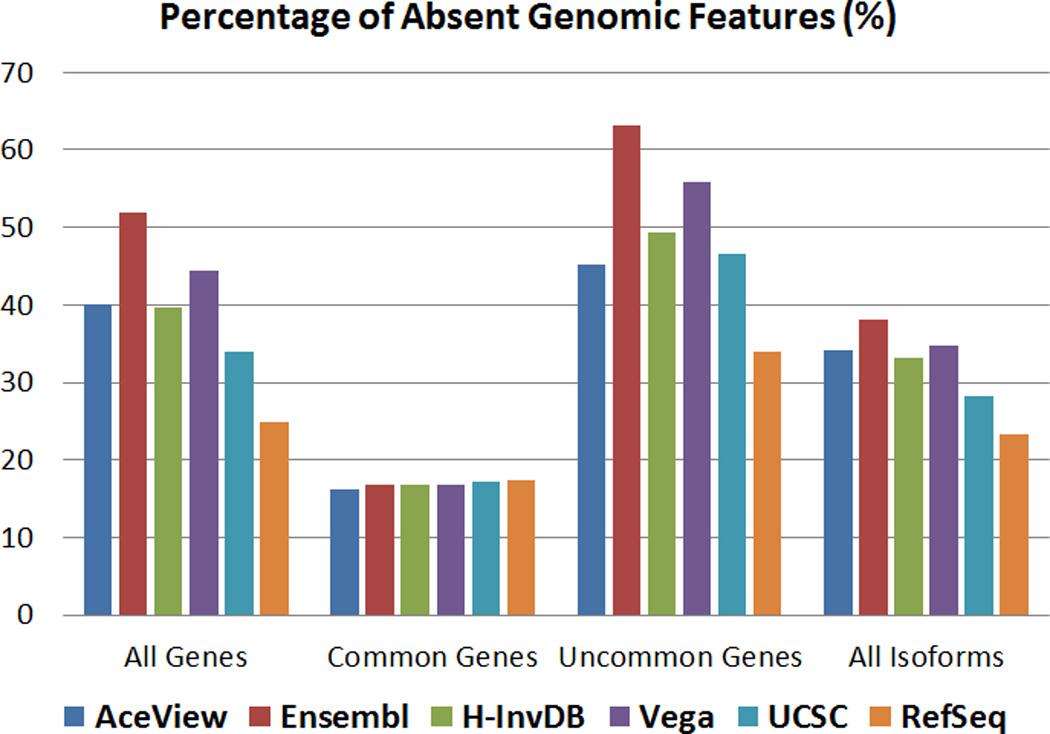
Percentage of absent genomic features for each genome annotation.
D. Effect of Annotation Complexity on DE Calling
We identified the top 20 differentially expressed genes for each annotation as shown in Table II. As expected, most of these genes appear at least twice among the six annotations. There are also some unique annotation-specific genes identified as differentially expressed, e.g., yumomo and romomo in the AceView annotation, HIX0011725 in the H-InvDB annotation and AC159540.1 in the Vega annotation (marked in bold in Table II), which are all predictive genes (i.e., the existence of these genes has been predicted, but their full function is unknown). Even though we cannot determine the function of these genes, more complex annotations still provide an opportunity to discover novel genomic features. This is the advantage of using more complex and comprehensive genome annotations.
TABLE II.
To 20 Differentially Expressed Genes Using Six Human Genome Annotations
| AceView | Ensembl | H-InvDB | Vega | UCSC | RefSeq |
|---|---|---|---|---|---|
| TRAF1 | TRAF1 | RN5-8S1 | AC159540.1 | RN5-8S1 | LOC100506123 |
| CX3CL1 | CENPE | RN5-8S1 | TRAF1 | LOC100506123 | ZNF117 |
| yumomo | XIST | TRAF1 | CENPE | TRAF1 | TRAF1 |
| romomo | VPS13A | CX3CL1 | XLST | ZNF117 | CENPE |
| SELEandSELL | AKAP9 | XIST | CX3CL1 | CENPE | VPS13A |
| ADAMTS4 | ASPM | NEAT1 | VPS13A | CX3CL1 | XIST |
| VCAM1 | ANKRD12 | CENPE | MALAT1 | VPS13A | AKAP9 |
| MALAT1 | NKTR | SELE | AKAP9 | XIST | MALAT1 |
| XIST | ATRX | HIX0011725 | ASPM | MALAT1 | CX3CL1 |
| RND1 | EEA1 | MALAT1 | SELE | AKAP9 | ASPM |
| AKAP9 | RECTOR | VPS13A | ANKRD12 | ASPM | CHD9 |
| ASPM | NEAT1 | ADAMTS4 | NKTR | SELE | ATRX |
| NEAT1 | ADAMTS4 | AKAP9 | ATRX | NKTR | EEA1 |
| EEA1 | VCAM1 | VCAM1 | EEA1 | CHD9 | RICTOR |
| NKTR | C12orf35 | ASPM | ADAM1S4 | ATRX | NKTR |
| ATRX | GOLGA8A | RND1 | VCAM1 | EEA1 | ANKRD12 |
| C12orf35 | CCDC88A | KCNN2 | NEAT1 | VCAM1 | SELE |
| CCDC88A | CHD9 | NKTR | RICTOR | ADAMTS4 | Cl2orf35 |
| GOLGA8A | GOLGA8B | ATRX | C12orf35 | NEAT1 | GOLGA8A |
| ICAM1 | RND1 | CHD9 | GOLGA8A | RECTOR | CCDC88A |
We also examine the fold-change of three genes that were validated by qRT-PCR technology. From Table III, we can observe that the RefSeq annotation has the lowest average absolute deviation from the qRT-PCR quantification of fold-change. In contrast, more complex annotations such as AceView, Ensembl, and H-InvDB have relatively higher average absolute deviations. This result suggests that complex genome annotations increase the difficulty of quantifying gene expression. Higher variations in gene expression propagate to fold-change quantification and other differential expression test-statistics.
TABLE III.
Fold-Change between Thrombin-Treated Samples and Control Samples
| Gene | qR T-PCR | AceView | Ensembl | H-InvDB | Vega | UCSC | RefSeq |
|---|---|---|---|---|---|---|---|
| TRAF1 | 7.27 | 8.16 | 8.14 | 8.19 | 7.99 | 7.6 | 7.58 |
| FANCD2 | −2.07 | −1.72 | −1.85 | −1.61 | −1.81 | −1.79 | −1.79 |
| CELF1 | −1.15 | −1.10 | −1.07 | −1.15 | −1.07 | −1.18 | −1.21 |
| Average Absolute Deviation from qRT-PCR | 0.43 | 0.39 | 0.46 | 0.35 | 0.23 | 0.22 | |
Positive number represents up-regulated fold-change and negative number represents down-regulated fold-change.
V. CONCLUSION
We have investigated the relationship between human genome annotation complexity and several RNA-Seq performance criteria using the OSA alignment tool. For RNA-Seq mapping, more complex annotations result in a lower percentage of uniquely paired mappings; however, more complex annotations also result in the highest percentage of reads mapping to annotated regions. For RNA-Seq quantification, complex annotations are problematic, resulting in higher variation of expression across technical replicates. Moreover, complex annotations result in a higher percent of absent genes or isoforms since these annotations include more predictive and hypothetical annotations. For differentially expressed gene detection, the concordance between annotations is high. More complex annotations can identify other potential biomarkers that cannot be identified using simpler annotations. However, using qRT-PCR as an external validation, we observed that complex annotations result in larger fold-change deviations, which indicate higher variance in the quantification step. In summary, the choice of human genome annotation for RNA-Seq should depend on the application. Results of this limited study (i.e., using one alignment tool and one dataset) suggest that less complex genome annotations lead to more stable quantification of gene expression and differential expression. However, more complex and comprehensive annotations may provide opportunities for novel discoveries. Further analysis is required (i.e., using other spliced mapping tools and other datasets) to provide stronger evidence that links genome annotation complexity to RNA-Seq quantification accuracy.
Contributor Information
Po-Yen Wu, Department of Electrical and Computer Engineering, Georgia Tech, Atlanta, GA, U.S.A, pwu33@gatech.edu.
John H. Phan, The Wallace H. Coulter Department of Biomedical Engineering, Georgia Tech and Emory University, Atlanta, GA, U.S.A, jhphan@gatech.edu
May D. Wang, The Wallace H. Coulter Department of Biomedical Engineering, Georgia Tech and Emory University, Atlanta, GA, U.S.A, maywang@bme.gatech.edu
REFERENCES
- 1.Morozova O, Marra MA. Applications of next-generation sequencing technologies in functional genomics. Genomics. 2008 Nov;92:255–264. doi: 10.1016/j.ygeno.2008.07.001. [DOI] [PubMed] [Google Scholar]
- 2.Brockman W, Alvarez P, et al. Quality scores and SNP detection in sequencing-by-synthesis systems. Genome Res. 2008 May;18:763–770. doi: 10.1101/gr.070227.107. [DOI] [PMC free article] [PubMed] [Google Scholar]
- 3.Mortazavi A, Williams BA, et al. Mapping and quantifying mammalian transcriptomes by RNA-Seq. Nat Methods. 2008 Jul;5:621–628. doi: 10.1038/nmeth.1226. [DOI] [PubMed] [Google Scholar]
- 4.Wang Z, Gerstein M, Snyder M. RNA-Seq: a revolutionary tool for transcriptomics. Nature Reviews Genetics. 2009 Jan;10:57–63. doi: 10.1038/nrg2484. [DOI] [PMC free article] [PubMed] [Google Scholar]
- 5.Pruitt KD, Tatusova T, Brown GR, Maglott DR. NCBI Reference Sequences (RefSeq): current status, new features and genome annotation policy. Nucleic Acids Res. 2012 Jan;40:D130–D135. doi: 10.1093/nar/gkr1079. [DOI] [PMC free article] [PubMed] [Google Scholar]
- 6.Wilming LG, Gilbert JG, et al. The vertebrate genome annotation (Vega) database. Nucleic Acids Res. 2008 Jan;36:D753–D760. doi: 10.1093/nar/gkm987. [DOI] [PMC free article] [PubMed] [Google Scholar]
- 7.Thierry-Mieg D, Thierry-Mieg J. AceView: a comprehensive cDNA-supported gene and transcripts annotation. Genome Biol. 2006;7(Suppl 1):S12, 1–14. doi: 10.1186/gb-2006-7-s1-s12. [DOI] [PMC free article] [PubMed] [Google Scholar]
- 8.Flicek P, Amode MR, et al. Ensembl 2012. Nucleic Acids Res. 2012 Jan;40:D84–D90. doi: 10.1093/nar/gkr991. [DOI] [PMC free article] [PubMed] [Google Scholar]
- 9.Yamasaki C, Murakami K, et al. The H-Invitational Database (H-InvDB), a comprehensive annotation resource for human genes and transcripts. Nucleic Acids Res. 2008 Jan;36:D793–D799. doi: 10.1093/nar/gkm999. [DOI] [PMC free article] [PubMed] [Google Scholar]
- 10.Hsu F, Kent WJ, et al. The UCSC Known Genes. Bioinformatics. 2006 May 1;22:1036–1046. doi: 10.1093/bioinformatics/btl048. [DOI] [PubMed] [Google Scholar]
- 11.Imanishi T, Itoh T, et al. Integrative annotation of 21,037 human genes validated by full-length cDNA clones. PLoS Biol. 2004 Jun;2:e162. doi: 10.1371/journal.pbio.0020162. [DOI] [PMC free article] [PubMed] [Google Scholar]
- 12.Zhang LQ, Cheranova D, et al. RNA-seq reveals novel transcriptome of genes and their isoforms in human pulmonary microvascular endothelial cells treated with thrombin. PLoS One. 2012;7:e31229. doi: 10.1371/journal.pone.0031229. [DOI] [PMC free article] [PubMed] [Google Scholar]
- 13.Hu J, Ge H, Newman M, Liu K. OSA: a fast and accurate alignment tool for RNA-Seq. Bioinformatics. 2012 Jul 15;28:1933–1934. doi: 10.1093/bioinformatics/bts294. [DOI] [PubMed] [Google Scholar]
- 14.Li B, Dewey CN. RSEM: accurate transcript quantification from RNA-Seq data with or without a reference genome. Bmc Bioinformatics. 2011 Aug 4;12 doi: 10.1186/1471-2105-12-323. [DOI] [PMC free article] [PubMed] [Google Scholar]
- 15.Robinson MD, McCarthy DJ, Smyth GK. edgeR: a Bioconductor package for differential expression analysis of digital gene expression data. Bioinformatics. 2010 Jan;26:139–140. doi: 10.1093/bioinformatics/btp616. [DOI] [PMC free article] [PubMed] [Google Scholar]


