

Abstract
During the past decade, there has been a marked increase in the number of reported cases involving counterfeit medicines in developing and developed countries. Particularly, artesunate-based antimalarial drugs have been targeted, because of their high demand and cost. Counterfeit antimalarials can cause death and can contribute to the growing problem of drug resistance, particularly in southeast Asia. In this study, the complementarity of two-dimensional diffusion-ordered 1H nuclear magnetic resonance spectroscopy (2D DOSY 1H NMR) with direct analysis in real-time mass spectrometry (DART MS) and desorption electrospray ionization mass spectrometry (DESI MS) was assessed for pharmaceutical forensic purposes. Fourteen different artesunate tablets, representative of what can be purchased from informal sources in southeast Asia, were investigated with these techniques. The expected active pharmaceutical ingredient was detected in only five formulations via both nuclear magnetic resonance (NMR) and mass spectrometry (MS) methods. Common organic excipients such as sucrose, lactose, stearate, dextrin, and starch were also detected. The graphical representation of DOSY 1H NMR results proved very useful for establishing similarities among groups of samples, enabling counterfeit drug “chemotyping”. In addition to bulk- and surface-average analyses, spatially resolved information on the surface composition of counterfeit and genuine antimalarial formulations was obtained using DESI MS that was performed in the imaging mode, which enabled one to visualize the homogeneity of both genuine and counterfeit drug samples. Overall, this study suggests that 2D DOSY 1H NMR, combined with ambient MS, comprises a powerful suite of instrumental analysis methodologies for the integral characterization of counterfeit antimalarials.
Drug counterfeiting is a well-recognized public health problem. It accounts for an estimated $35 billion/yr financial impact to the pharmaceutical industry alone, without considering the enormous disease and financial burden placed on patients and healthcare systems.(1, 2) Counterfeit drugs are drugs that are sold illegally, where the identity of the source is deliberately and fraudulently mislabeled in a way that it is suggested to be the genuine product. Counterfeit drugs may include those without the expected active pharmaceutical ingredient (API), with an insufficient quantity of the API, with wrong APIs, or with fake packaging very closely resembling the genuine product.(3) The World Health Organization (WHO) estimates that ~10% of all pharmaceutical products sold worldwide are counterfeit, but these figures should only be regarded as estimates.(4, 5) It is believed that counterfeits probably comprise a large portion of those drugs sold over the Internet from pharmacies that conceal their physical address.(6)
Artesunate, which was first developed in the People’s Republic of China, is an antimalarial derivative of artemisinin and is considered vital for the treatment of this disease.(7) It is widely used as part of mono- or combination therapies in southeast (SE) Asia and increasingly in Africa for the treatment of Plasmodium falciparum malaria. Its relatively high cost and demand has made it a preferred target for counterfeiters.(8) Counterfeit artesunate was first found in Cambodia in 1998 when relatively inexpensive tablets were discovered.(9) A recent stratified random survey of the proportion of poor-quality oral artesunate sold at medicine outlets in the Lao People’s Democratic Republic (Lao PDR) showed that 88% of that medicine was counterfeit.(10) In 2008, a multidisciplinary forensic international team tracked the origin of a subclass of counterfeit artesunate tablets using various complementary analytical techniques, which included liquid chromatography, ambient mass spectrometry (MS), X-ray diffraction spectroscopy, stable-isotope-ratio MS, gas chromatography, and palynological analysis.(11) Despite the success of this investigation, the ever-growing sophistication of counterfeit drugs prompts for the constant development of increasingly more in-depth pharmaceutical analysis approaches for investigating their composition and origin. Progress in fieldable instrumentation development, such as portable Raman spectroscopy is also playing a growing role in detecting counterfeit medicine.(12)
In this study, two-dimensional diffusion-ordered 1H nuclear magnetic resonance spectroscopy (2D DOSY 1H NMR),(13) accurate mass direct analysis in real time mass spectrometry (DART MS),(14) and desorption electrospray ionization mass spectrometry (DESI MS),(15) in both conventional and imaging(16–18) modes, are compared and combined for the forensic investigation of counterfeit drugs. DART and DESI are surface ionization techniques for ambient MS(19) with already-demonstrated potential for pharmaceutical forensics.(20–23) Both allow high-throughput pharmaceutical analysis with no sample preparation. Two-dimensional DOSY 1H NMR has been shown to provide a highly comprehensive chemical fingerprint of genuine pharmaceutical formulations;(24, 25) however, to our knowledge, this is the first application of both DOSY 1H NMR and imaging DESI MS in the investigation of the growing problem of fake antimalarial drugs. The multipronged approach illustrated here is likely to produce comprehensive chemical information for determining the similitude between different classes of fake pharmaceuticals, which is a critical step in guiding law enforcement and public health agencies toward their most probable origin.
Experimental Section
Artesunate Antimalarial Samples
Fourteen solid tablet formulations were analyzed by both DOSY and ambient MS methods (formulations 1–14). Formulations 4, 6, 7, 9, and 13 were classified as genuine products, based on packaging inspection and were manufactured by Pharbaco (Hanoi, Vietnam), Mekophar (Ho Chi Minh City, Vietnam), Yangon Pharma Industry (Rangoon, Burma), Mepha (Basel, Switzerland), and Guilin Pharmaceutical Co., Ltd. (Guangxi, China), respectively. The remaining samples (which were classified as counterfeit by packaging analysis) were collected on the Thai/Burma border, Burma, Cambodia and the Lao People’s Democratic Republic (Laos PDR); these samples mimicked genuine antimalarial tablets that were manufactured by Guilin Pharmaceutical Co., Ltd. A blister pack containing 12 tablets was collected for each suspect sample and one tablet from each blister pack was available for these studies. One half of each tablet was processed for NMR experiments, while the second half was reserved for DART and DESI MS analyses. Two additional formulations (15 and 16) were reserved for DESI MS imaging analysis.
The type numbers assigned to each formulation refer to the different packaging types of fake artesunate, which were falsely labeled as being manufactured by Guilin Pharmaceutical Co., Ltd.(26) The formulations investigated were labeled as follows: 1 (collection code S1/2005, type 9); 2 (collection code S2/2005, type 4); 3 (collection code S3/2005, type 4); 4 (collection code S4/2005, Pharbaco, Hanoi, Vietnam); 5 (collection code S5/2005, type 10); 6 (collection code S8/2005, Mekophar, Ho Chi Minh City, Vietnam); 7 (collection code S9/2005, Yangon Pharma Industry); 8 (collection code S10/2005, type 9); 9 (collection code S23/2005, Plasmotrim, Mepha, Switzerland); 10 (collection code Laos 05/03, type 11); 11 (collection code Burma 2/14029, fake, type unknown because the hologram was cut off); 12 (collection code Laos 2/12070, type 4); 13 (collection code Cambodia 2/13008, genuine, Guilin Pharmaceutical Co. Ltd., oval scored white tablets); 14 (collection code Laos 05/15, type 8), 15 (genuine, Mekophar, round-shaped scored white tablets), 16 (collection code Lao 12060, type 8). Both counterfeit and genuine sample were indicated on their blister packs to contain 50 mg of artesunate per tablet.
1H and 2D DOSY 1H NMR Analysis
For NMR analyses, a quarter of each tablet was powdered and dissolved in 2 mL of dimethylsulfoxide (DMSO)-d6 (Eurisotop, Gif-sur-Yvette, France), with magnetic stirring for 15 min and sonication for 5 min. The suspension was centrifuged (10 min, 6000 rpm) and the supernatant was poured into a 5-mm NMR tube for analysis. NMR experiments were performed at a temperature of 298 K on a Bruker Avance 500 spectrometer (Bruker BioSpin, Wissembourg, France) that was equipped with a triple-resonance 5-mm 1H cryoprobe (TCI) with z-axis gradient. Typical acquisition parameters for the 1H NMR experiments were as follows: acquisition time, 1.02 s; spectral width, 8000 Hz; 16 K data points; relaxation delay, 1 s; and 32 scans. The chemical shifts (δ) were referenced to an internal trimethylsilylpropane sulfonic acid (TMPS) standard, giving a singlet for the trimethylsilyl moiety (at 0 ppm) and three multiplets for the propyl chain (at 0.51, 1.58, and 2.40 ppm). In each spectrum obtained, the peaks at 3.17 and 2.53 ppm correspond to the residual signals of HOD and DMSO, respectively.
For DOSY 1H NMR, stimulated echo bipolar gradient pulse experiments including an eddy-current delay of 10 ms and spoiler gradients of −7.92 and −6.09 G/cm with a pulse length of 0.6 s were used. The gradient recovery delay was 3 ms after each gradient, and the relaxation delay was 2 s. Pulse field gradient lengths varied over a range of 2–2.4 ms and the diffusion delay varied over a range of 100–170 ms. Sequence parameters were adapted to decrease the intensity of aromatic NMR signals from the API by at least a factor of 50 at 95% of the full gradient strength. When no APIs were detected, signals from excipients were used for sequence optimization. Forty gradient increments (with 32 scans for each experiment) were recorded with the gradient intensity linearly sampled varied over a range of 5%–95%. The gradient system was calibrated to 46.25 G/cm at maximum intensity prior to all experiments. All data were processed using Gifa 5.2 via the inverse Laplace Transform method, together with the Maximum Entropy algorithm (MaxEnt). The processing parameters were 2048 points along the Laplace spectrum diffusion axis and 20 000 MaxEnt iterations. The inverse Laplace Transform was computed only on the columns that presented a signal 32 times greater than the noise level of the experiment.
DOSY 1H NMR relies on the decrease in diffusion coefficients (D) with increasing molecular mass as a means to virtually separate components in a solution mixture. In this sense, DOSY 1H NMR spectra were presented with chemical shifts on the horizontal axis and diffusion coefficients expressed in units of μm2/s on the vertical axis. Thus, all NMR peaks generated from the same component line up at the same diffusion coefficient. Generally, measured diffusion coefficients were rather low, because of the solvent used. Indeed, the self-diffusion coefficient of H2O in DMSO in our experiments at 25 °C is ~1100 μm2/s, while pure water has a self-diffusion coefficient of ~2300 μm2/s at the same temperature.(27) Identification of all APIs and excipients was performed by comparing δ values to an in-house 2D DOSY library, or by spiking the samples with standards. Two-dimensional gCOSY, gHSQC, and gHMBC 1H NMR experiments were performed to assign the NMR signals of artemisinin and artesunate (see Table S-1 in the Supporting Information), and these were determined to be consistent with previous literature data on other artemisinin derivatives.(28) The NMR notebook software(29) was used in all cases for spectral analysis.
DART MS Analysis
DART analysis is performed by generating a heated stream of metastable helium or nitrogen, which reacts with atmospheric water, creating a gas-phase ionic reagent mixture with composition (H2O)nH+ (where n = 1–14). The sample is placed directly within the region in space where these reactants are generated, causing simultaneous desorption and ionization via a mechanism that involves gas-phase proton transfer.(20) A DART-type ion source interfaced to a time-of-flight mass spectrometer (JEOL AccuTOF, Peabody, MA) was used in all cases. This ion source has been described in detail elsewhere.(30) All experiments were performed in positive-ion mode. Ion-optics settings were as follows: inlet orifice voltage, 30 V; ring electrode voltage, 5 V; orifice-2, 5 V; ion guide bias voltage, 29 V; and ion guide peak voltage, 300 V. The detector voltage was set to 2650 V. The DART ion source settings were as follows: flow rate of high-purity helium (ultrahigh purity (99.999%), Airgas, Atlanta, GA), 7.2 L/min; heater temperature, 200 °C; corona discharge needle voltage, 1000 V; counter electrode voltage, 200 V; and fixed distance between ion source and MS orifice, 3 cm. Mass calibration for accurate mass determinations was performed before and after each sample by placing a 1.5 mm outer diameter (o.d.) × 90 mm long glass capillary dipped in polyethylene glycol (PEG 600, Sigma Aldrich, St. Louis, MO) in front of the DART source for 30 s, and obtaining a reference mass spectrum. Sample tablets were held in the ionization region with stainless steel tweezers and data were acquired for 30 s. Mass spectral data processing, calibration, and background subtraction were performed using the built-in mass spectrometer software (MassCenter, v.1.3). DART MS data were exported in ASCII format as JEOL-DX centroided spectra and searched against an in-house library of potential [M + H]+ ions and related fragment ion species, derived from 238 common drugs found in the List of Essential Drugs that was supplied by the World Health Organization (WHO).(31) A match was considered positive if the difference between the experimental and theoretical accurate masses was <5 mmu.
DESI MS Analysis
DESI makes use of a pneumatically assisted electrospray jet that is directed toward the sample. This jet creates a microscopic liquid thin film onto the sample surface where rapid–solid liquid extraction occurs. Secondary droplets are scattered from this film by the incoming liquid jet and transported into the differentially pumped stages of the mass spectrometer, yielding analyte ions, following mechanisms similar to those observed in electrospray ionization (ESI).(32) A home-built DESI ion source was used for all experiments.(33) The source was comprised of a joystick and software-controlled motorized microscope x–y stage (Prior Scientific, Rockland, MA) controlled by LabVIEW (National Instruments Corporation, Austin, TX). This stage was used for sample positioning, with respect to the DESI electrospray plume. The stage assembly was mounted on a heavy-duty lab jack (Thorlabs, Newton, NJ) for manual adjustment of the z-axis. The sprayer (inner solvent capillary: inner diameter (i.d.) = 49 μm, o.d. = 151 μm; outer gas sheath capillary: i.d. = 252 μm, o.d. = 347 μm) that was emitting charged microdroplets was fitted with a high-precision rotation mount (Thorlabs, Newton, NJ) for adjustment of the spray impact angle, with respect to the sample surface. The electrospray emitter assembly, including the rotation mount, was attached to a three-axis positioner (Thorlabs, Newton, NJ) for manual adjustment of the emitter position in the x–y–z coordinates, with respect to the inlet capillary of the mass spectrometer. Samples were held in place using two aluminum sample holders (110 mm × 10 mm × 3 mm) that were mounted on the sample plate of the microscope stage. DESI was performed by spraying a solution of 99.9% MeOH/0.1% HCOOH onto the sample surface at a flow rate of 5 μL/min. High-performance liquid chromatography (HPLC)-grade methanol (Fisher, Hampton, NH) was used in all cases. The nebulizer gas pressure was set at 110 psi. The DESI sprayer emitter was mounted ~2 mm above the sampling surface at an angle of 55°. The sampling capillary was positioned to grace the sampling surface and was ~2 mm from the DESI spray impact region. All experiments were performed using an LCQ DECA XP+ quadrupole ion-trap mass spectrometer (QiT MS, Thermo Finnigan, San Jose, CA). The spray solution was electrically charged to ±3 kV, depending on the ionization mode used. Data were collected in full scan mode in the m/z = 100–1000 range via the Xcalibur software (Version 2.0, Thermo Finnigan). The ion transfer capillary was held at 300 °C, and the instrument was set to collect spectra in the automatic gain mode for a maximum ion trap injection time of 200 ms at 2 microscans per spectrum. Data were acquired for a total acquisition time of 15 s per spectrum.
DESI MS analyses on two formulations (15 and 16) were performed in imaging mode, enabling one to map the composition of the sample into a two-dimensional molecular image. Formulation 15 was comprised of a flat surface with somewhat-tilted edges and was imaged directly. Formulation 16 had a more convex shape; therefore, it was sanded with superfine P400 sandpaper (Norton Abrasive, Worcester, MA) and the particulates released during sanding were blown off using N2 from a gas cylinder. No sample contamination was evident due to sanding. In DESI imaging experiments, mass spectra were acquired in profile mode with the automatic gain control (AGC) turned off. The ion injection time was set at 40 ms. Imaging data were acquired using a “looped”-stage scanning mode, where a 15 mm × 10 mm sample area was investigated by (1) forward and (2) reverse scan lines overlapping in the x-direction (15 mm) perpendicular to the inlet capillary of the mass spectrometer, followed by (3) a step displacement in the y-dimension, away from the spectrometer. Overlapping forward and reverse scan segments were utilized to avoid any image artifacts that might be caused by sample scanning directionality; but, only data from the forward scan segments were used to construct the images. The stage scan speed in both dimensions was set to 80 μm/s, with a step size of 200 μm in the y-dimension. Using these settings, a lateral resolution of 75 μm was achieved, as determined by scanning a calibrated test image that was printed on glossy paper. The flow rate used for imaging experiments was 3 μL/min. The recorded individual mass spectral scans were finally processed and assembled into an image using an in-house written MATLAB program (Version R2008a, MathWorks, Inc., Natick, MA).
Results and Discussion
Figure 1A shows the 2D DOSY 1H NMR spectrum of formulation 2, which had a unique chemical signature and, therefore, was placed in a unique sample class (Class A; see Table 1). Three compounds were identified in this formulation. The API was artemisinin (D ≈ 620 μm2/s), which is the naturally occurring precursor for many semisynthetic antimalarial drugs, including artesunate, artemether, dihydroartemisinin, and artelinic acid.(34) Artemisinin is a sesquiterpene lactone with an endoperoxide bridge linkage. It has a low bioavailability, because of its poor water solubility, and therefore is less effective in antimalarial treatments.(35) In addition to artemisinin, two other excipients were found in this tablet. One is dextrin, which shows two characteristic doublets at 6.71 and 6.39 ppm, a triplet at 4.93 ppm and two series of broad signals between 5.2–5.8 and 3.8–3.0 ppm in 1H NMR. The second excipient is a stearate-based lubricant that leads to four signals located at 0.88 ppm (triplet), 1.26 ppm (broad singlet), 1.50 ppm (quintuplet), and 2.14 ppm (triplet). Results from the complementary analysis of this sample by both DART and DESI MS are illustrated in Figures 1B and 1C. The peaks at m/z 283.2 and 565.3 in the DART spectrum (see Figure 1B) correspond to the protonated artemisinin monomer and dimer, respectively. Peaks at m/z 300.2 and 582.7 are also observed, corresponding to the respective ammonium adducts. Analysis of this sample via DESI MS in positive-ion mode showed peaks at m/z 305.1, 587.3, and 869.4 (see Figure 1C) that correspond to sodiated adducts of monomeric, dimeric, and trimeric artemisinin. The excipients detected by DOSY 1H NMR were not detected by either DART or DESI MS. Although stearate is not expected to ionize well in positive-ion mode, dextrin, which could be ionized, was also not observed. This phenomenon could stem from the higher ionization efficiency of artemisinin, which suppresses ionization of other compounds in the sample. Surprisingly, these species were not observed in the negative ion mode, probably because of similar effects. The correct API, artesunic acid, was not observed in this sample via any of the assayed methods.
Figure 1.
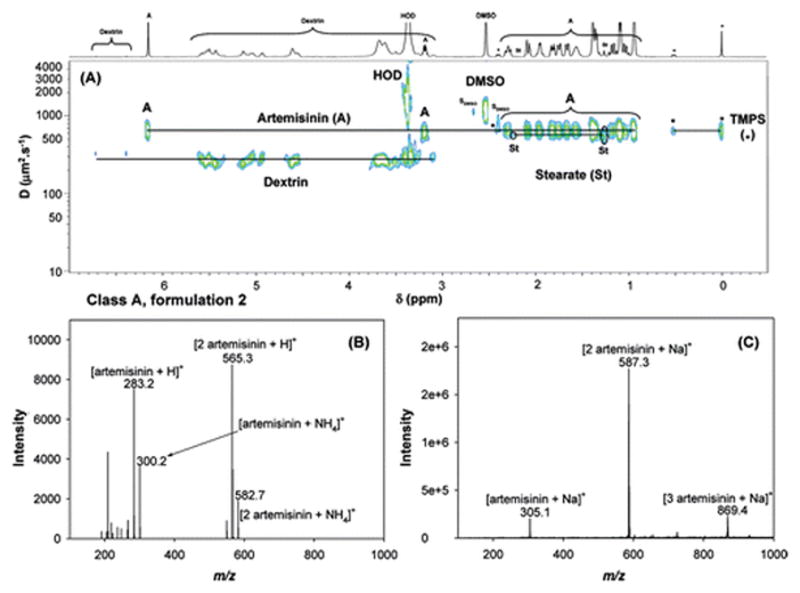
Analyses of formulation 2 via (A) 2D DOSY 1H NMR in DMSO-d6, with TMPS as internal reference standard (where SDMSO represents DMSO satellite signals), (B) DART MS in positive-ion mode, and (C) DESI MS in positive-ion mode.
Table 1.
Active Pharmaceutical Ingredients and Excipients Detected by 2D DOSY 1H NMR. and DESI/DART MS. in 14 Different Antimalarial Formulations
| compound | technique | Formulations | |||||||
|---|---|---|---|---|---|---|---|---|---|
| Class A | Class B | Class C | Class D | Class E | Class F | Class G | |||
| 2 | 11 | 10,14 | 12 | 1,8 | 3,5 | 4,6,7,9 | 13 | ||
| packaging typea | 4 | N/Ab | 8,11 | 4 | 9 | 4,10 | genuine | genuine | |
| artesunic acid | DOSY NMR | + | + | ||||||
| DESI/DART MS | +/+ | +/− | |||||||
| artemisinin | DOSY NMR | + | |||||||
| DESI/DART MS | +/+ | ||||||||
| acetaminophen | DOSY NMR | + | |||||||
| DESI/DART MS | +/+ | ||||||||
| dipyrone | DOSY NMR | + | |||||||
| DESI/DART MS | +/+ | ||||||||
| stearate | DOSY NMR | + | + | + | + | + | + | + | + |
| DESI/DART MS | |||||||||
| sucrose | DOSY NMR | + | + | ||||||
| DESI/DART MS | +/− | +/− | |||||||
| lactose | DOSY NMR | + | + | ||||||
| DESI/DART MS | +/− | +/− | |||||||
| dextrin | DOSY NMR | + | + | + | |||||
| DESI/DART MS | |||||||||
| starch | DOSY NMR | + | + | + | + | + | + | ||
| DESI/DART MS | |||||||||
Data taken from ref 11.
The packaging type of class B formulations could not be assigned, because the hologram had been cut off.
2D DOSY 1H NMR analysis (see Figure 2A) of formulation 11 revealed a significantly different chemical signature; this formulation was assigned to Class B (see Table 1). Classification of a packing type for this sample was precluded by an incomplete hologram. The tablet contained no identifiable API, but a stearate-based lubricant, along with tablet diluents starch (five broad signals at 5.53, 5.43, 5.13, 4.61, and 3.61 ppm) and sucrose (two doublets at 5.08 and 4.52 ppm, a triplet at 3.91 ppm and multiplets at 5.21, 4.82, 4.42 and between 3.8 and 3.1 ppm) were determined to be present. Minor unknown signals (a singlet at 6.50 ppm and four doublets at 6.08, 7.62, 8.19, and 8.36 ppm) were also detected. DART MS analysis of sample 11 did not yield any identifiable peaks (data not shown). However, analysis of this sample by DESI MS in positive-ion mode showed two prominent peaks, at m/z 365.3 and 707.2, identified as the sodiated sucrose monomer and dimer, respectively (see Figure 2B). The peak identities were determined by comparing the DESI MS and MS2 spectra of this sample against sucrose (Figure 2C) and lactose (Figure 2D) standards. Because these disaccharides are structural isomers, only DESI MS2, but not DESI MS, can distinguish between them. Scheme 1 summarizes the various cleavages and fragment ions observed by DESI MS2 of the precursor ions with m/z 365.3. For both sodiated sugars, cleavages at the glycosidic bonds occur with the competitive retention of a Na+ ion on each monosaccharide unit, with or without an additional loss of a water molecule to generate [monosaccharide + Na]+ and [monosaccharide−H2O + Na]+ ions at m/z 203.2 and 185.1, respectively. For sodiated lactose, additional fragment ions that correspond to the loss of a water molecule or two formaldehyde molecules from the precursor ion are observed, generating diagnostic signals at m/z 347.2 and m/z 305.2 to distinguish between sucrose and lactose. Therefore, the detection of sucrose and no APIs in this sample by DESI MS was consistent with DOSY NMR results.
Figure 2.
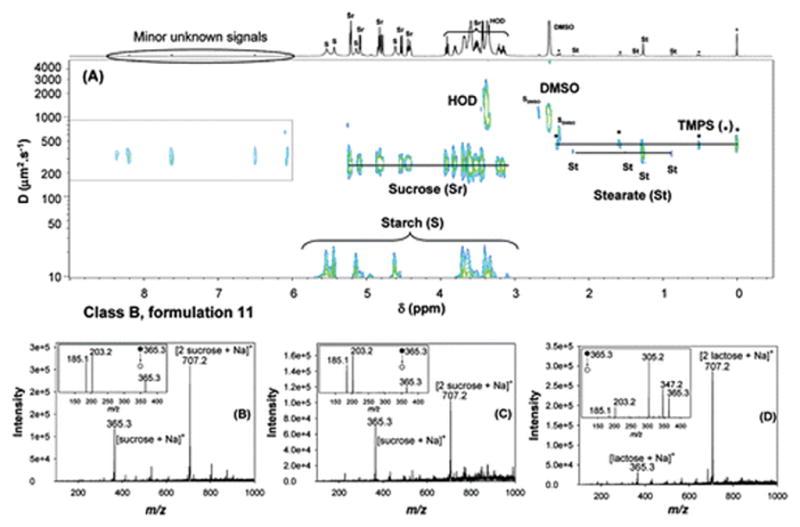
Analyses of formulation 11 using (A) 2D DOSY 1H NMR in DMSO-d6, with TMPS as internal reference standard (SDMSO represents DMSO satellite signals); and (B) DESI MS in positive-ion mode. (C) DESI spectrum, in positive-ion mode, of a sucrose standard (10 μL, 1 mg/mL), (D) DESI spectrum, in positive-ion mode, of a lactose standard (10 μL, 1 mg/mL). Standards were deposited onto polytetrafluoroethane (PTFE) and analyzed after air drying. The insets in panels (B), (C), and (D) represent the corresponding DESI MS2 spectra generated from the ion at m/z 365.3.
Scheme 1.
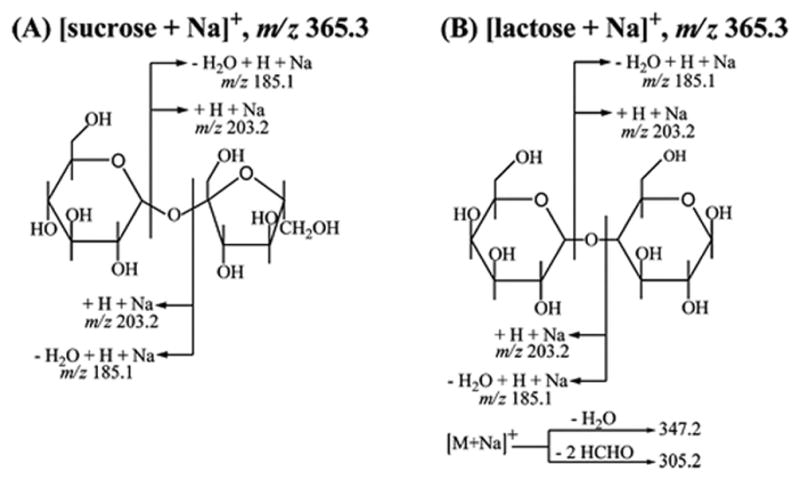
Fragment Ions Observed for the Isomeric Species: (A) [Sucrose + Na]+ and (B) [Lactose + Na]+ Generated from the Reagentless DESI MS2 Analysis of Sucrose and Lactose Standards (10 μL, 1 mg/mL) Respectively, Deposited on PTFE and Analyzed after Solvent Evaporation
Samples 10 and 14 showed similar spectral features and constituted Class C (see Table 1), with packaging types 11 and 8 (poor-quality stickers similar in physical appearance attached). The 2D DOSY 1H NMR spectrum of formulation 10 is shown in Figure S-1A in the Supporting Information. The DOSY spectrum shows peaks corresponding to a stearate-based lubricant, starch as a tablet diluent, and lactose, which gave several signals from its hydroxyl or anomeric protons (e.g., doublets at 6.35, 5.12, 4.81, 4.55, 4.20 ppm, triplet at 4.92 ppm) and several multiplets between 3.8 and 3.1 ppm for other protons. DART MS analysis of the same tablet did not yield any identifiable peaks. Analysis of sample 10 by DESI MS in positive-ion mode showed peaks at m/z 365.3 and 707.2, which suggested the presence of a disaccharide, as previously observed, and was confirmed by comparison of the DESI MS2 spectra against a lactose standard. Analysis of this sample by DESI MS in negative-ion mode showed an intense peak at m/z 387.1, which was identified as the anionic complex species [lactose + HCOO]− (see Figure S-1B in the Supporting Information). This assignment was verified via DESI MS2 analysis of this adduct, which predominantly generated the ion at m/z 341.1, which corresponded to the [lactose−H]− species, produced by the neutral loss of formic acid (see Figure S-1C in the Supporting Information). Further fragmentation of the m/z 341.1 ion by DESI MS3 gave a unique mass spectral fingerprint with a predominant ion at m/z 161.1, which corresponded to cleavage of the glycosidic bond with concomitant elimination of a water molecule from each monomer unit to give the [monomer−H2O−H]− species (see inset in Figure S-1C in the Supporting Information). The detection of lactose in sample 10 was consistent with the 2D DOSY 1H NMR results. Similar analysis of sample 11 by DESI MS3, which was shown previously to contain sucrose, gave an ion at m/z 179.1 as the predominant peak in the spectrum (see inset in Figure S-1D in the Supporting Information). This fragment ion was identified as the species [monomer−H]−, which was generated from cleavage of the glycosidic bond but with no concomitant elimination of a water molecule. No API was identified in these samples using DOSY or ambient MS methods.
Sample 12, with its unique 2D DOSY 1H NMR chemical signature, was labeled as a Class D formulation, and as type 4 by packaging analysis (see Table 1; spectral data not shown). Typical signals of stearate lubricant and two tablet diluents (dextrin and starch) were identified by NMR. Analysis of this sample by both DART and DESI MS did not lead to identification of any chemical species. Therefore, the ambient MS results were consistent with DOSY results, in the sense that no API was found (data not shown).
Samples 1 and 8 were assigned to Class E, and both were assigned to have packaging type 9(11) (see Table 1). The 2D DOSY 1H NMR spectra indicated that the API in those formulations was acetaminophen (paracetamol) (D ≈ 590 μm2/s), which is a widely used analgesic and antipyretic agent whose 1H NMR chemical shifts are reported in Table S-1 in the Supporting Information. Along with acetaminophen, two excipients were detected: stearate and dextrin (see Figure S-2A in the Supporting Information). DART analysis of sample 1 showed a peak at m/z 152.1, which was identified as protonated acetaminophen (see Figure S-2B in the Supporting Information). Analysis of this sample via DESI MS showed peaks at m/z 174.1 and 325.1 (see Figure S-2C in the Supporting Information), which corresponded to the sodiated acetaminophen monomer and dimer, respectively. Therefore, the detection of acetaminophen in this sample by ambient MS was consistent with the results obtained by 2D DOSY 1H NMR. The correct API, artesunic acid, was not detected in this sample, by any method.
Both samples 3 and 5 were assigned to Class F (see Table 1), with packaging types 4 and 10, respectively, which bear similarly good copies of the genuine Guilin Pharmaceutical Co., Ltd., hologram.(11) Class F contained a different “wrong” API, metamizole sodium (dipyrone, D ≈ 415 μm2/s), along with stearate and low-molecular-weight (low-MW) starch-related excipients(36) (see Figure S3-A in the Supporting Information). Dipyrone is a nonsteroidal anti-inflammatory drug that is used as a powerful painkiller and antipyretic; it has been associated with adverse effects, such as agranulocytosis, and is banned in some countries.(11) Administration of this drug might temporarily mitigate some symptoms of malaria, but it does not cure the disease. DART MS analysis of samples 3 or 5 did not yield any identifiable peaks, possibly because of excessive fragmentation (data not shown). However, analysis by DESI MS in positive-ion mode showed two peaks at m/z 356.2 and 689.0, which corresponded to [Na-dipyronate + Na]+ and [2 Na-dipyronate + Na]+, respectively (see Figure S-3B in the Supporting Information). These assignments were further verified by negative-mode DESI MS analysis, where peaks at m/z 310.1, 643.2, and 976.2 were observed that corresponded to the species [dipyrone−H]−, [Na-dipyrone + dipyrone-H]−, and [2Na-dipyrone + dipyrone-H]−, respectively (see Figure S-3C in the Supporting Information).
Samples 4, 6, 7, 9, and 13 were all classified as genuine products, based on packaging inspection, and they originated from different manufacturers. They were grouped as Class G samples (see Table 1). 2D DOSY 1H NMR and ambient MS analyses revealed two different subclasses within the Class G samples: samples 4, 6, 7 and 9 were in one subclass, and sample 13, manufactured by Guilin Pharmaceutical Co., Ltd., was part of a different subclass. The expected API, artesunic acid, was observed in all the formulations, with stearate and starch as excipients (see Figure 3). The major difference between the samples in each subclass related to the identity of the disaccharides present (lactose versus sucrose). Lactose was identified in the first subclass (4, 6, 7, 9) and sucrose was identified in the second subclass. Results for formulation 4 are a good example of the virtual separation of components, based on their diffusion coefficients, observed in a 2D DOSY 1H NMR experiment (see Figure 3A). Differences between self-diffusion coefficients of low-MW components (such as HOD (D ≈ 1100 μm2/s) and DMSO (D ≈ 910 μm2/s), intermediate-MW components (e.g., artesunate (D ≈ 300 μm2/s) and lactose (D ≈ 250 μm2/s), and starch with a very low diffusion coefficient typical of polysaccharides (D < 10 μm2/s) are readily observed. The DART MS spectrum of formulation 4 showed peaks at m/z 267.2 and 533.4, which were assigned to [artesunic acid−C4H6O4 + H]+ and [2(artesunic acid−C4H6O4) + H]+, respectively. Figure 3C shows the complementary DESI MS spectrum of this same sample. The predominant peaks in the spectrum (m/z 407.2, 673.2, and 791.2) were assigned to [artesunic acid + Na]+, [2 artesunic acid−C4H6O4 + Na]+, and [2 artesunic acid + Na]+, respectively. Also in this spectrum, the peaks at m/z 365.3 and 707.2 were identified as [lactose + Na]+ and [2 lactose + Na]+, after comparison against DESI MS2 analyses of the standards.
Figure 3.
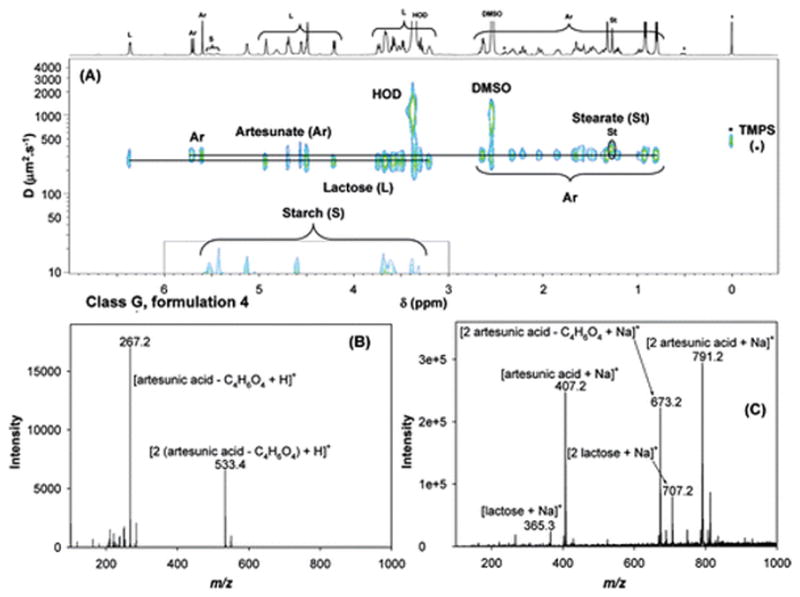
Analyses of formulation 4 by (A) 2D DOSY 1H NMR in DMSO-d6, with TMPS as internal reference standard, (B) DART MS in positive-ion mode, and (C) DESI MS in positive-ion mode.
In addition to bulk sample examination using NMR and MS, examination of the spatial distribution of tablet constituents, such as APIs and excipients, is also important to detect minor impurities. Spectral imaging techniques such as thermal imaging,(37) Raman spectroscopy,(38) and attenuated total reflectance–Fourier transform infrared (ATR–FTIR) spectroscopy (39) have become popular for the imaging of pharmaceutical formulations, which allows for spatial and chemical information to be obtained simultaneously. DESI MS, when performed in imaging mode, also enables the visualization of the distribution of chemicals, directly from an intact surface, without the need for chemical labeling or prior chemical treatment, and with the exquisite specificity offered by mass spectrometric detection. Because of the less-than-ideal conditions under which counterfeit drugs are expected to be manufactured, fake tablets could be unevenly mixed to some degree, which would be reflected as an inhomogeneous color distribution in a DESI image. Sample properties such as the hardness-dependent dissolution profile are also contributing factors that influence ion yields in DESI,(23) and these conditions would be directly reflected by DESI molecular images in a spatially resolved fashion. In the case of genuine samples, the information on the spatial distribution and homogeneity of different chemical species on a tablet surface is extremely valuable. For instance, some antimalarial therapies recommend that the tablets be split, to optimize the dosage and/or reduce the upfront cost to the patient. Under these circumstances, a nonhomogeneous distribution of the API would result in an incorrect dosage being administered.
Figure 4 shows DESI MS images of a genuine artesunate (formulation 15) constructed for four relevant ionic species. All four images are shown on the same-relative-intensity fake color scale (there is no correlation between the actual color of the formulations and their DESI-MS chemical images), thus allowing a qualitative comparison between species. Figures 4A and 4B show DESI images generated from the peaks at m/z 407.2 ([artesunic acid + Na]+) and 791.2 ([2 artesunic acid + Na]+). As indicated by these two images, artesunic acid seemed to be distributed on the tablet surface of this genuine sample quite homogenously. The formation of artesunic acid dimer was observed to be favored over the monomer, resulting in a more uniform and intense image (see Figure 4B). The preferential formation of artesunic dimer is largely dependent on the tablet surface hardness. A lower sample hardness improves the mass transport efficiency between the solid tablet phase and the liquid film formed by the DESI sprayer, thus increasing the concentration of active ingredients in secondary droplets, favoring dimerization during ion evaporation from charged droplets. The DESI MS image reconstructed from the peak at m/z 365.2 showed the spatial distribution of lactose in this sample, also revealing a small degree of heterogeneity (see Figure 4C). A DESI MS image of a common wrong API, m/z 174.1, which corresponds to sodiated acetaminophen is also shown (see Figure 4D), clearly indicating the absence of acetaminophen in this sample, as expected. In all images shown in Figure 4, the tablet edges were darker. This is an artifact introduced by the somewhat tilted tablet edges that lead to an increase in the sprayer tip-to-surface distance, reducing sensitivity.
Figure 4.
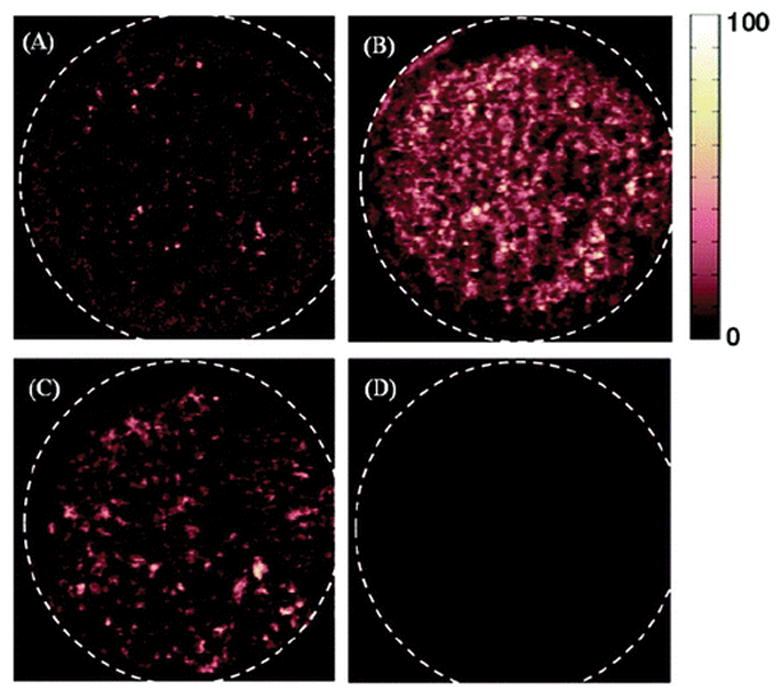
DESI MS images of a genuine artesunate tablet (formulation 15) constructed using the spatial relationship between various spectral features and their intensity, with data acquisition in full-scan MS mode: (A) sodiated artesunic acid monomer (m/z 407.2), (B) sodiated artesunic acid dimer (m/z 791.2), (C) sodiated lactose (m/z 365.3), and (D) sodiated acetaminophen (m/z 174.1). All images are shown in false color scale and pixilated format.
The DESI MS images of a counterfeit sample (formulation 16) are presented in Figure 5. Figures 5A and 5B show DESI MS images that was reconstructed for the peaks at m/z 174 ([acetaminophen + Na]+) and 325.1 ([2 acetaminophen + Na]+). Both indicated a very homogeneous distribution of acetaminophen in this sample. Such findings indicated that counterfeit drug manufacturers are using fairly sophisticated formulation techniques as part of their operation. The spatial distribution of lactose was also homogeneous, as observed for the DESI MS image that was reconstructed at m/z 365.3 (see Figure 5C). Figure 5D shows the DESI MS image that was constructed from the sodiated artesunic acid ion, which was not detected in this case. However, trace amounts of artesunate have been reported to be present on the surface of other types of fake tablets.(21) The capability of detecting small amounts of artesunate afforded by imaging DESI MS is critical in detecting subtherapeutic counterfeit antimalarials that may induce parasite resistance. Such trace amounts may remain undetected if the sample is homogeneized, diluted, and analyzed by DOSY 1H NMR or if DESI and/or DART are only performed on a small portion of the sample surface.
Figure 5.
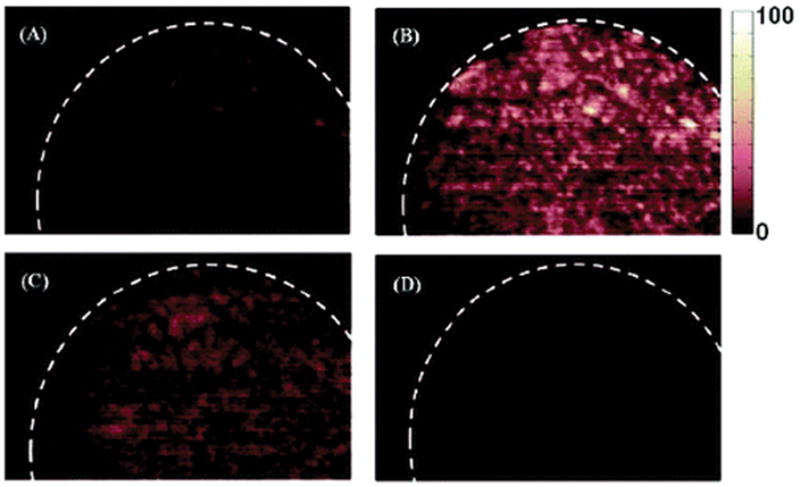
DESI MS images of a counterfeit artesunate sample (formulation 16) constructed based on the spatial relationship between various spectral features and their intensity, with data acquisition in full-scan MS mode: (A) sodiated acetaminophen (m/z 174.1), (B) sodiated acetaminophen dimer (m/z 325.1), (C) sodiated lactose (m/z 365.3), and (D) sodiated artesunic acid monomer (m/z 407.2). All images are shown in false color scale and pixilated format.
Conclusions
This study highlights the use of complementary analytical methods—two-dimensional diffusion-ordered 1H nuclear magnetic resonance spectroscopy (2D DOSY 1H NMR) and ambient direct analysis in real-time mass spectrometry (DART MS) and desorption electrospray ionization mass spectrometry (DESI MS), to characterize the chemical composition of counterfeit antimalarial drugs. Both types of methods enabled the detection of various active pharmaceutical ingredients (APIs), together with various tablet excipients. For a total of 16 samples, the correct API was observed in only six formulations. The remaining formulations were observed to contain various “wrong” APIs. Samples were readily classified into seven classes (or “chemotypes”). DESI and DART did not readily offer information about the presence of stearate and polymeric excipients such as dextrin, which were detected by DOSY 1H NMR. Interestingly, no disaccharides (lactose, sucrose) were detected by DART, possibly because of the different desorption mechanism of this technique, which is believed to be predominantly thermal, compared to DESI, which relies on the solubility of the analyte in the spray solution. The increased peak capacity in the 2D DOSY 1H NMR spectrum, compared to the classical one-dimensional (1D) 1H NMR spectrum, results from the use of both chemical shifts and diffusion coefficients as analytical dimensions. This makes the technique very appealing. Increased dimensionality and valuable structural information in DESI was obtained from MSn experiments, but this is a property of the mass analyzer used, rather than being a property of the ionization technique chosen. In this line of thought, DART TOF MS offered accurate mass information and complemented and validated the NMR and DESI results. DESI MS in imaging mode provided information on sample homogeneity and impurities that may not be detectable with other approaches.
Supplementary Material
Acknowledgments
This study was supported by a graduate scholarship from the U.S. Pharmacopeia to L.N., and an NSF CAREER Award to F.M.F. The collection of artesunate samples was funded by the Wellcome Trust of Great Britain as part of the Wellcome Trust-South East Asian Oxford Tropical Medicine Research Collaborations. The authors are extremely grateful to all who have assisted in the collection of samples and to Dr. Paul Newton for guidance and comments on the manuscript.
Footnotes
Table giving 2D DOSY 1H NMR and ambient (DART/DESI) MS data for the active pharmaceutical ingredients detected in the artesunate antimalarial samples investigated in this study. Figures depicting the analysis of formulations 1, 3, and 10. (PDF) This material is available free of charge via the Internet at http://pubs.acs.org.
References
- 1.Newton PN, Green M, Fernandez FM, Day NPJ, White NJ. Lancet Infect Dis. 2006;6:602–612. doi: 10.1016/S1473-3099(06)70581-3. [DOI] [PubMed] [Google Scholar]
- 2.Fernandez FM, Newton PN, Green M. Ind Eng Chem Res. 2008;47:585–590. [Google Scholar]
- 3.Wondemagegnehu E. WHO Report. 1999. WHO/EDM/QSM/99.3. [Google Scholar]
- 4.International Medical Products Anti-Counterfeiting Taskforce (IMPACT) http://www.who.int/medicines/services/counterfeit/impact/TheNewEstimatesCounterfeit.pdf.
- 5.Counterfeit Drugs Questions and Answers. Available via the Internet at http://www.fda.gov/oc/initiatives/counterfeit/qa.html.
- 6.Weiss AM. Cleveland Clin J Med. 2006;73:282–288. doi: 10.3949/ccjm.73.3.282. [DOI] [PubMed] [Google Scholar]
- 7.White NJ. Science. 2008;320:330–334. doi: 10.1126/science.1155165. [DOI] [PubMed] [Google Scholar]
- 8.Newton P, Proux S, Green M, Smithuis F, Rozendaal J, Prakongpan S, Chotivanich K, Mayxay M, Looareesuwan S, Farrar J, Nosten F, White NJ. Lancet. 2001;357:1948–1950. doi: 10.1016/S0140-6736(00)05085-6. [DOI] [PubMed] [Google Scholar]
- 9.Rozendaal L. Bull Mekong Malaria Forum. 2000;7:62–68. [Google Scholar]
- 10.Sengaloundeth S, Green MD, Fernandez FM, Manolin O, Phommavong K, Insixiengmay V, Hampton CY, Nyadong LN, Mildenhall D, Khounsaknalath L, Syhakhang L, Newton PN. 2009 doi: 10.1186/1475-2875-8-172. Submitted to Malaria J. [DOI] [PMC free article] [PubMed] [Google Scholar]
- 11.Newton PN, Fernandez FM, Plancon A, Mildenhall DC, Green MD, Ziyong L, Christophel EM, Phanouvong S, Howells S, McIntosh E, Laurin P, Blum N, Hampton CY, Faure K, Nyadong L, Soong CW, Santoso B, Zhiguang W, Newton J, Palmer K. PLoS Med. 2008;5:e32. doi: 10.1371/journal.pmed.0050032. [DOI] [PMC free article] [PubMed] [Google Scholar]
- 12.Ricci C, Nyadong L, Yang F, Fernandez FM, Brown CD, Newton PN, Kazarian SG. Anal Chim Acta. 2008;623:178–186. doi: 10.1016/j.aca.2008.06.007. [DOI] [PubMed] [Google Scholar]
- 13.Johnson CS. Prog Nucl Magn Reson Spectrosc. 1999;34:203–256. [Google Scholar]
- 14.Cody RB, Laramee JA, Durst HD. Anal Chem. 2005;77:2297–2302. doi: 10.1021/ac050162j. [DOI] [PubMed] [Google Scholar]
- 15.Takats Z, Wiseman JM, Gologan B, Cooks RG. Science. 2004;306:471–473. doi: 10.1126/science.1104404. [DOI] [PubMed] [Google Scholar]
- 16.Kertesz V, Van Berkel GJ. Rapid Commun Mass Spectrom. 2008;22:2639–2644. doi: 10.1002/rcm.3662. [DOI] [PubMed] [Google Scholar]
- 17.Kertesz V, Van Berkel GJ, Vavrek M, Koeplinger KA, Schneider BB, Covey TR. Anal Chem. 2008;80:5168–5177. doi: 10.1021/ac800546a. [DOI] [PubMed] [Google Scholar]
- 18.Wiseman JM, Ifa DR, Zhu Y, Kissinger CB, Manicke NE, Kissinger PT, Cooks RG. Proc Natl Acad Sci USA. 2008;105:18120–18125. doi: 10.1073/pnas.0801066105. (and Erratum, 2009, 106, 6022) [DOI] [PMC free article] [PubMed] [Google Scholar]
- 19.Harris GA, Nyadong L, Fernandez FM. Analyst. 2008;133:1297–1301. doi: 10.1039/b806810k. [DOI] [PubMed] [Google Scholar]
- 20.Fernandez FM, Cody RB, Green MD, Hampton CY, McGready R, Sengaloundeth S, White NJ, Newton PN. ChemMedChem. 2006;1:702–705. doi: 10.1002/cmdc.200600041. [DOI] [PubMed] [Google Scholar]
- 21.Nyadong L, Green MD, De Jesus VR, Newton PN, Fernandez FM. Anal Chem. 2007;79:2150–2157. doi: 10.1021/ac062205h. [DOI] [PubMed] [Google Scholar]
- 22.Nyadong L, Hohenstein EG, Johnson K, Sherrill CD, Green MD, Fernandez FM. Analyst. 2008;133:1513–1522. doi: 10.1039/b809471c. [DOI] [PubMed] [Google Scholar]
- 23.Nyadong L, Late S, Green MD, Banga A, Fernandez FM. J Am Soc Mass Spectrom. 2008;19:380–388. doi: 10.1016/j.jasms.2007.11.016. [DOI] [PubMed] [Google Scholar]
- 24.Trefi S, Gilard V, Malet-Martino M, Martino R. J Pharm Biomed Anal. 2007;44:743–754. doi: 10.1016/j.jpba.2007.02.031. [DOI] [PubMed] [Google Scholar]
- 25.Trefi S, Routaboul C, Hamieh S, Gilard V, Malet-Martino M, Martino R. J Pharm Biomed Anal. 2008;47:103–113. doi: 10.1016/j.jpba.2007.12.033. [DOI] [PubMed] [Google Scholar]
- 26.Newton PN, Green M, Fernandez FM. PLoS Med. 2007;4:e139. doi: 10.1371/journal.pmed.0040139. [DOI] [PMC free article] [PubMed] [Google Scholar]
- 27.Holz M, Heil SR, Sacco A. Phys Chem Chem Phys. 2000;2:4740–4742. [Google Scholar]
- 28.Lee CH, Hong H, Shin J, Jung M, Shin I, Yoon J, Lee W. Biochem Biophys Res Commun. 2000;274:359–369. doi: 10.1006/bbrc.2000.3086. [DOI] [PubMed] [Google Scholar]
- 29.NMRtec. Nmrnotebook software. 2007 Available via the Internet at http://nmrtec.com.
- 30.Harris GA, Fernandez FM. Anal Chem. 2009;81:322–329. doi: 10.1021/ac802117u. [DOI] [PubMed] [Google Scholar]
- 31.http://www.who.int/medicines/en/.
- 32.Venter A, Sojka PE, Cooks RG. Anal Chem. 2006;78:8549–8555. doi: 10.1021/ac0615807. [DOI] [PubMed] [Google Scholar]
- 33.Nyadong L, Hohenstein EG, Johnson K, Sherrill CD, Green MD, Fernandez FM. Analyst. 2008;133:1513–1522. doi: 10.1039/b809471c. [DOI] [PubMed] [Google Scholar]
- 34.Lin AJ, Klayman DL, Milhous WK. J Med Chem. 1987;30:2147–2150. doi: 10.1021/jm00394a037. [DOI] [PubMed] [Google Scholar]
- 35.Wong JW, Yuen KH. Int J Pharm. 2001;227:177–185. doi: 10.1016/s0378-5173(01)00796-7. [DOI] [PubMed] [Google Scholar]
- 36.Allen LVJ, Popovick NG, Ansel HC, Allen LV. Ansel’s Pharmaceutical Dosage Forms and Drug Systems. Lippincott Williams and Wilkins; Philadelphia, PA: 2004. [Google Scholar]
- 37.Johansson J, Pettersson S, Taylor LS. J Pharm Biomed Anal. 2002;30:1223–1231. doi: 10.1016/s0731-7085(02)00461-2. [DOI] [PubMed] [Google Scholar]
- 38.Wartewig S, Neubert RH. Adv Drug Delivery Rev. 2005;57:1144–1170. doi: 10.1016/j.addr.2005.01.022. [DOI] [PubMed] [Google Scholar]
- 39.Ricci C, Nyadong L, Fernandez FM, Newton PN, Kazarian SG. Anal Bioanal Chem. 2007;387:551–559. doi: 10.1007/s00216-006-0950-z. [DOI] [PubMed] [Google Scholar]
Associated Data
This section collects any data citations, data availability statements, or supplementary materials included in this article.