

SECTION I. Introduction
CANCER is the second largest cause of death after heart disease in America. Renal cell carcinoma (RCC), also known as Hypernephroma, occurs in epithelial cells of the kidney's tubules. RCC represents about 3% of all adult malignancies and 90–95% of neoplasms arising from the kidney. The American Cancer Society reported 51,590 new cases, and 12,890 deaths in 2009 [1]. The World Health Organization defines many subtypes of RCC. Clear cell (CC) is the most common and accounts for about 83% of all RCC cases. Other common subtypes are Papillary (PA), Oncocytoma (ON), and Chromophobe (CH) accounting for 11%, 4%, and 2% of all RCC cases, respectively [2]. Since treatment varies for each subtype, therefore, accurate classification of RCC subtypes is clinically very important.
The process of manual diagnosis of tissue biopsies is time consuming and subjective. Computer assisted diagnosis (CAD) systems attempt to assist pathologist by speeding up analysis, and minimizing subjectivity. While many CAD systems have been proposed, most focus on cancer versus non-cancer [3][4][5]. In this paper we propose a CAD system for RCC subtype classification. Figure 1, shows an example image of each subtype of RCC. These subtypes exhibit similar morphological characteristics (inter-class homogeneities). For example, lumen spaces (inside space of cell) are common in all subtypes, and some samples of the same class are very different from rest of the samples in that class (intra-class heterogeneities). For example, some images of ON have small halo around nuclei. This increases the complexity of the RCC subtype classification task.
Figure 1.
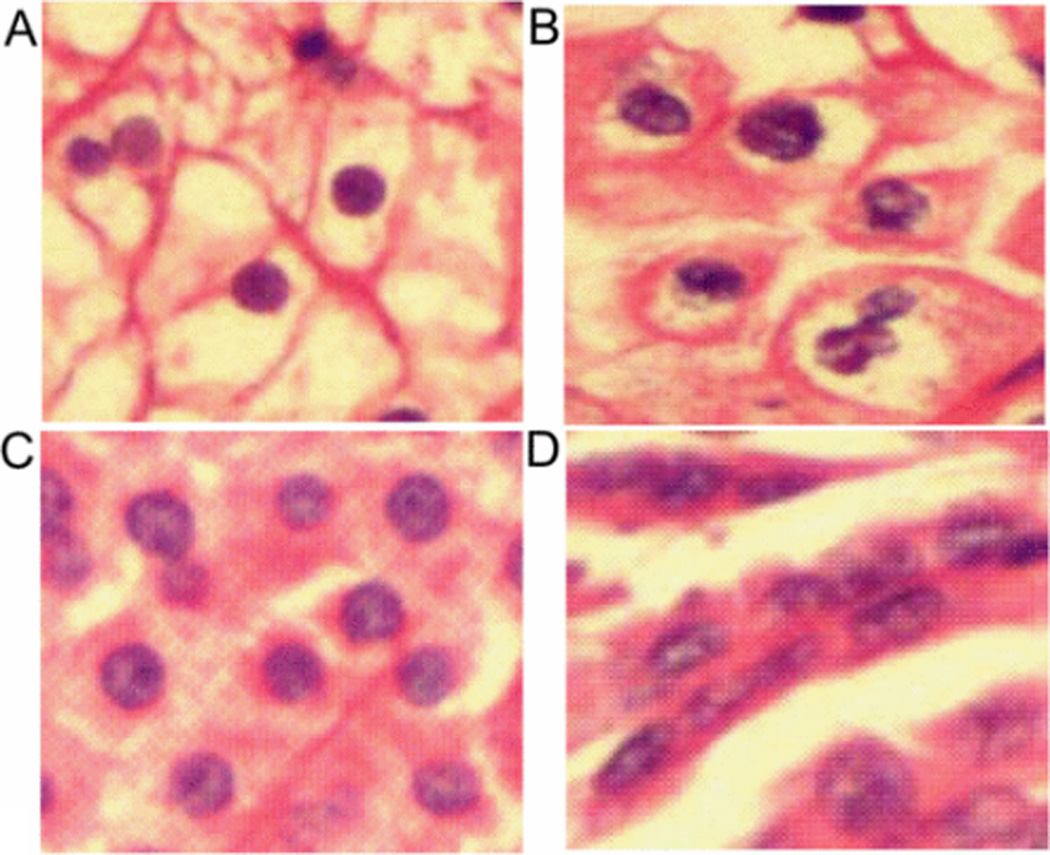
RCC subtype images, A) Clear Cell, B) Chromophobe, C) Oncocytoma, and D) Papillary.
CAD systems depend on a variety of image features including textural features [5][6][7], wavelet features [8][9], and combination of these features [5][6][8]. These features are dependent upon accuracy of color segmentation and therefore might not perform well for new data sets due to noise in image acquisition, or staining variations. Our CAD system uses scale invariant feature transform (SIFT) [10]. SIFT features have been shown to be widely successful in object recognition [10][11]. SIFT features make our CAD system independent of color segmentation, and handle variations in scale, illumination, and staining.
More recently, CAD systems have been proposed for RCC subtype classification. A very high classification accuracy was reported by Waheed et al. [12], however, a pathologist interacted with the CAD system, including manually selecting region of interest for classification. Chaudry et al. [8], extracted textural, morphological, and wavelet based features from complete images for RCC subtype classification. By using region of interest selection, the classification accuracy was improved from 87% to 92% [13].
Raza et al. [14], used scale invariant feature transform (SIFT) for RCC subtype classification. This study used template images of each subtype to match against new samples for classification. These template images were selected manually and classification accuracy was highly dependent on the choice of these templates. Figure 2, illustrates the variation in classification accuracy by selecting different sets of template images. Classification accuracy varies from 30% to 95% depending upon the choice of template images but mean classification accuracy is about 50% when using only one template image of each subtype and 67% if two images of each subtype are selected, far below reported values. To overcome these limitations, we propose a bag-of-features approach to capture common morphological characteristics of each subtype [15][16]. We use SIFT features to decompose an image into a collection of small patches, and generate a codebook of descriptors. In this paper, we develop a CAD system for subtype classification of RCC using a bag-of-features approach using SIFT features. The main contributions of this approach are that it:
does not require color segmentation,
does not require expertly chosen template images, and
performs consistently with average classification accuracy above 90% shown by 40 iteration of 3-fold cross validation.
We now explain our methods in more detail, including the origins of the imaging data from which we draw our conclusions.
Figure 2.
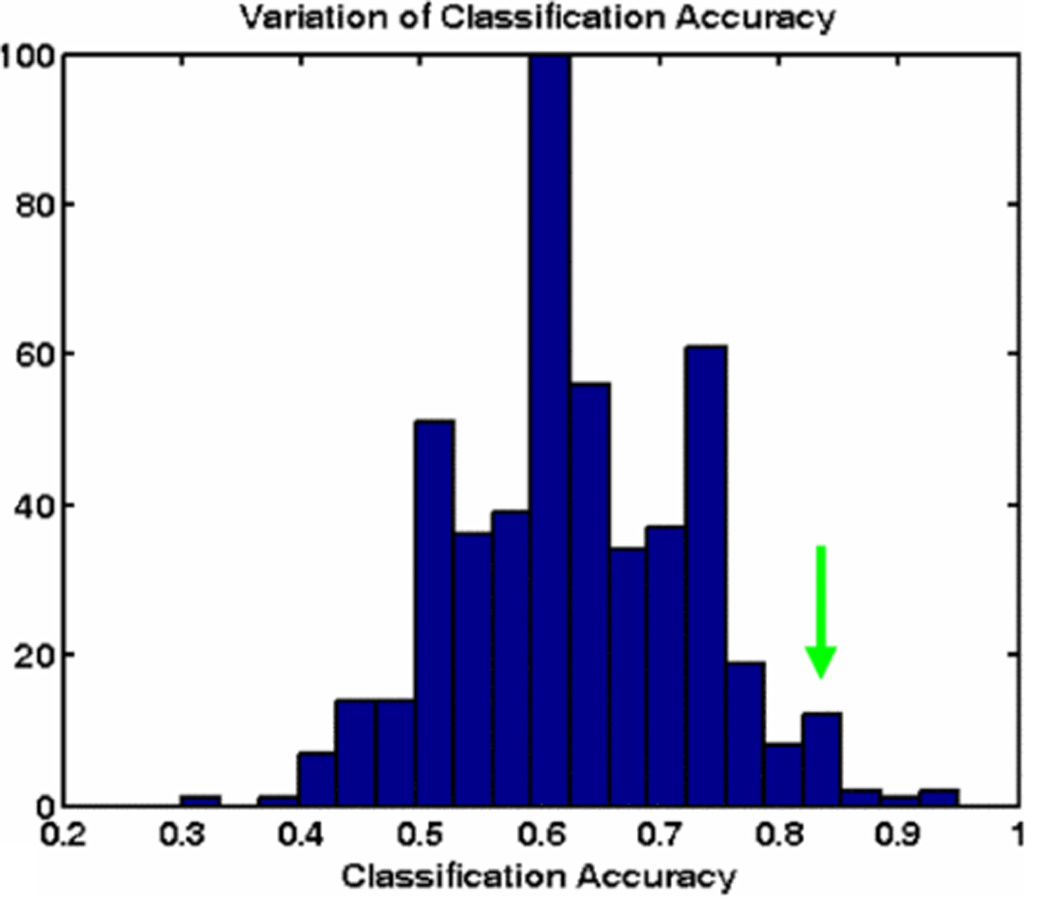
Classification Accuracy using different set of template images, mean accuracy is 67%. Green arrow shows the accuracy reported by Raza et al. [14].
SECTION II. Materials
Standard pathological procedures were followed to fix, embed, section, and stain tissue samples for this study derived from renal tumors resected by total nephrecromy. Samples were stained with hematoxylin and eosin (H&E). Photomicrographs were captured under 200x magnification at 1200×1600 pixels per image. A total of 48 images (12 of each subtype) were captured and used in this study.
SECTION III. Methods
We first convert all the images to grayscale intensity images. These images are used for key point detection and SIFT descriptor extraction. We use K-Means clustering on training images in a feature space composed of SIFT descriptors to construct the vocabulary. We constructed vocabularies of different sizes for k=5, 20, 40, 50 and 100. Then, we represent every image as counts of the number of descriptors assigned to each cluster (vocabulary descriptor), called bag-of-features. These bags-of-features compose a feature space for classification. Finally, we train a linear support vector machine in this feature space to discriminate between subclasses of training samples and evaluate our method using 3-fold cross validation. Figure 3, shows the flow diagram of complete methodology.
Figure 3.
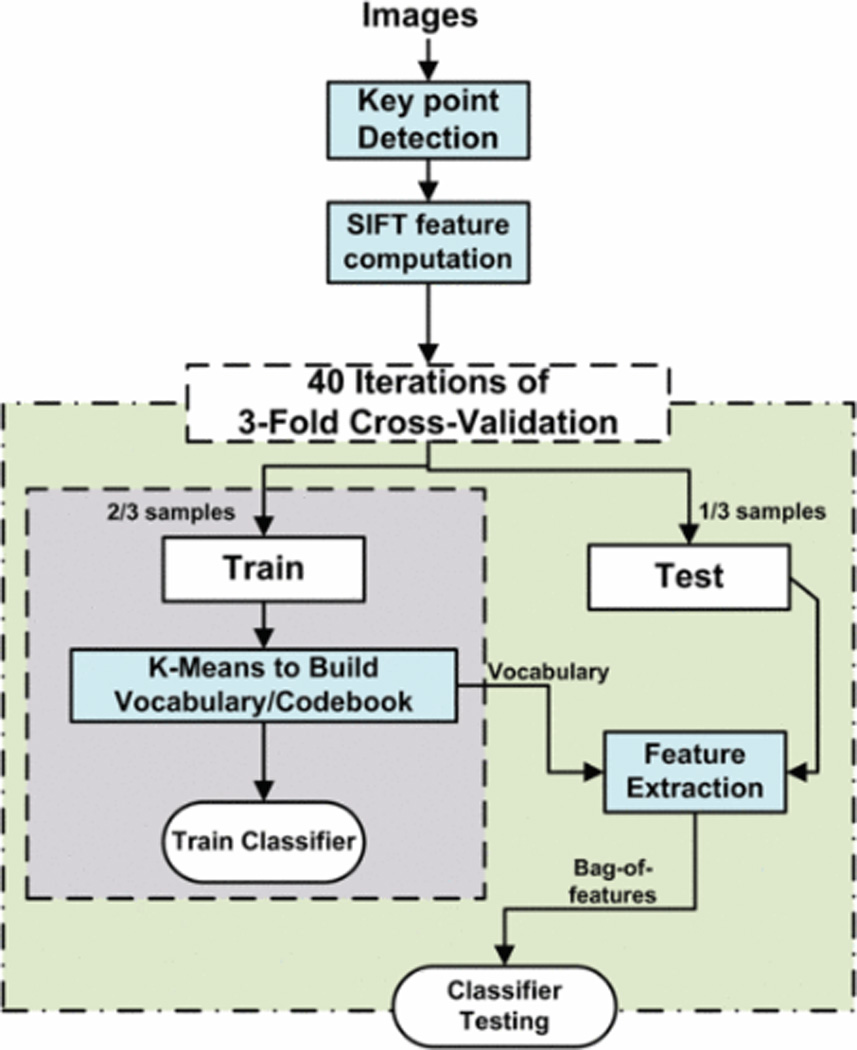
Methodology for RCC subtype classification using bag of features
A. Key Point Detection
Key points are interesting points which can be detected under different scaling and translation changes. Consider that if we have different views of the same object, we would like to detect the same points in all of these views. In our study, we used a difference of Gaussian (DOG)[10] filter as key point detector. Figure 4, shows a Chromophobe (CH) image with key points detected by DOG method. We observe that these key points are frequent in cancerous regions and rare in the relatively smooth lumen spaces, which are common to all subtypes. Key point detection provides two main advantages. First, we avoid lumen spaces without requiring region of interest (ROI) information as used by Chaudry et al. [13]. Second, corner detection makes this algorithm repeatable, i.e. the exact same key points will be selected for reanalysis of the same image, and corresponding points will be selected for different transforms of the same image.
Figure 4.
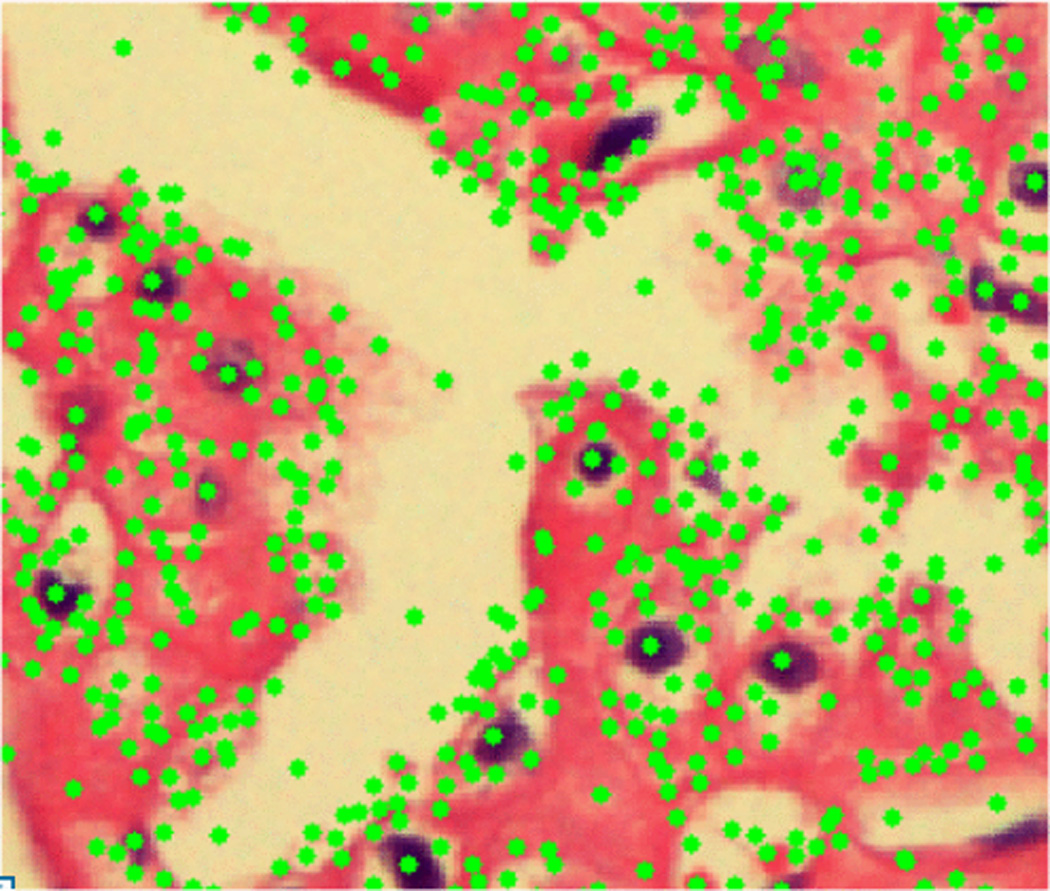
Key points location in CH RCC image, key points avoid lumen spaces and give dense sampling in cancerous regions.
B. SIFT Feature and Vocabulary Construction
SIFT descriptors are computed around each key point to describe the morphology. For computation of SIFT descriptors, we used a window size of 16×16 around the key point. SIFT features computed from all the training images are used for building vocabulary by K-means [17] clustering. The purpose of building the vocabulary is to quantize the wide variation of all the SIFT features to capture the characteristics morphology of each subtype. For example, blue square regions in figure 6 show the ON characteristic morphology. We cluster similar SIFT features into one cluster by K-Means and only use center of that cluster as a SIFT feature in our vocabulary. We construct vocabularies/codebooks of different sizes (number of clusters) to find the best vocabulary size.
Figure 6.
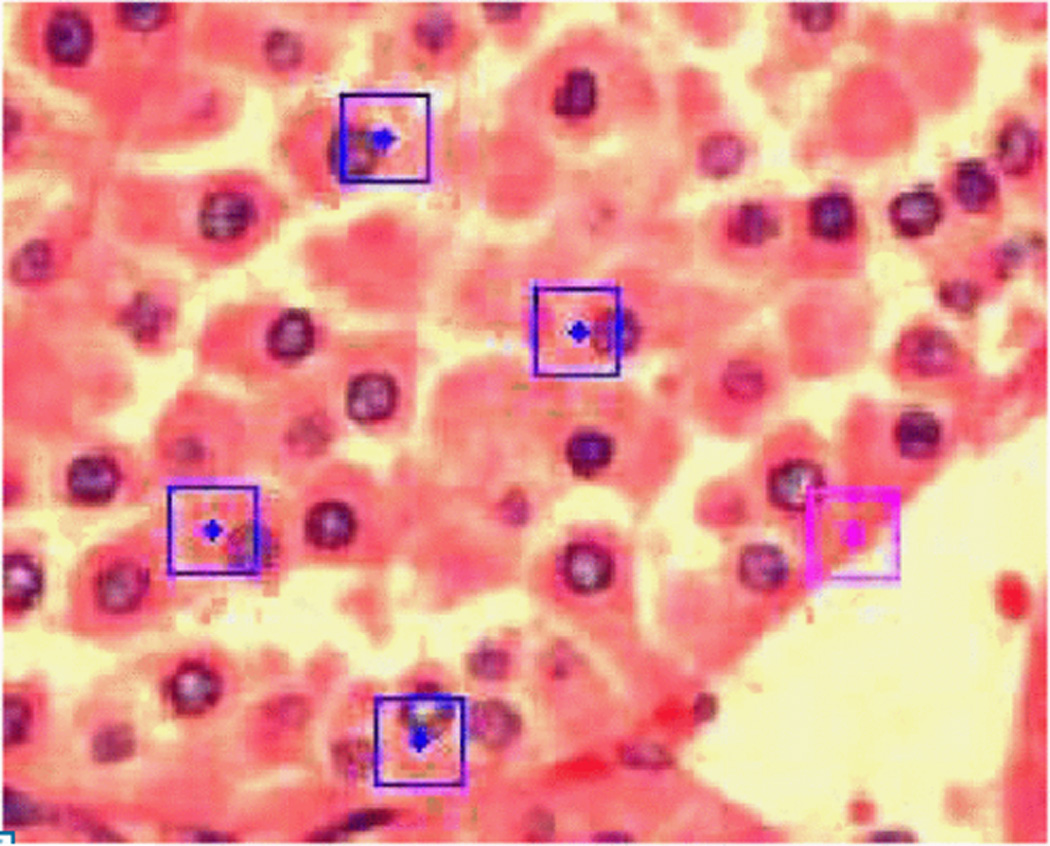
Oncocytoma RCC image showing key points matched with most common occurring cluster in vocabulary. Square represents the region used for SIFT feature computation and dot represents the center.
C. Feature Extraction
The vocabulary constructed from training images is used for bag-of-features extraction. Each SIFT feature from a test image is matched with clusters in the vocabulary. It is assigned to the cluster to which it is closest. This gives bag-of-features the same size as the number of clusters. Feature extraction is followed by classification.
D. Classification
We used linear SVM for classification. Our dataset consists of 48 images, having 12 images of each subtype. SVM is a binary classifier. To use it for a multiclass problem we used the “one vs. one” with max voting strategy [18]. Using this methodology we constructed N* (N−1)/2 i.e. 6 binary classifiers, where N represents number of classes, in our case 4. Each test image is classified by these 6 binary classifiers, one for each pair of four subtypes, and is assigned to the class with maximum votes. We performed 40 iterations of 3-fold cross validation and bags-of-feature of size 50 gave classification accuracy of 93%.
SECTION IV. Results
Figure 5, shows classification accuracy for one iteration of 3-fold cross validation, for different sizes of the bag-of-features. We observed that classification accuracy for a vocabulary of size 20 or greater is very good. Bag-of-features of size 50 performs slightly better than others. Table 1, gives the confusion matrix for average classification accuracy of RCC for bag-of-features of size 50 over 40 iterations. Figure 6, shows an Oncocytoma image with key points matched with the most common occurring cluster in vocabulary. Figure 7, shows the distribution classification accuracy for 40 iterations with mean classification accuracy about 93%.
Figure 5.
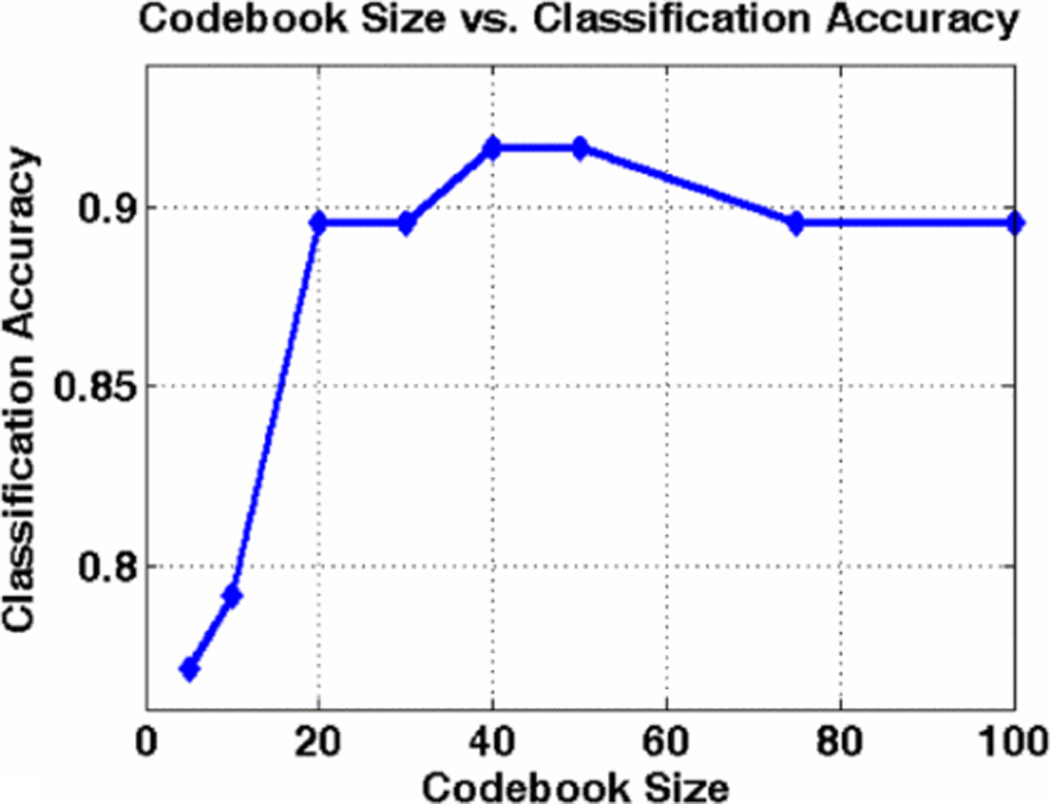
Classification accuracy for different size of bag-of-features
Table 1.
Confusion matrix of average RCC classification using bog-of-features of-feature of size 50 over 40 iterations.
| CC | CH | ON | PA | |
|---|---|---|---|---|
| CC | 86.97% | 12.39% | 0.64% | 0.00% |
| CH | 1.28% | 95.73% | 2.78% | 0.21% |
| ON | 0.85% | 4.91% | 92.95% | 1.28% |
| PA | 0.43% | 0.64% | 1.71% | 97.22% |
Figure 7.
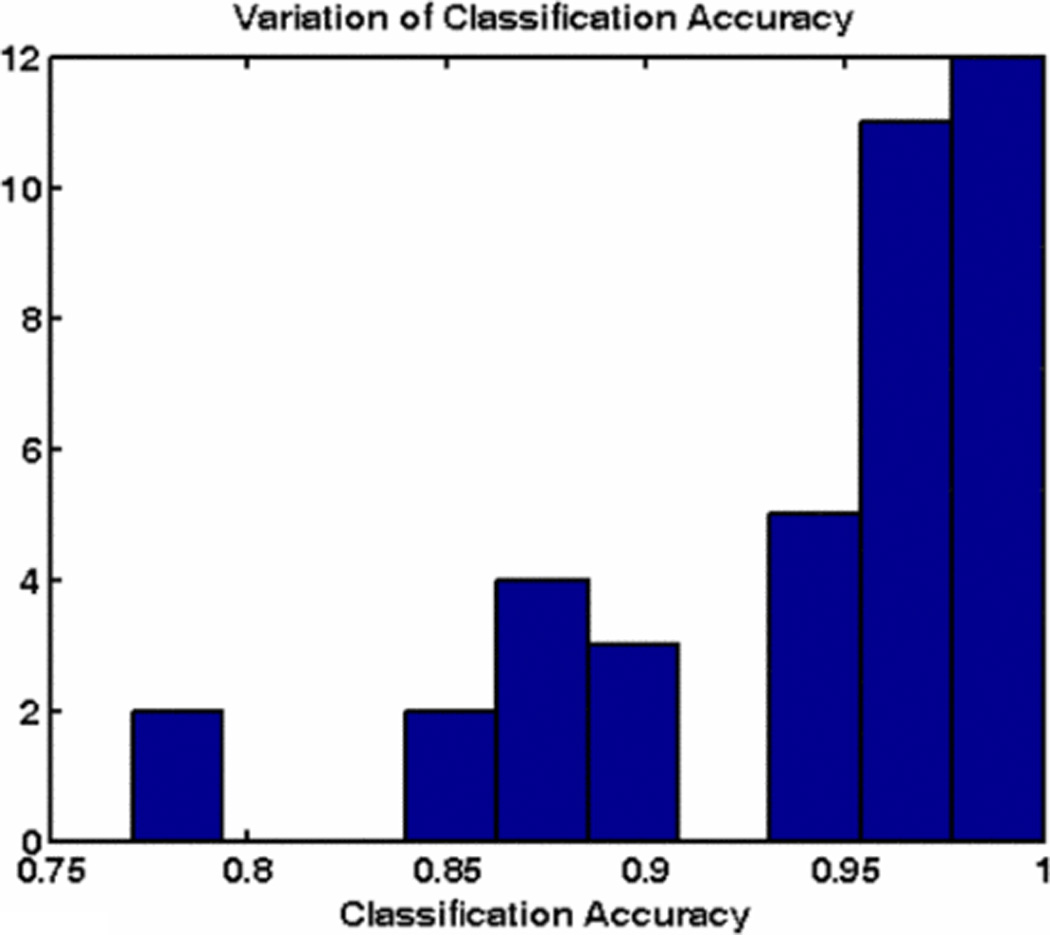
classification accuracy trend for bag-of-features of size 50 over 40 iterations.
SECTION V. Conclusion and Future work
In this study, we show that a bag-of-features approach can be successfully used to develop a CAD system for H&E stained microscopic image classification, using RCC as a case study. This methodology is independent of color segmentation and does not require any manually annotated/selected template images. SIFT features provide our CAD system the ability to encapsulate morphological characteristics of each subtype, and bag-of-features using k-means clustering helps to avoid the requirements of template images and exact matches. Our method gives a higher mean accuracy and smaller variation than the previous approach, which used template images. In the future, we would like to improve the codebook for RCC classification. We would also like to expand this methodology for cancer grading. Results shown in this study suggest the potential of using this methodology for future clinical applications.
REFERENCES
- 1.Atlas of Genetics and Cytogenetics in Oncology and Haematology. Available: " http://AtlasGeneticsOncology.org".
- 2.National Cancer Institute - Kidney Cancer. Available : http://www.cancer.gov/cancertopics/types/kidney.
- 3.Esgiar A, Naguib R, Sharif B, Bennett M, Murray A. Microscopic image analysis for quantitative measurement and feature identification of normal and cancerous colonic mucosa. IEEE transactions on information technology in biomedicine. 1998;2:197–203. doi: 10.1109/4233.735785. [DOI] [PubMed] [Google Scholar]
- 4.Esgiar A, Naguib R, Sharif B, Bennett M, Murray A. Fractal analysis in the detection of colonic cancer images. IEEE transactions on information technology in biomedicine. 2002;6:54–58. doi: 10.1109/4233.992163. [DOI] [PubMed] [Google Scholar]
- 5.Fernández M, Mavilio A. Texture analysis of medical images using the wavelet transform. 2002:164. [Google Scholar]
- 6.Diamond J, Anderson N, Bartels P, Montironi R, Hamilton P. The use of morphological characteristics and texture analysis in the identification of tissue composition in prostatic neoplasia. Human Figure 6: Oncocytoma RCC image showing key points matched pathology. 2004;35:1121–1131. doi: 10.1016/j.humpath.2004.05.010. with most common occurring cluster in vocabulary. Square represents the region used for SIFT feature computation and dot represents the center. [DOI] [PubMed] [Google Scholar]
- 7.Walker R, Jackway P, Lovell B, Longstaff I. Classification of cervical cell nuclei using morphological segmentation and textural feature extraction. 1994:297–301. [Google Scholar]
- 8.Chaudry Q, Raza S, Young A, Wang M. Automated Renal Cell Carcinoma Subtype Classification Using Morphological, Textural and Wavelets Based Features. Journal of Signal Processing Systems. 2009;55:15–23. doi: 10.1007/s11265-008-0214-6. [DOI] [PMC free article] [PubMed] [Google Scholar]
- 9.Arivazhagan S, Ganesan L. Texture classification using wavelet transform. Pattern Recognition Letters. 2003;24:1513–1521. [Google Scholar]
- 10.Lowe D. Distinctive image features from scale-invariant keypoints. International journal of computer vision. 2004;60:91–110. [Google Scholar]
- 11.Suga A, Fukuda K, Takiguchi T, Ariki Y. Object Recognition and Segmentation Using SIFT and Graph Cuts. 2008:1–4. [Google Scholar]
- 12.Waheed S, Moffitt R, Chaudry Q, Young A, Wang M. Computer Aided Histopathological Classification of Cancer Subtypes. 2007:503–508. [Google Scholar]
- 13.Chaudry Q, Raza S, Sharma Y, Young A, Wang M. Improving renal cell carcinoma classification by automatic region of interest selection. 2008:1–6. doi: 10.1109/BIBE.2008.4696796. [DOI] [PMC free article] [PubMed] [Google Scholar]
- 14.Raza SH, Sharma Y, Chaudry Q, Young A, Wang MD. EMBC Minneapolis. 2009. Automated Classification of Renal Cell Carcinoma Subtypes Using Scale Invariant Feature Transform. [DOI] [PMC free article] [PubMed] [Google Scholar]
- 15.Csurka G, Dance C, Fan L, Willamowski J, Bray C. Visual categorization with bags of keypoints. 2004:22. [Google Scholar]
- 16.Jiang Y, Ngo C, Yang J. Towards optimal bag-of-features for object categorization and semantic video retrieval. 2007:501. [Google Scholar]
- 17.Weeks A, Hague G. Color segmentation in the HSI color space using the K-means algorithm. 1997:143. [Google Scholar]
- 18.Duan K, Keerthi S. Which is the best multiclass SVM method? An empirical study. Multiple Classifier Systems. 2005:278–285. [Google Scholar]