Abstract
We present omniSpect, an open source web- and Matlab-based software tool for both desorption electrospray ionization (DESI) and matrix-assisted laser desorption ionization (MALDI) mass spectrometry imaging (MSI) that performs computationally intensive functions on a remote server. These functions include converting data from a variety of file formats into a common format easily manipulated in MATLAB, transforming time-series mass spectra into mass spectrometry images based on a probe spatial raster path, and multivariate analysis. OmniSpect provides an extensible suite of tools to meet the computational requirements needed for visualizing open and proprietary format MSI data.
Graphical Abstract
TOC entry
OmniSpect is a freely-available software for mass spectrometry imaging experiments that accepts inputs from a variety of techniques such as DESI and MALDI, can be run on a remote server or as a standalone GUI, and is open source.
Introduction
We report on omniSpect, an open source, web-based, multivariate analysis and visualization tool implemented in MATLAB, which supports various MSI data formats common in desorption electrospray ionization (DESI) and matrix-assisted laser desorption/ionization (MALDI) imaging. The need for computational support for high throughput data acquisition presents a challenge for large mass spectrometry imaging (MSI) datasets. Visualizing and exploring such datasets without prior chemical knowledge of targets increasingly involves multivariate analysis that requires powerful computational resources. Web- or cloud-based tools accessed directly from a web browser can provide the necessary computational power to avoid bottlenecks without the expense of a dedicated workstation or computer cluster.
Omnispect contributes to a small but growing set of open source MSI tools [1–6] and provides a suite of multivariate analysis, and, to our knowledge, the first web-based tool for MSI data processing for both MALDI and DESI MSI, moving computationally intense operations to higher performance servers. OmniSpect can be operated remotely through PHP scripts that define web pages for uploading data, accepting user input, and displaying MSI data analysis results or locally through a GUI. The PHP scripts call backend MATLAB scripts to conduct the analysis. Finally, all uploaded data and intermediate analysis files are saved to a public directory for download.
OmniSpect distinguishes itself from a large number of existing software tools (e.g., see http://www.ms-utils.org/) by providing a simpler scripting interface in MATLAB compared to C++ or Java source code provided by other open source projects, while maintaining core MSI data analysis capabilities. This simplifies modifying software for those without significant computer programming experience. For MSI applications, one of the more popular software tools is BioMap (http://www.maldi-msi.org), which provides a free but closed-source solution [7] that users cannot adapt or extend, and does not provide support for multivariate data analysis. Several other tools have been reported with additional features to better analyze MSI datasets, including: semi-supervised segmentation [8], region of interest and peak detection [1], microscopic image alignment and enhancement [3], molecular feature extraction for classification [9], multivariate curve resolution [10], regression-based ion selection [5], and integrated sequencing and localization of proteins [6].
Experimental
Programming Background
OmniSpect accepts time-series imaging data in mzXML and netCDF format for home-built DESI or other ambient MSI experiments, as well as three-dimensional image cubes in imzML or Analyze 7.5 format from commercial DESI software (e.g. Firefly, Prosolia, Indianapolis, IN). From the microprobe raster path and timing information, OmniSpect first creates an image cube by linearly interpolating between the (x, y) positions of the mass spectra [11]. For example, omniSpect currently supports a “comb” shaped data acquisition raster path used in DESI MSI experiments, as presented under Supplementary Information. Other MSI platforms export image cubes directly which can be input without further processing into the analysis scripts.
DESI MSI Experiments
DESI MSI experiments were performed on a previously described platform consisting of a home-built DESI probe coupled to a time-of-flight mass spectrometer (JEOL AccuTOF, Tokyo, Japan) instrument [12]. All the parameters used are detailed under Supplementary Information.
Data Analysis
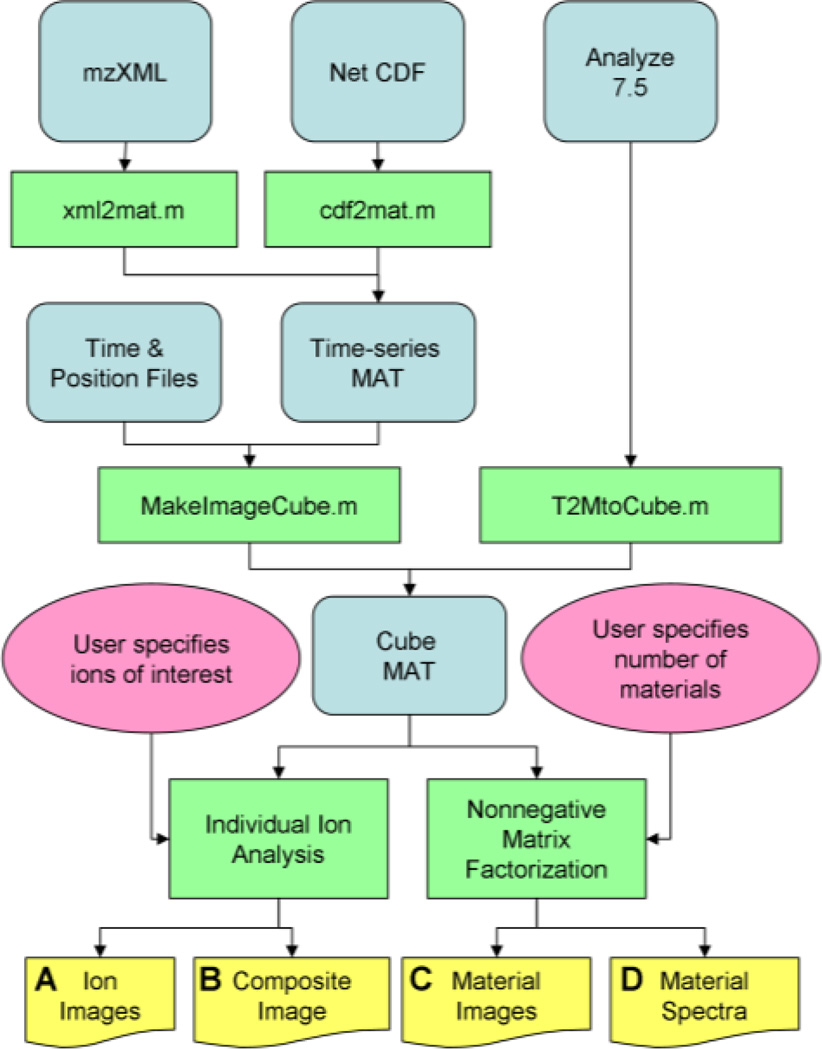
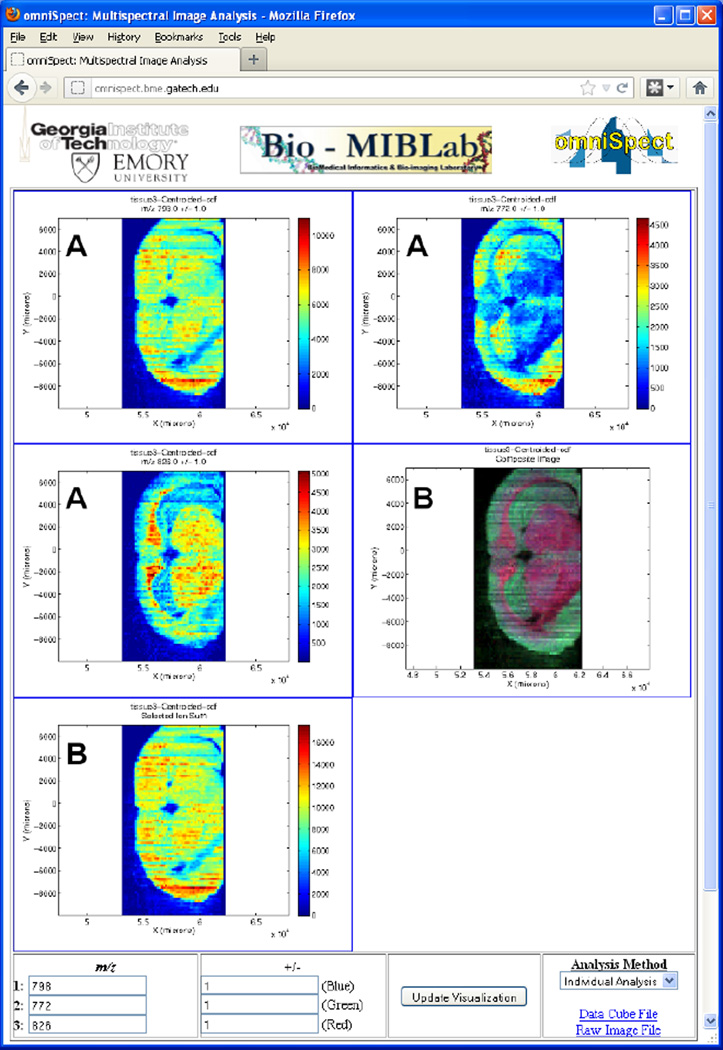
Figure 1 summarizes the data conversion and analysis workflow. OmniSpect first converts from a variety of input formats including NetCDF, mzXML, imzML, and Analyze 7.5 into a simple MATLAB representation (cube MAT) available for direct download from omniSpect. Then, the current omniSpect version provides two analysis methods. First, the user may select up to three ions of interest along with ranges within which abundances are accumulated for individual ion analysis. OmniSpect provides one color-mapped image per ion (Fig. 2 outputs A) and composite images (Fig. 2 outputs B), including an image with normalized abundance of each ion in a different color channel (red, green, or blue) and a total ion image containing the total abundance of up to three ions. In this way, the user can select ions based on domain knowledge and view their spatial distribution.
Figure 1.
Data conversion and analysis workflow. Rectangles, rounded rectangles, and ellipses, represent open source Matlab functions, data files, and user input, respectively. The objects at the bottom represent the output documents.
Figure 2.
OmniSpect output for a rat brain tissue sample imaged by DESI. Selected ions (m/z 798 (top left), 772 (top right), and 826 (medium left)) are plotted individually (output type "A"), a composite (medium right) and selected ion sum (bottom left) images are also generated (output type "B").
The second analysis method explores the entire dataset based on similarities in spatial ion distributions using nonnegative matrix factorization (NMF)[13, 14]. A specific implementation of NMF called multivariate curve resolution (MCR)[15] has previously been applied to MS datasets [16–20]. NMF models each spectrum as the nonnegative linear combination of source spectra and weight matrices. For MS images, NMF simultaneously models each ion image as the nonnegative linear combination of source images. For example, sources in a chemical sample might pertain to different ions being produced by tissue types or “components” each occupying different but possibly correlated spatial distributions. NMF recovers the non-negative source spectra and spatial distributions by minimizing the difference between the modeled and the observed data. NMF is superior to principal component analysis (PCA) in the sense that it incorporates the constraint that source spectra of components should be non-negative, therefore improving interpretability of the results [19, 21].
Implementation
We developed the web-based version of omniSpect to remotely process the large datasets acquired by MSI experiments. Matlab requires all data to exist in memory in order to execute typical multivariate analyses. This requires 800 MB of RAM for a modest 100 × 100 resolution image with 10,000 m/z bins per pixel. Analyzing these data in Matlab requires temporary copies to be made for intermediate results. Standard implementations of multivariate analyses such as PCA easily exceeds the RAM in a 32-bit computer. As MSI datasets increase their resolution in space as well as m/z, servers need to keep pace to meet these requirements. Currently omniSpect operates on a server with 8 GB of RAM but is moving to a 49 GB RAM server. Creating the image cube and rendering an image typically requires a few minutes of computation but can take as long as 15 minutes for large files (excluding upload time). After the image cube has been created, rendering individual ion images takes tens of seconds, whereas NMF typically requires 30 seconds to two minutes per component.
Details on the implementation of the local (GUI) omniSpect version are provided under Supplementary Information. The local and web-based omniSpect software versions, a GUI for local operation, associated PHP script for web operation, Labview stage control VIs, and typical position/time ASCII files produced by the imaging stages are freely available from the project webpage: http://omnispect.bme.gatech.edu.
Results and Discussion
To illustrate omniSpect’s capabilities, Figure 2 presents results from a DESI MSI experiment showing the distribution of phosphatidylcholines (PCs) in a mouse brain tissue section. Data processing was carried out with omniSpect operating in the typical individual ion mode, producing three ion images (A) and two composite images (B). The spatial distribution of three lipids is illustrated using the ion signals at m/z 772 [PC(32:0)+K]+, 798 [PC(34:1)+K]+ and 826 [PC(36:1)+K]+ (Fig. 2A). The middle right image (Fig. 2B) is a composite constructed with the three selected lipid signals shown in the blue, green and red color channels, clearly delineating the above mentioned regions. The bottom image (Fig. 2B) is a selected ion sum for the three ion signals.
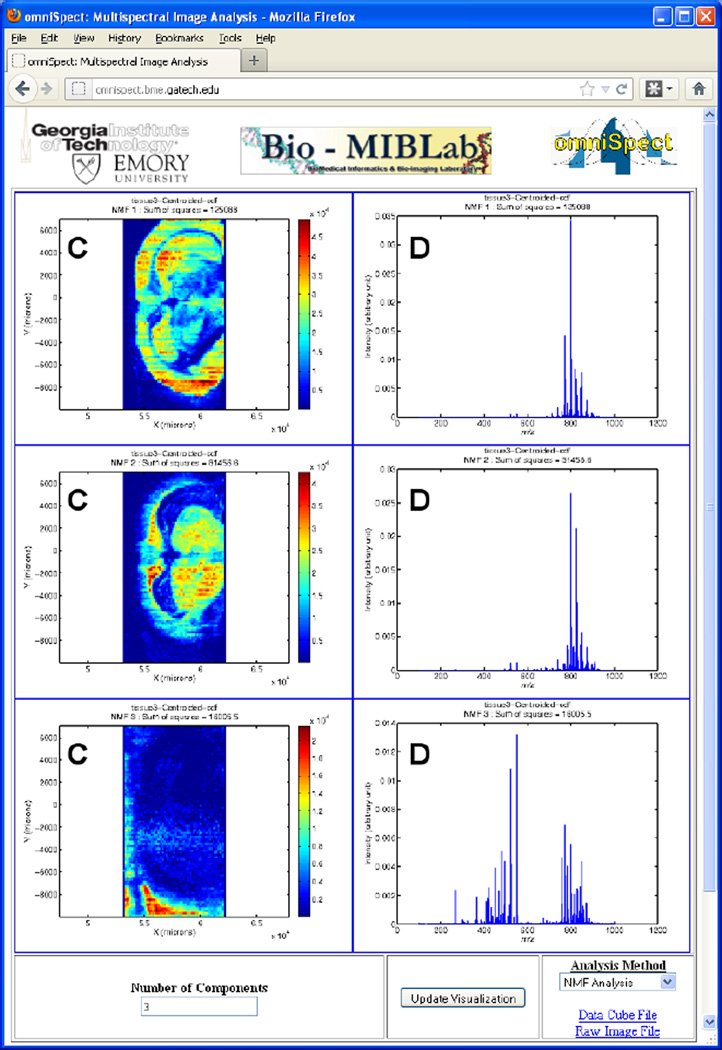
To study the differential spatial co-localization of various lipids, we employed omniSpect’s NMF multivariate analysis routine to decompose the data cube into various NMF components. The three-component NMF analysis results are shown in Figure 3, producing component images (C) and component spectra (D) that describe the image data as being composed of three major contributions. The top and middle panels show images with the expected contributions of white and gray matter brain regions. While the major component (m/z 798) is present in both regions, and therefore in both NMF components, the distribution of other major components (e.g. m/z 772 and 826, for example) differs between the two. The bottom panel shows the background region where substrate contaminants, solvent ions and other low intensity signals with m/z <600 are the main contributors to this NMF component. We have found this type of NMF analysis very useful in visualizing MSI datasets using a small number of representative images and molecular profiles.
Figure 3.
NMF omniSpect output for a rat brain imaged by DESI. Component images (left) are generated based on the number of components selected in the lower left input box. The corresponding spectrum for each component is shown on the right.
Conclusions
OmniSpect provides key analysis capabilities and allows data analysis to be performed remotely using computational resources typically unavailable locally. OmniSpect accepts input from common MSI data formats and transforms time-series mass spectra into an image cube suitable for further analysis. Its open source nature facilitates its modification to suit the specific user’s needs. The spatial distribution of individual ion signals can be visualized and compared using composite images. It also provides the ability of creating a non-negative linear model of the MSI data cube to reveal molecular components appearing in defined spatial distributions. Future work involves the addition of support for other microprobe raster patterns, and image denoising/deblurring routines.
Supplementary Material
Acknowledgments
We acknowledge support from ARRA NSF MRI Instrument Development grant #0923179 to FMF and MDW. This research was also supported by NIH grant U54CA119338, a Georgia Cancer Coalition Distinguished Cancer Scholar Award to Professor MDW, Hewlett Packard, and Microsoft Research. We would also like to thank Al Merrill, Cameron Sullards and Frank Chen for useful suggestions during the development of this software.
Footnotes
Supporting Information Available
References
- 1.Hayasaka T, Goto-Inoue N, Ushijima M, Yao IKK, Yuba-Kubo A, Wakui M, Kajihara S, Matsuura M, Setou M. Development of Imaging Mass Spectrometry (IMS) Dataset Extractor Software, IMS Convolution. Anal. Bioanal. Chem. 2011;401:183–193. doi: 10.1007/s00216-011-4778-9. [DOI] [PubMed] [Google Scholar]
- 2.Jardin-Mathe O, Bonnel D, Franck J, Wisztorski M, Macagno E, Fournier I, Salzet M. Mitics (MALDI Imaging Team Imaging Computing System): A New Open Source Mass Spectrometry Imaging Software. J. Proteomics. 2008;71:332–345. doi: 10.1016/j.jprot.2008.07.004. [DOI] [PubMed] [Google Scholar]
- 3.Klinkert I, McDonnell LA, Luxembourg SL, Altelaar AFM, Amstalden ER, Piersma SR, Heeren RMA. Tools and Strategies for Visualization of Large Image Data Sets in High-Resolution Imaging Mass Spectrometry. Rev. Sci. Instrum. 2007;78:053716. doi: 10.1063/1.2737770. [DOI] [PubMed] [Google Scholar]
- 4.Shimma S, Sugiura Y, Hayasaka T, Zaima N, Matsumoto M, Setou M. Mass Imaging and Identification of Biomolecules with MALDI-QIT-TOF-Based System. Anal. Chem. 2008;80:878–885. doi: 10.1021/ac071301v. [DOI] [PubMed] [Google Scholar]
- 5.Zhang FQ, Hong D. Elastic Net-Based Framework for Imaging Mass Spectrometry Data Biomarker Selection and Classification. Stat. Med. 2011;30:753–768. doi: 10.1002/sim.4147. [DOI] [PubMed] [Google Scholar]
- 6.Zimmerman TA, Debois D, Mazzucchelli G, Bertrand V, De Pauw-Gillet MC, De Pauw E. An Analytical Pipeline for MALDI in-Source Decay Mass Spectrometry Imaging. Anal. Chem. 2011;83:6090–6097. doi: 10.1021/ac201221h. [DOI] [PubMed] [Google Scholar]
- 7.Svatos A. Mass Spectrometric Imaging of Small Molecules. Trends Biotechnol. 2010;28:425–434. doi: 10.1016/j.tibtech.2010.05.005. [DOI] [PubMed] [Google Scholar]
- 8.Bruand J, Alexandrov T, Sistla S, Wisztorski M, Meriaux C, Becker M, Salzet M, Fournier I, Macagno E, Bafna V. AMASS: Algorithm for MSI Analysis by Semi-Supervised Segmentation. J. Proteome Res. 2011;10:4734–4743. doi: 10.1021/pr2005378. [DOI] [PMC free article] [PubMed] [Google Scholar]
- 9.Liu NA, Liu F, Xu B, Gao YB, Li XH, Wei KH, Zhang XM, Yang SC. Establishment of Imaging Mass Spectrometry of Biological Tissues and Its Application on the Proteome Analysis of Microwave Radiated Rat Hippocampus. Chinese J. Anal. Chem. 2008;36:421–425. [Google Scholar]
- 10.Ohlhausen JAT, Keenan MR, Kotula PG, Peebles DE. Multivariate Statistical Analysis of Time-of-Flight Secondary Ion Mass Spectrometry Images Using AXSIA. Appl. Surf. Sci. 2004;231:230–234. [Google Scholar]
- 11.Parry R, Galhena A, Fernandez F, Wang M. Deblurring Molecular Images Using Desorption Electrospray Ionization Mass Spectrometry. IEEE; 2009. pp. 6731–6734. [DOI] [PMC free article] [PubMed] [Google Scholar]
- 12.Galhena AS, Harris GA, Kwasnik M, Fernandez FM. Enhanced Direct Ambient Analysis by Differential Mobility-Filtered Desorption Electrospray Ionization-Mass Spectrometry. Anal. Chem. 2010;82:9159–9163. doi: 10.1021/ac102340h. [DOI] [PubMed] [Google Scholar]
- 13.Lee DD, Seung HS. Learning the Parts of Objects by Non-Negative Matrix Factorization. Nature. 1999;401:788–791. doi: 10.1038/44565. [DOI] [PubMed] [Google Scholar]
- 14.Cichocki A. Nonnegative Matrix and Tensor Factorizations : Applications to Exploratory Multi-Way Data Analysis and Blind Source Separation. Chichester, U.K: John Wiley; 2009. [Google Scholar]
- 15.Tauler R. Multivariate Curve Resolution Applied to Second Order Data. Chemom. Intell. Lab. Syst. 1995;30:133–146. [Google Scholar]
- 16.Lee JLS, Gilmore IS, Seah MP. Quantification and Methodology Issues in Multivariate Analysis of ToF-SIMS Data for Mixed Organic Systems. Surf. Interface Anal. 2008;40:1–14. [Google Scholar]
- 17.Yang L, Shirahata N, Saini G, Zhang F, Pei L, Asplund MC, Kurth DG, Ariga K, Sautter K, Nakanishi T, Smentkowski V, Linford MR. Effect of Surface Free Energy on Pdms Transfer in Microcontact Printing and Its Application to ToF-SIMS to Probe Surface Energies. Langmuir. 2009;25:5674–5683. doi: 10.1021/la804272n. [DOI] [PubMed] [Google Scholar]
- 18.Smentkowski VS, Ostrowski SG, Keenan MR. A Comparison of Multivariate Statistical Analysis Protocols for ToF-SIMS Spectral Images. Surf. Interface Anal. 2009;41:88–96. [Google Scholar]
- 19.Lee JLS, Gilmore IS, Fletcher IW, Seah MP. Multivariate Image Analysis Strategies for ToF-SIMS Images with Topography. Surf. Interface Anal. 2009;41:653–665. [Google Scholar]
- 20.Aoyagi S, Matsuzaki T, Takahashi M, Sakurai Y, Kudo M. Evaluation of Reagent Effect on Skin Using Time-of-Flight Secondary Ion Mass Spectrometry and Multivariate Curve Resolution. Surf. Interface Anal. 2012;44:772–775. [Google Scholar]
- 21.Siy PW, Moffitt RA, Parry RM, Chen Y, Liu Y, Sullards MC, Merrill A, Wang MD. Matrix Factorization Techniques for Analysis of Imaging Mass Spectrometry Data. IEEE; 2008. pp. 1–6. [DOI] [PMC free article] [PubMed] [Google Scholar]
Associated Data
This section collects any data citations, data availability statements, or supplementary materials included in this article.


