Abstract
Recent work has underscored the importance of the microbiome in human health, largely attributing differences in phenotype to differences in the species present across individuals1,2,3,4,5. But mobile genes can confer profoundly different phenotypes on different strains of the same species. Little is known about the function and distribution of mobile genes in the human microbiome, and in particular whether the gene pool is globally homogenous or constrained by human population structure. Here, we investigate this question by comparing the mobile genes found in the microbiomes of 81 metropolitan North Americans with that of 172 agrarian Fiji islanders using a combination of single-cell genomics and metagenomics. We find large differences in mobile gene content between the Fijian and North American microbiomes, with functional variation that mirrors known dietary differences such as the excess of plant-based starch degradation genes. Remarkably, differences are also observed between the mobile gene pools of proximal Fijian villages, even though microbiome composition across villages is similar. Finally, we observe high rates of recombination leading to individual-specific mobile elements, suggesting that the abundance of some genes may reflect environmental selection rather than dispersal limitation. Together, these data support the hypothesis that human activities and behaviors provide selective pressures that shape mobile gene pools, and that acquisition of mobile genes is important to colonizing specific human populations.
Bacteria rapidly evolve and adapt to changing environments by acquiring new genes from other bacteria in their environment. Comparison of reference genomes from the microbiomes of individuals living across the globe has shown that geography does not present a significant barrier to gene flow6. Moreover, there are specific examples of genes that have swept through global populations, such as the antibiotic resistance gene New Delhi metallo-beta-lactamase 17. These observations raise the possibility that the mobile gene pool may be uniform across continents despite large differences in composition of culturally-distinct microbiomes8,9.
In contrast, there is also evidence that gene pools may be population-specific. First, horizontally transferred genes often provide a selective advantage to the host organism6,10,11. For example, seaweed in the traditional Japanese diet is believed to have led to selection for algal polysaccharide degradation genes that are underrepresented in North American populations12. Similarly, dental fillings containing mercury have led to an increase in mercury-resistant genes13. Clinical and agricultural antibiotics have resulted in the propagation of resistance genes in both pathogenic and commensal gut microbes14,15. Other cultural practices may also shape the mobile gene pool including religious practices, travel, food origin and preparation, and beauty and hygiene product usage.
Here, we combine single-cell genomics with metagenomics to survey the mobile gene pool and investigate whether mobile genes are mainly globally distributed or population-specific. We compared the mobile gene pools of 81 participants of the US-based Human Microbiome Project (HMP)16 (Supplemental Table 1) with 172 Fijian islanders comprising the Fiji Community Microbiome Project (FijiCOMP) (Supplemental Table 2). FijiCOMP represents the first terabase-scale metagenomic view of the developing world microbiome.
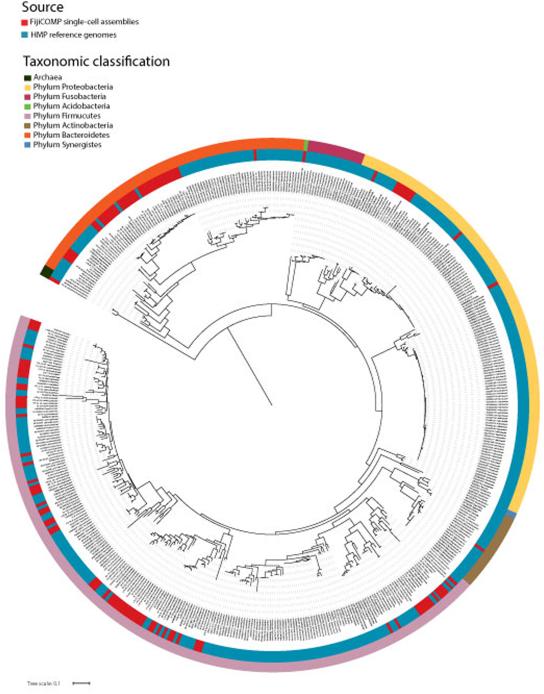
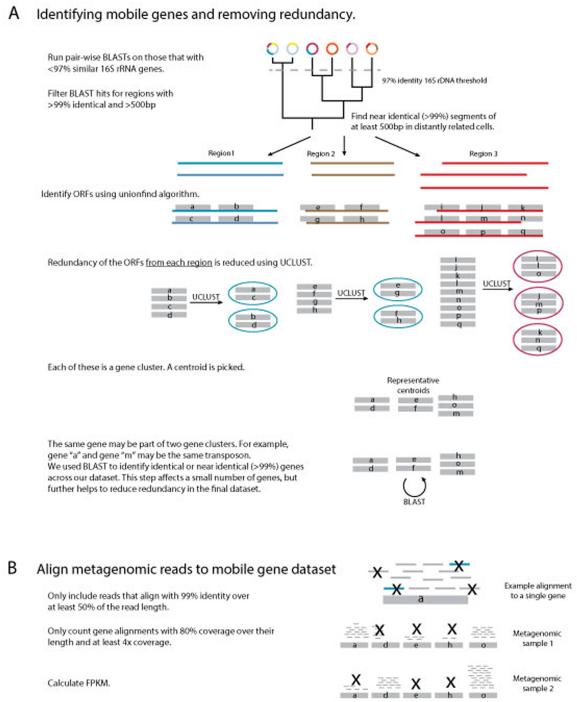
Cataloging the mobile gene pool in a large cohort is difficult using short-read metagenomic sequence and therefore, previous analyses have been constrained to individual species11,17 or specific mobile elements such as plasmids18,19,20 and phage21,22. One reliable method for cataloging mobile genes, including integrated transposons and prophage, depends on assembled genomes and is based on identifying identical or nearly identical genes present in distantly related bacterial hosts6. We used this method to identify 15,585 mobile genes from the 387 HMP gut microbiome reference and draft genomes23 (Supplemental Tables 3 and 5). Similar to complete genomes, even draft single-cell genomes provide enough context to link genes to host, and identify mobile genes. We used 180 single-cell genomes, derived from seven FijiCOMP participants, to identify an additional 22,268 mobile genes (Supplemental Tables 4, 5; Extended Data Figure 1). We then assessed which metagenomic libraries contained reads that mapped to this set of mobile genes to survey their abundance across individuals and populations (Extended Data Figure 2).
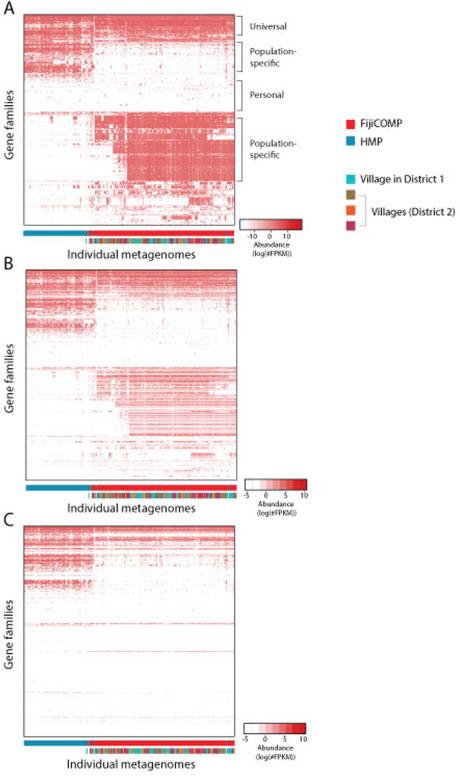
Most mobile genes (62.4%) are present to some extent in both study populations, consistent with the previous finding that horizontal gene transfer is not strongly structured by geography. Surprisingly, however, the abundance of those genes across populations is noticeably distinct (Extended Data Figure 3A) (p<10−6, PERMANOVA based on Bray-Curtis dissimilarity,106 permutations), an observation that holds true even when considering a subset of the most stringently defined mobile genes (Extended Data Figure 3B) (p<10−6, PERMANOVA based on Bray-Curtis dissimilarity,106 permutations). Surveys of organisms endogenous to each population are required to fully observe both mobile gene pools (Extended Data Figure 3C). We reasoned that diet might be a strong factor in differentiating the mobile gene pool across populations because many of the most highly consumed Fijian food items (taro, cassava breadfruit, coconut, and certain seafood) are not widely consumed in the US (Extended Data).
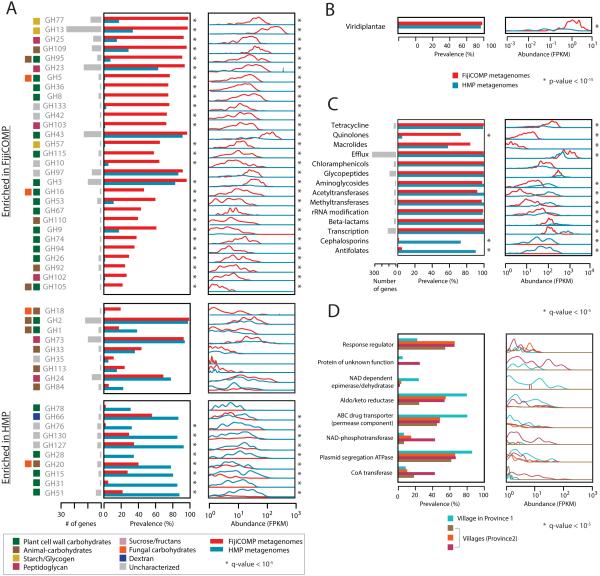
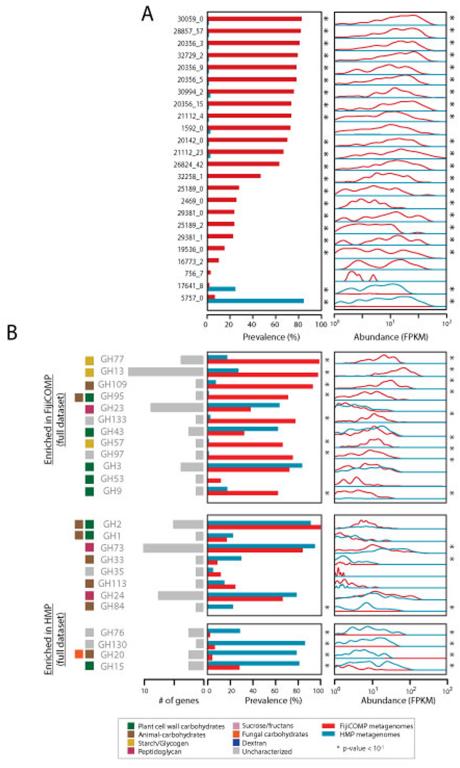
We specifically examined glycoside hydrolases (GHs) as these encompass substrate-specific dietary enzymes. In the Fijian microbiomes, we find a high abundance of mobile GH family GH13 (Figure 1A, Supplemental Table 6, Extended Data Figure 4), which encompasses most of the dietary starch degradation enzymes24. In contrast, GHs that degrade animal- and fungal- sourced glycans exhibited bimodality between the American and Fijian cohorts, which may represent different dependencies on farm animal versus seafood that predominate each of these cultures’ diets. Interestingly, dietary differences between the two cohorts could be confirmed directly from metagenomic sequencing, as the metagenomes of Fijians harbored significantly higher levels of plant matter (p<10−15, Mann-Whitney test; Figure 1B). Thus, differences in diet-related genes, which have also been observed in previous cross-cultural comparisons9,25, may be due in part to differential abundances of mobile genes, rather than genes that can be attributed to specific taxa. There are likely to be additional non-mobile GH genes that differ across populations. GH13-family genes are indeed enriched in the overall microbiomes of the FijiCOMP versus the HMP cohort (Extended Data), although we were unable to determine what fraction of these are mobile. The advantage of looking at mobile genes is that it narrows our focus to specific genes rather than species-level effects that might be more difficult to link directly to environmental factors such as diet.
Figure 1. Enrichment of functional mobile genes is locale-specific.
(A) Prevalence and abundance of all of the annotated mobile glycoside hydrolase (GH) families present in the FijiCOMP (red) and HMP (blue) metagenomic stool samples. Abundances were measured by FPKM to each of the horizontally transferred genes, aggregated according to GH family, and plotted as a function of the density across samples. For each GH family, the number of unique horizontally transferred genes present across the two cohorts is plotted (in gray), as are the sources of their substrates. (B) Prevalence and abundance of plant matter (read alignments to rRNA from the Kingdom Viridiplantae) across the FijiCOMP (red) and HMP (blue) metagenomic stool samples. (C) Prevalence and abundance of annotated mobile antibiotic resistance genes across the FijiCOMP (red) and HMP (blue) metagenomic stool samples. (p-value is based on a Mann-Whitney test). (D) Prevalence and abundance of 8 village-specific mobile genes (of 31 total village-specific genes) across four Fijian villages. q-values (A,B,D) of prevalence comparisons are based on FDR-corrected Fisher’s exact tests; and q-values of abundance comparisons are based on FDR-corrected Mann-Whitney tests.
We next hypothesized that antibiotic resistance genes might differ across populations reflecting the high usage of beta-lactams and quinolones in Fiji (Extended Data). We found that quinolone-resistance was more pervasive in the Fijian cohort than the American cohort (Figure 1C; Supplemental Table 7). Resistance to cephalosporins, which have been introduced relatively recently, was primarily an American phenomenon. Despite limited access to the diversity of antibiotics in Fiji, resistance genes for most classes of antibiotics were found in the Fijian population, consistent with recent findings in other developing world communities26. These results highlight our limited understanding of the forces that drive antibiotic resistance, and could reflect other uses of antibiotics, such as their use in agriculture, or even point to new classes of antibiotic resistance that are not yet characterized15.
Since mobile genes are structured at the global scale, we hypothesized they may be structured at even finer scales of resolution. The FijiCOMP cohort provides a unique opportunity to look at fine-scale structure because it includes individuals living in three villages in the remote Bua province and a fourth village in the agricultural Macuata province. Therefore, we checked whether any genes were specifically associated with one or more villages. Remarkably, we identified many village-associated mobile genes (31 genes varied significantly according to abundance, based on a Mann-Whitney test of gene abundances using FDR with q-value<.05, or prevalence, based on a Fisher’s exact test of village association using FDR with q-value<.05) (Figure 1D, Supplemental Table 8). Village-associated mobile genes include HGT machinery, such as proteins involved in plasmid segregation, as well as proteins that may directly provide a fitness advantage, to their host such as ferredoxins.
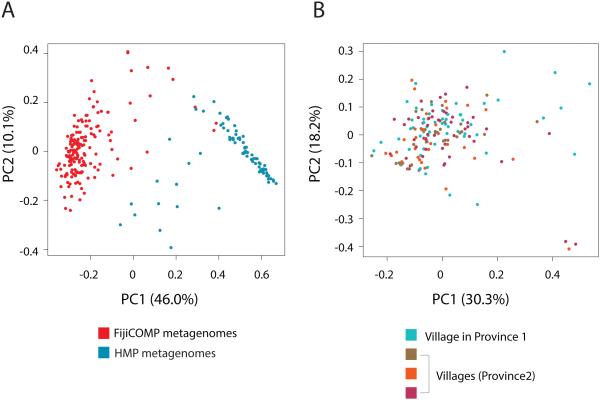
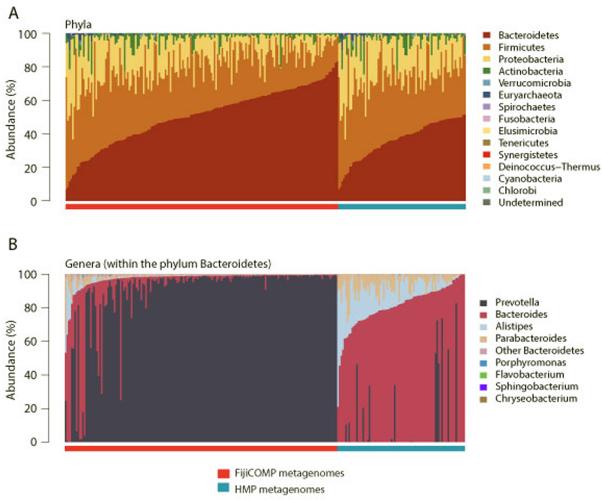
The observation of village-associated mobile genes is surprising because individuals’ microbiomes are more similar across villages (p>.05, PERMANOVA based on Jensen-Shannon divergence, 105 permutations) than countries (p<10−6, PERMANOVA based on Jensen-Shannon divergence, 106 permutations) (Figure 2, Extended Data Figure 5, Supplemental Table 9). Even though the mobile genes in our dataset are defined by their occurrence in multiple phylogenetic backgrounds, gene exchange is known to be more frequent among closely related species6. We therefore looked to see whether the village-associated genes were found to be associated with species that were also partitioned unevenly across villages. For 6 of the 31 village-associated genes, we found a correlation with one of the 10 village-associated species, though 5 of these 6 genes were also correlated with other non-village-associated species (see Methods). Overall, our findings suggest that these mobile genes are not restrained by their host genomes.
Figure 2. Microbiome composition across global and local populations.
(A) Principal coordinates analysis of the Jenson-Shannon divergence between species compositions of the FijiCOMP (red) and HMP (blue) metagenomic samples. (B) Principal coordinates analysis of the Jenson-Shannon divergence between species compositions in the FijiCOMP metagenomic samples, according to their village membership.
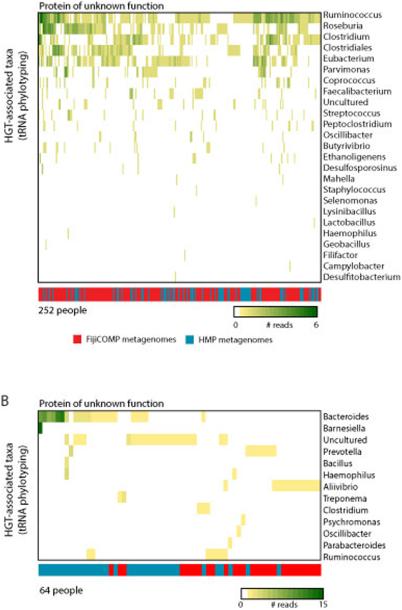
This finding prompted us to investigate the extent to which species composition determines mobile gene pool composition. First, we tested whether mobile genes originally identified in Bacteroides genomes or Prevotella genomes were more common in the individuals’ metagenomes dominated by the same species. Surprisingly, we did not find a significant association between the dominant taxon in an individual and their likelihood of carrying mobile genes of similar origin. Next, we looked to identify the taxonomy of bacteria hosting specific mobile elements by examining paired reads that span junctions between mobile genes integrated next to evolutionarily conserved tRNAs. Out of 838 mobile genes found adjacent to tRNAs, 65 are found near tRNAs from more than one genera, with the most promiscuous occurring next to tRNAs from 25 different genera (Supplemental Table 10, examples shown in Extended Data Figure 6). Even within a single individual, these genes are not tied to the dominant bacteria present within that individual’s microbiome, and often span multiple genera, including those in both Prevotellaceae and Bacteroidaceae families. Thus, horizontal gene transfer is likely driven by forces independent of species community composition.
The high rates of recombination observed among mobile genes support the idea that mobile genes are even less dispersal-limited than their host genomes. Following the logic of the Bass-Becking hypothesis that “everything is everywhere, but the environment selects”, we might infer that environmental selection rather than dispersal drives gene abundance differences across populations. Extending this logic from species to genes, however, is not straightforward because genes can change in abundance as a result of genetic “hitchhiking” on mobile elements under selection at a different locus27. We reasoned that if recombination rates are sufficiently high, then genes should be present in many contexts. On the other hand, if genes abundances are driven by selection on larger mobile elements, then genes should appear in a limited number of contexts.
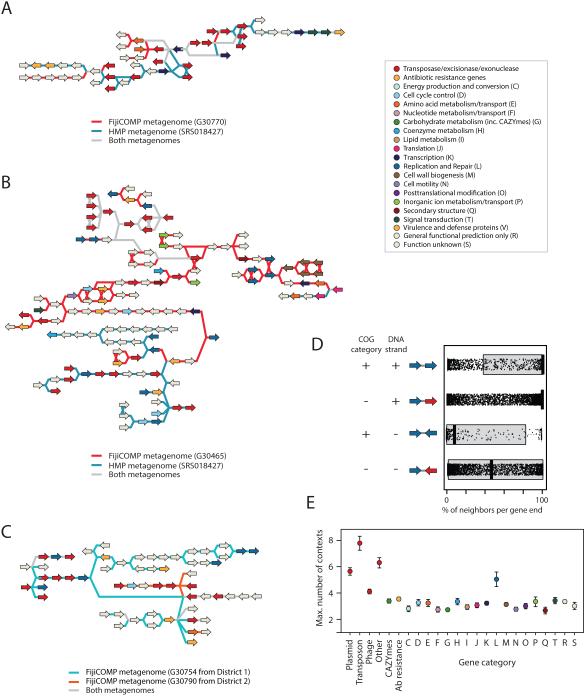
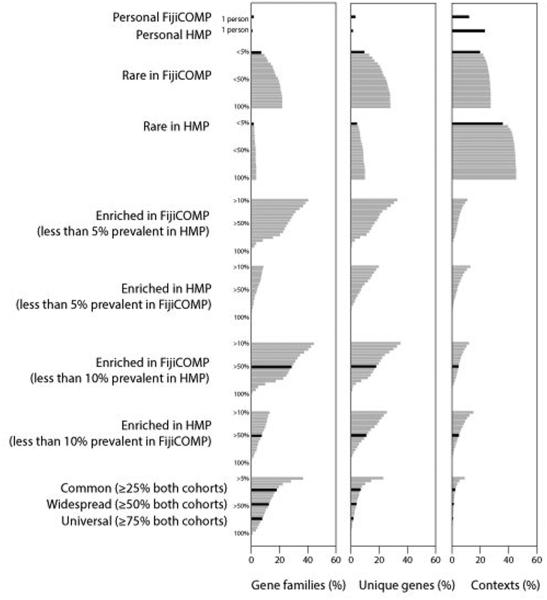
To investigate the genomic context of our mobile genes, we used the alignment and orientation of paired-end metagenomic reads to assemble short contigs encompassing each mobile gene (Figure 3A-C). As expected, we found that recombination is limited, although not absent, within operons (as defined by adjacent genes in the same orientation and of the same functional category) (Figure 3D), and that horizontal transfer machinery, such as phage-, plasmid- or transposon-specific genes have even higher levels of recombination (Figure 3E). Surprisingly, however, despite the high prevalence of genes and broader gene functions, we found that 34.9% of the gene contexts, defined as the set of unique combinations between adjacent genes that were observed, were specific to individuals and very few of these gene contexts were conserved across populations (Figure 4, Extended Data Figure 7).
Figure 3. Personal mobile genetic element architecture displays high variation due to recombination.
(A-C) Examples showing comparisons of assembled mobile genetic elements between the microbiomes of individuals from different continents (A,B) or different villages (C). Gene linkages between mobile genes are colored according to the individual they are present in, with gray depicting linkages present in both individuals’ microbiomes. Genes are colored according to their broad COG category. (D) For each mobile gene end, the median and quartile proportions of neighbors (as determined by the proportion of metagenomic read pairs) is plotted according to whether the adjacent gene is in broad functional concordance (determined by COG category) and whether they are situated on the same DNA strand, denoting whether they are likely to comprise the same operon. (E) The average number of gene families connected to by mobile genes of each type of functional category, as determined by paired read linkage between mobile genes. Bars show standard error of the mean.
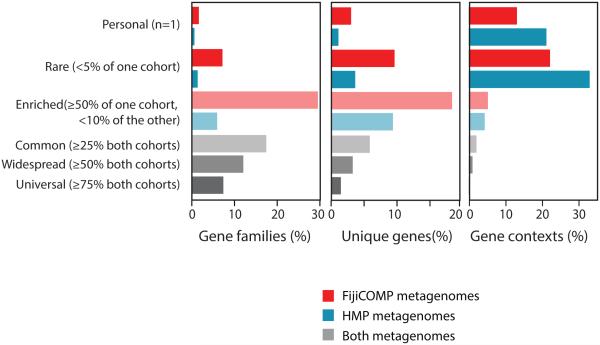
Figure 4. Genes are widespread across global populations, though specific mobile genetic element architecture is not.
The percentages of gene families (determined by functional annotations) (left), identical genes (middle), and gene contexts, defined by unique linkages between genes (right) are plotted according to their prevalence across the FijiCOMP and HMP populations. Gene families, genes and gene contexts are referred to as “Personal” (present in a single individual), “Rare” (in <5% of one population and absent in the other); “Enriched” (in >50% of one population and <10% of the other); “Common” (in ≥25% of both populations); “Widespread” (in ≥50% of both populations); and “Universal” (in ≥75% of both populations). Color reflects association with one or both populations.
Together, high recombination rates and population-specificity support the notion that environmental selection on individual genes, rather than dispersal limitation alone, plays a key role in driving gene abundances. The “everything is everywhere” concept is reinforced for mobile genes by the observation that the majority of genes are found in both the HMP and FijiCOMP populations (Figure 4). Even among the village-associated genes, all but five are found in all of the villages. Dispersal may play a role in shaping the distribution of a small, albeit abundant, subset of genes that are restricted to one population (i.e. gene families (GH67, GH28 and GH110, Figure 1A) or subsets of villages (Figure 1E)). Nevertheless, environmental selection is underscored by the impact of diet on gene abundance. In fact, only one of the universal genes, defined as those present in over 75% of both populations, was annotated as carbohydrate-metabolizing, despite these genes being significantly enriched in population-specific genes, defined as those present in over 50% of one population and in less than 10% of the other (p<10−5, Pearson’s χ2 test).
How selection and dispersal affect gene exchange within physically proximal environments, i.e. within a single individual’s body sites, is still an open question6. On one hand, differences in composition and ecology may result in distinct mobile gene pools at various body sites6,28. On the other hand, the direct route between oral and gut communities should facilitate transmission of mobile elements and systemic selective pressures, such as those imposed by orally-administered antibiotics, may homogenize personal gene pools. Our analysis of saliva samples derived from FijiCOMP participants shows that there is little overlap, as only 0.94% of the genes represented in the gut were detectable in any of the saliva samples. For any particular gene, there was neither correlation between its presence nor its abundance across stool and saliva samples of the same individual. These data support the hypothesis that shared selective pressures and common ecologies structure horizontal transfer though they do not rule out that physical proximity plays a role.
In addition to presenting a new data set describing the developing world microbiome, we have presented a new approach to identify environmentally relevant genes. Previous shotgun metagenome approaches have focused on the abundance of a gene as a proxy for its importance. This will identify important genes but also has the potential to identify many spurious genes because a single highly abundant species can carry many genes that are not specifically relevant to the environment it occupies. Instead, we look for abundant genes that are present in multiple species, using horizontal gene transfer as an additional filter for gene importance. Our approach is subject to several important caveats. First, our sensitivity to detect mobile genes is low, and there are likely to be many more genes transferred across species than we can detect. Second, even though each of the mobile genes within our data set exists in more than one species, some of those genes may be primarily associated with a single taxon. This is especially true if a single taxon is much more abundant than the other species that carry the gene.
Despite these caveats, we found that the human-associated mobile gene pool differs across populations and carries gene functions likely to be associated with cultural practices, and provides functional insights not possible based on surveys of phylogenetic markers, such as the 16S rRNA gene, alone. These insights have the potential to improve public health at multiple levels. For example, better understanding the distribution of antibiotic resistance genes across different populations’ microbiomes could inform antibiotic stewardship on a regional level, by avoiding the use of antibiotics where resistance is highest. Across individuals, we showed that the mobile genetic elements are highly diverse, raising the possibility that they may vary within bacterial lineages in an individual over short time spans. If this is true, then diet and drugs could modify the functions of the microbiome, even if the long-term species composition is stable29,30. To assess whether changes to cultural practices will impact human health via mobile genetic elements, future studies should test the speed at which selective pressures alter mobile gene frequencies within single individuals and larger populations.
Methods
Overview of the Fiji Community Microbiome Project
The Fiji Community Microbiome Project was developed to characterize the role of human-associated bacteria in health and disease from a developing world population collected in the Fiji Islands. The study sought to understand the transmission of microbiome components across individuals and their environmental surroundings. The goal was to be as comprehensive as possible in the study villages. The study included 300 individuals, regardless of health status, each of whom chose to provide any or all of stool, saliva or skin swab samples. To date, this is one of the largest cohorts on which metagenomic sequencing was performed. Surveys were performed by visiting all households within each community. Individuals under the age of 5 were excluded, as were individuals who were deemed mentally incapable of providing informed consent. Informed consent was received from all participants and parental consent was additionally required for all minors. IRB approval was received from Institutional Review Boards at Columbia University, the Massachusetts Institute of Technology and the Broad Institute and ethics approvals were received from the Research Ethics Review Committees at the Fiji National University and the Ministry of Health in the Fiji Islands. Whole genome metagenomic shotgun sequencing was performed on individuals’ stool and saliva samples, in addition to environmental samples from individuals’ proximal environments. More information and links to the dataset can be found at www.fijicomp.org.
Samples used in this study
Saliva samples were collected in 20% glycerol and frozen within 30 minutes of collection. Stool samples fated for metagenomic sequencing were collected within 30 minutes of voiding, stored in RNALater (QIAGEN) and frozen at 80ºC. Stool samples used for retrieval of intact cells for single-cell analysis were collected within 30 minutes of voiding, stored in 20% glycerol and PBS, and frozen at −80ºC. Seven individuals’ samples were selected from the FijiCOMP cohort for isolation of single-cell genomes (Supplemental Table 2). Samples destined for single-cell isolation were prepared using two different single-cell amplification approaches: one based on sorting individual cells and a second based on capturing individual cells within a hydrogel.
Flow-sorted single-cell amplification
For the sorting method, thawed cells were resuspended in PBS-Glycerol (20%) to a concentration of 106 cells/ml. Samples were serially filtered through 30μl and 11μl membranes then briefly sonicated (20 seconds) and diluted 50-100-fold. They were sorted into individual wells of a 384-well plate containing 0.5μl PBS. Single cells then underwent alkaline lysis for 15 minutes at room temperature, after which the solution was neutralized. Genomes were then amplified using Multiple Displacement Amplification31 for 16 hours at 30ºC using high-purity Φ29 polymerase expressed in Escherichia coli strain BL21_DE3. To initially identify amplified cells, the V68 region of the 16S rDNA locus was amplified using 1:10 dilution of the MDA product and universal 16S primers 926F and 1392R and then Sanger sequenced. Taxonomic classification was performed using the RDP naïve Bayesian rRNA classifier (v. 2.6)32. We chose cells from this group to sequence that maximized the likelihood of observing lateral transfer between cells by accounting for the previously observed rates of HGT between organisms of a specified phylogenetic distance (the percent identity between pairs of 16S sequences were used as a proxy)6.
MDA reactions were sonicated to shear large fragments of DNA. Samples then underwent end-repair using the NEB Quick Blunting Kit and purified using a QIAGEN MinElute column. Illumina adapters containing 5-basepair barcodes were ligated to the genomic amplicon using the NEB Quick Ligation Kit. The double-stranded adapters were modified using 5’ and 3’-amino modified bases at one end to prevent self-ligation. Size selection was then performed using SPRI beads. Libraries then underwent nick translation using NEB Bst polymerase. Libraries were each amplified using Phusion Polymerase (New England Biolabs). The final pooled library was then gel purified to retain fragments of sizes 250-600bp and sequenced on an Illumina HiSeq. The average size of the final library constructs was 397bp. The total sequencing depth was 310 million reads. Single-cell libraries were barcoded and sequenced. We took several precautions to ensure the fidelity of our final single-cell libraries. Barcodes used in library preparation were designed so that each barcode would require 2 base-pair shifts to mimic any other barcode in the study; that no indel would result in a different barcode; and that barcodes contained no more than 2 consecutive identical basepairs. Only reads containing exact barcode matches were incorporated into libraries.
Hydrogel-based single-cell amplification
For the hydrogel method, 10µl of thawed cells were resuspended in 500µl PBST (0.1%). Samples were sonicated for 20 seconds and first filtered through a 35μm Nylon mesh, followed by a 5μm membrane (Pall Corp.) with a 500µl PBST wash. Samples were further diluted 500-2000-fold in PBST to reach the final concentration of ~30 cells/µl. The diluted cell samples (2µl) then underwent alkaline lysis for 15 minutes at room temperature, after which the solution was neutralized. Hydrogel monomer mix (1.3mg 4 Arm PEG Acrylate and 0.9mg SH-PEG-SH) and MDA master mix, including Φ29 buffer (NEB), 50 μM Random Hexamers with two phosphorothioate bonds at 3’ terminus, 2.5 % DMSO, 0.4 mM dNTP, 0.5 mg/mL BSA, 500nM SYTOX Orange (Invitrogen) and 1µl REPLI-g sc Polymerase (Qiagen), were added to the side wall of the tube that contains the lysed cell sample. 25µl of each microbial concentration was added into a frame seal chamber, the sealed chamber was incubated at 30ºC for 12 hours. Fluorescent DNA clusters were imaged and selected for hydrogel cluster retrieval. Approximately 0.24µL of hydrogel and 10pg of DNA was captured in each cluster. This was dissolved and denatured in 1 µL of 400 mM KOH with 0.1mM EDTA and 0.1 M DTT at 72°C for 10 min before neutralization. The neutralized product underwent a second MDA reaction (for 10 hours) within a new hydrogel. The gel was then denatured and neutralized.
MDA products were purified and quantified using the Quant-iT HS assay (Thermo Fisher Scientific) and normalized to 5ng/µL. Tagmentation reactions (Nextera) were carried out on 10ng of purified DNA, and were followed by a SPRI cleanup. Unique PCR library barcoding using Index primers N7 and S5 (Illumina) was performed, followed with SPRI twice using equal volumes of beads to DNA. Libraries of were sequenced to a depth of ~1.5M 125-bp paired-end reads on Illumina’s Hiseq 2500. The Broad Institute’s Internal Genomics Platform’s custom designed paired-end library barcodes were used. Final library size was 200-300bp.
Assembly of single-cell genomes
Single genome amplicons were quality filtered (Phred score ≥ 3), and filtered for reads that were a less than 45bp and for those that aligned with the human genome, the P. aeruginosa PAO1 genome (a laboratory contaminant) and the E. coli BL21_DE3 genome (from which the Φ29 polymerase used in the MDA reaction was expressed and purified) using BMTagger. A small number of adapter sequences were found in the raw data due to small inserts or primer-dimers. These adapter sequences (30-61bp in length) were easily identified using BLASTn and were removed prior to analysis. Amplicons were then assembled into genomes using either CLC Assembly Cell (v. 4.2), for the flow-sorted cells, or SPADES33 (with the --careful flag) (v.3.6.0) for the hydrogel-captured cells. We retained assembled contigs that were at least 500bp and resultant genomes where at least 100kb could be assembled.
Filtering single-cell assemblies
To further vet the quality and purity of our assemblies, we used BLASTp to assign taxonomies to a set of 31 predetermined core genes that are both phylogenetically conserved and single copy in almost all genomes34. Although we could not identify the full set of 31 core genes in any of the assemblies, we removed several cells in which the core genes reflected mixed taxonomies. Additional validations of the single cell assemblies included quantifying the levels of contamination using CheckM35. We retained cells with less than 10% putative contamination. We used RNAMMER36 to identify 16S sequences present in the assembled genome. We discarded a small number of cells that had multiple 16S sequences or those in which the RNAMMER-identified 16S rRNA sequence conflicted with the Sanger-sequenced 16S rRNA V68 region. Our final dataset included 196 single cell assemblies (Supplemental Table 4).
Identification of horizontally transferred genes between divergent genomes
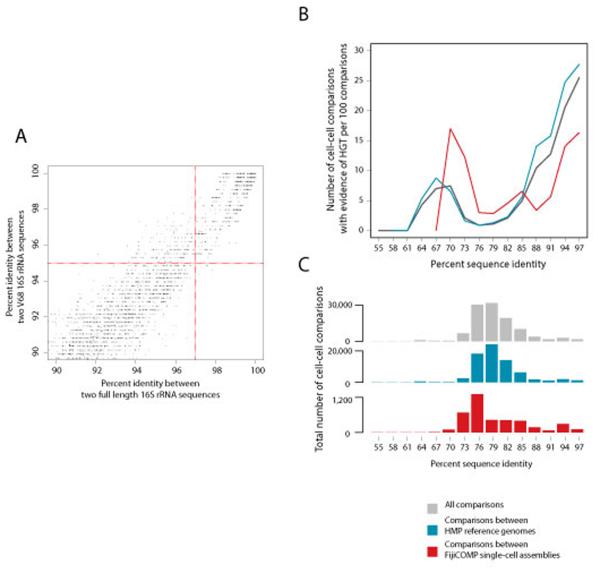
To identify horizontally transferred regions, we used a previously benchmarked method6. All assembled and reference genomes were compared in a pairwise manner using default in BLAST+ (v. 2.2.24). Recent DNA transfers are defined as the presence of near-identical DNA fragments (99% percent identity or greater) with a length of 500 basepairs or greater in two distantly related genomes. Note that the identification of identical DNA does not imply a direct transfer between two cells. We find that approximately two-thirds of the identified transferred regions contain at least one single nucleotide polymorphism, suggesting that could not have been the result of contamination. We restricted our analysis to comparisons between genomes whose full length 16S distance would be at least 3% dissimilar. This cutoff allowed us to distinguish between signatures of vertical inheritance and horizontal transfer, as 97% divergence at the 16S corresponds with roughly 75 million years of evolution, during which time, well over 100 mutations would have accumulated per 500bp. By conservatively defining horizontally transferred regions as those with such high nucleotide identity, we are likely missing larger horizontally transferred regions that have undergone homologous recombination and rearrangements16. For the HMP reference genomes, most of which are draft status, the 16S rRNA sequences were identified using RNAMMER. We included only those HMP reference genomes that had less than 10% contamination as identified by CheckM and in which the annotated 16S region spanned a minimum of 200bp of the V68 region (this excluded 79 genomes), resulting in a final set of 387 genomes (Supplemental Table 3). In 78 of the FijiCOMP single-cell assembles, RNAMMER identified full length 16S sequences. Multiple sequence alignments were performed using the RDP (v.11) Infernal aligner (http://rdp.cme.msu.edu/)32,37, which accounts for secondary structure in the 16S. Percent identity was either calculated on the full length 16S across sites that were present in 95% of cells or in a trimmed alignment of the V68 region, accounting for sites that were conserved in at least 95% of cells. By comparing percent identity cutoffs of the hypervariable V68 region with the full length 16S gene, we determined that a 95% percent identity cutoff within the V68 region was an equivalent cutoff to 97% identity between full length 16S genes (Extended Data Figure 8A). Cells that have unusual or multiple divergent 16S sequences can cause highly conserved (e.g. ribosomal) genes to appear horizontally acquired. Although some ribosomal genes may be transferred, especially across related species, because they confer antibiotic resistance, to minimize the contribution of closely-related strains, we excluded all HGT events inferred between a pair of cells for which any ribosomal gene was inferred to be transferred. HGT was observed to occur less frequently between cell pairs as the phylogenetic distance between them increased (Extended Data Figure 8B), as previously reported in Smillie et al., (2011).
To illustrate the diversity of genomes used in our study and their sources, a maximum likelihood-based phylogenetic tree was constructed with FastTree2 (v.2.1.3)38 (GTR nucleotide substitution model) using a multiple sequence alignment generated by RDP of the full length 16S sequences where available and the 16S V68 region those were full length sequences could not be identified. 70 of the hydrogel-captured single-cell genomes lacked 16S rRNA sequences and were therefore not included in this tree. The tree was rooted using Archeal taxa as the outgroup, although placement of the root within Bacteria is unsupported.
Creating a non-redundant mobile gene set
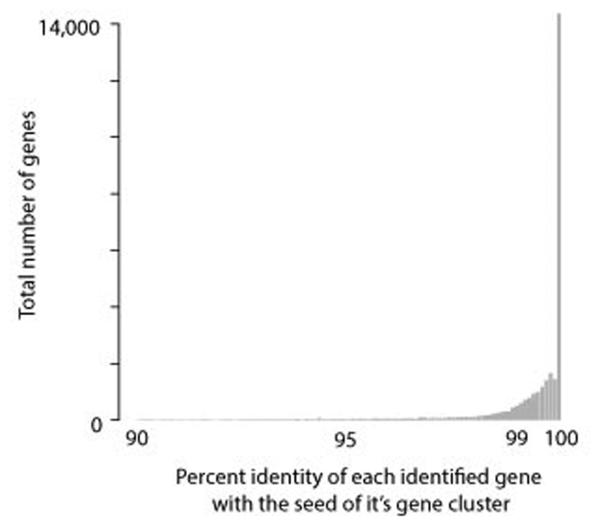
In order to align reads to genes to attain relative gene abundances, we built a non-redundant gene dataset (Extended Data Figure 2). After pair-wise BLASTs between genomes (Step1), we clustered horizontally transferred regions using single-linkage clustering (Step2), identifying all with partial or full overlapping regions. Next, we identified ORFs within each contig using Prodigal (v2.5)39 (Step3). We included ORFs that overlapped at a minimum of 50% with a horizontally transferred region. This cutoff avoids false positive genes that overlap minimally with horizontally transferred regions, but allows for the inclusion of genes that may have been truncated due to highly fragmented draft genomes. We then clustered ORFs from each group of overlapping transferred regions into non-redundant sets using UCLUST40 (v.1.5.579), with a 90% identity cutoff (Step4). The vast majority of genes were within 99-100% identity with the gene chosen for read alignment (i.e. the centroid) (Extended Data Figure 9). No gene with more than 10% ambiguous base pairs was chosen for read alignment. Since non-overlapping horizontally transferred regions may contain identical genes, we performed an additional final BLASTn search between genes to further reduce redundancy, although this step resulted in the removal of a relatively small number of genes (Step5).
Functional annotation of horizontally transferred genes
We relied on several methods for functional annotation. Details on the functional annotation of each gene are provided in the Extended Data. We queried sequences using BLASTp against the Kyoto Encyclopedia of Genes and Genomes (KEGG)41, using BLASTp to attain their KO classifications (e-value 10−5, percent identity 30%); against the Clusters of Orthologous Groups (COG) database using rpsBLAST (e-value 10−5, percent identity=30%); and the TIGRFAM (v12.0) and PFAM (v.26) databases using HMMER (v.3.0) (e-value 10−4, score 22). KO numbers were mapped directly back to COG; and TIGRFAM roles that could not be assigned COGs retained the TIGRFAM designation. For each gene cluster, functional annotations were aggregated by retaining annotations to any gene within the cluster first according to COG classification, followed by KEGG, TIGRFAM and finally PFAM. We also assigned metabolic functions using the Automated Carbohydrate-Active Enzyme Annotation (http://csbl.bmb.uga.edu/dbCAN/)42 (v.4.0), which employs an HMM-based search protocol. These were then assigned substrate categories43. To annotate antibiotics resistance genes, we used the ResFam44 core genes database, which uses HMMs. Still, 32.8% of our HGT gene set could not be annotated by any of these means. To annotate the type of mobile genetic element specifically, we performed a keyword search amid the gene descriptions as follows:
Transposon: transpos*; insertion; resolv*; Tra[A-Z]; Tra[0-9]; IS[0-9]; "conjugate transposon"
Plasmid: resolv*; relax*; conjug*; trb; mob*; plasmid; “type IV”; toxin; "chromosome partitioning"; "chromosome segregation”
Phage: capsid; phage; tail; head; “tape measure”; antitermination
Other HGT machinery: integrase; excision*; exonuclease; recomb; toxin; CRISPR; restrict*; resolv*; topoisomerase; "reverse transcrip"
Carbohydrate-active enzymes and related proteins: Genes present in the CAZY database; glycosyltransferase; "glycoside hydrolase; xylan; monooxygenase; rhamnos*; cellulose; sialidase; *ose; acetylglucosaminidase; cellobiose; galact*; fructose; aldose; starch; mannose; mannan*; glucan; lyase; glycosyltransferase; glycosidase; pectin; SusD; SusC; fructokinase; galacto*; arabino*;
Proteins conferring antibiotic resistance: Genes present in the ARDB; multidrug; "azole resistance"; antibiotic resistance"; TetR; "; "tetracycline resistance"; VanZ; betalactam*; beta-lactam; antimicrob*; lantibio*
DNA extraction of FijiCOMP samples and sequencing
DNA from saliva samples was extracted using the Promega Maxwell Buccal Swab LEV DNA Purification Kit. Stool samples were collected within 24 hours of saliva sample collection. DNA from stool samples was extracted using the MoBio Laboratories PowerSoil 96 Well DNA Isolation Kit with an added proteinase K step to aid in lysis (100 µg/ml final concentration at 55ºC for 20 minutes).
Metagenomic samples were barcoded, multiplexed and sequenced across several lanes on the Illumina HiSeq 2000 platform (101bp paired-end reads), in excess of 8Gb of sequence per stool sample and 10Gb per saliva sample.
Alignments of metagenomic data
The metagenomic samples analyzed include 81 stool from the Human Microbiome Project (Supplemental Table 1) and 172 stool samples and 134 saliva samples from the FijiCOMP study (Supplemental Table 2). Raw metagenomic sequences from the FijiCOMP study were preprocessed in a manner equivalent as for the HMP metagenomic samples15: they were initially filtered for quality (Phred score ≥ 3), minimum length (60bp), and minimizing reads originating in human genomes, using BMTagger (ftp://ftp.ncbi.nlm.nih.gov/pub/agarwala/bmtagger/ NCBI/NLM/NIH; 07 March 2011, Version 3.101). Sequencing depths of the final sample set were comparable between the FijiCOMP and HMP cohorts.
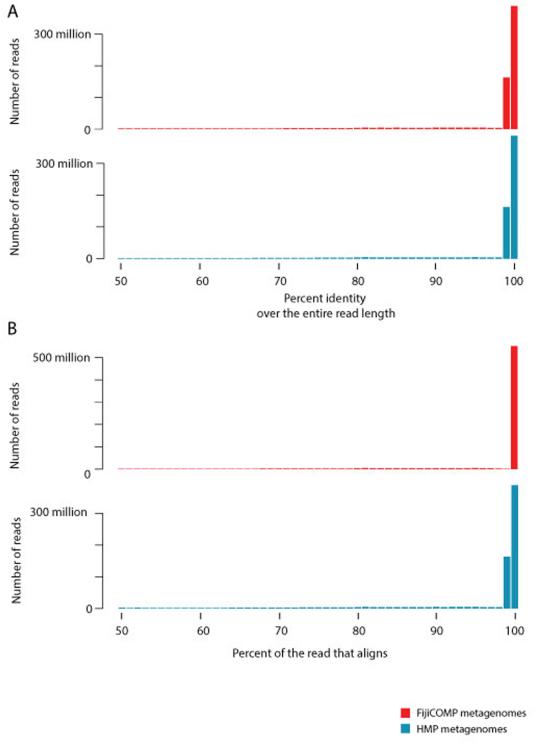
Reads were aligned to the non-redundant set of mobile genes (described above) using the BWA (v 0.7.12-r1039)45 mem algorithm. A read pair is considered mapping when at least one read of the pair is mapped to the reference gene with 99% or greater sequence identity and aligned with at least half of the read length so as to avoid edge effects. In the vast majority of reads, the entirety of the read aligned with 99% or greater identity (Extended Data Figure 10). After alignment, we considered only those genes which were had at least 80% coverage across the length of the gene, and had a median alignment depth of at least 4 reads/basepair. In order to compare between samples that had varying read depth and across genes of varying length, we used a measure of Fragments per kilobase per million (FPKM), where each fragment is defined as a read pair. Alignments of the stool samples were observed for 88.3% of the 10,461 identified unique genes.
We did not consider minimum or maximum gene lengths for inclusion in our dataset. The minimum gene length observed is 60bp and the median length for all of the genes is 654bp. Although genes of different lengths may be expected to be able to recruit metagenomic reads and meet the gene coverage criteria, gene length was not significantly correlated with prevalence, median or maximum abundance.
Some of the mobile genes are likely duplicated trans-acting core genes that confer antibiotic resistance, such tRNA synthetases46,47,48,49. FPKM values for these genes will be artificially inflated due to the false-positive recruitment of reads matching core genes. We presume that this component is small and given that they may be able to recruit reads from various genomes, their distribution across populations may serve to minimize differences between populations.
Assessing GH13 prevalence and abundance in entire metagenome
To determine whether any GH13-family genes, including those not identified here as mobile, were enriched in the FijiCOMP cohort, we aligned translated reads from each of the FijiCOMP and HMP metagenomic samples using PAUDA (v.1.0.1) to a database containing 16,244 GH13-family protein sequences annotated as such by the Carbohydrate-Active enZYmes Database (www.cazy.org) as well as 48 GH13-family protein sequences identified as mobile using the FijiCOMP single-cell and HMP assemblies. This database amounted to 11,236 unique protein-coding genes, of which 38 were those identified as horizontally transferred. We then calculated coverage RPKMs (reads per kilobase mapped) for each of the genes in each of the samples and analyzed 3,770 unique proteins with RPKM values greater than 100RPKM. The distribution of GH13 genes differed between populations (p<10−5, PERMANOVA test of Jensen-Shannon divergences, 104 permutations). 351 and 63 of the GH13 family genes were more prevalent in the FijiCOMP and HMP cohorts, respectively (q-value <.001 after FDR correction for Fisher’s exact test). 347 genes (including 29 of the GH13 horizontally transferred genes) are enriched (q-values <.001 after FDR correction of Mann-Whitney tests) in the FijiCOMP dataset, compared with only 118 (including 2 of the GH13 horizontally transferred genes) enriched in the HMP dataset. We cannot conclusively determine whether the GH13 genes not identified in this study as horizontally transferred are part of the core or flexible genome.
Vector contamination
Cloning vectors may have been used in the sequencing of HMP reference and draft assemblies. (Cloning vectors were not used in the sequencing of the FijiCOMP single-cell genomes and adapters were removed prior to assembly.) Since it is sometimes the case that cloning vector sequence is retained in the assembly, these assemblies were screened for vector contamination against the UniVec database (http://www.ncbi.nlm.nih.gov/tools/vecscreen/univec/), using suggested parameters. Putative contamination was observed in all 387 of the HMP reference genomes, although only 102 cells had regions of putative contamination of at least 500bp, which would have affected the method used to identify HGT events (Supplemental Table 3). The metagenomic libraries were not created using cloning vectors and therefore it may be possible to therefore distinguish between those that are contamination (i.e. those that failed to recruit reads) and those that are present. Only 102 of genes linked to possible vector contamination failed to recruit reads.
tRNA analysis
Metagenomic alignments were also used to determine which mobile genes were adjacent to tRNA genes. We could then examine mobile elements that had integrated next to tRNAs to determine the taxonomy of the bacterial host. tRNAs have stable phylogenies that can be used for phylotyping50. Metagenomic alignments were filtered for paired reads that had only one read-pair aligning to a horizontally transferred gene. tRNA genes were identified using the program ARAGORN51. Taxonomies of the tRNA genes were ascertained through BLASTn searches against NT, requiring an alignment of 85 nucleotides at 85% identity. We identified 838 mobile genes adjacent to tRNA genes. Of these, 194 had multiple bacterial hosts, multiple isoacceptors, or multiple tRNA genes. 394 of the genes adjacent to tRNA genes had at least one bacterial host that could be taxonomically identified. Plots reflect the number of reads observed. 72.7% of genes adjacent to tRNAs that had annotatable functions were genes involved in the process of horizontal gene transfer (phage, transposon, plasmid, etc.).
Defining high confidence mobile genes
We also performed our analysis on the mobile gene pools in Fijian and American metagenomes on a subset of higher confidence mobile genes representing known HGT machinery genes and/or genes on scaffolds that have additional independent support for their phylogenetic placement. BLASTn searches were performed for each of the 1,662 FijiCOMP single-cell contigs containing a mobile gene against closely related organisms where available, resulting in 634 contigs that had additional phylogenetic support that could be compared. Additionally, phylogenetic placement was attained by examining tRNA genes on paired-reads aligning to the mobile gene set. This higher confidence set includes 6,187 unique genes (59.1% of the total mobile gene dataset). Even with this smaller subset of high confidence genes, distinct functional gene pools can be observed between the HMP and FijiCOMP cohorts (Extended Data Figures 3 and 4).
Statistical analysis of gene/function presence and abundance across samples
FPKMs associated with the same protein family were summed prior to analysis. To assess which genes were enriched in each population, the FPKMs of each gene were compared according to country/village using FDR-adjusted Mann-Whitney tests. Comparisons of prevalence were tested using Fisher’s exact tests. All analyses were performed in R (v.3.1.0).
Identifying linkage between pairs of horizontally transferred genes
Metagenomic alignments were filtered for paired reads that matched two distinct genes in the mobile gene set. The HMP and FijiCOMP metagenomic libraries were both made with an average insert size of 180bp. We required both genes to have 99% sequence identity or greater to their respective genes. We retained only paired reads that had information on alignment and orientation. Analysis of gene linkages was performed using the igraph package (v.0.7.1) in R. Multiple contexts, as determined by the linkage between mobile genes in the dataset, were observed for 5,484 out of a total of 9,233 genes..
Microbiome composition
The bacterial composition of all samples was determined using MetaPhylerSR (v 0.115)52. The default database was supplemented with AMPHORA genes from the genome Succinatimonas sp. CAG:777 genome. The prevalence and abundance of plant matter was determined after aligning metagenomics reads to the SILVA database (v.115)53. We used FDR-adjusted p-vales of Pearson correlations to determine whether the abundances of any genes were significantly associated with the abundances of specific organisms in each cohort. We found that the abundances of 1800 out of 8322 genes (21.6%) and 1291 out of 6669 (19.4%) genes significantly correlated with the abundances of a single organism in the FijiCOMP and HMP cohorts, respectively.
Fijian Diet
The Fijian diet is rich in high-starch foods54,55,56, including taro (Colocasia esculenta), giant swamp taro (Cyrtosperma chamissonis), giant taro (Alocasia macrorhhiza), tannia (Xanthosoma sagittifolium), cassava (Manihot esculenta), sweet potato (Ipomoea batatas), yams (Dioscorea spp.), breadfruit (Artocarpus Altilis) and plantains (Musa cultivars).
Fijians rely heavily on seafood as a main source of protein. Artisinal fishing is predominant in the study regions57. The species that are commonly fished locally by artisanal fishers are: eastern triangular butterflyfish (Chaetodon baronessa), swallowtail puller (Chromis ternatensis), blue-green damselfish (Chromis viridis), threadfin breams (Pentapodus sp.), imitator damselfish (Pomacentrus imitator), and two-lined monocle bream (Scolopsis bilineata). 27 species of sea cucumbers are commonly fished, though much of this catch is sold internationally, including those caught by artisanal fishers. The species that are commonly fished commercially, although consumed less often in the study region, are: blue finned rock cod (Cephalopholis microprion), blue-spotted grouper (Cephalopholis rodeta), daisy parrotfish (Chlorurus sordidus), orange-spotted emperorfish (Lethrinus erythracanthus), thumbprint emperor (Lethrinus harak), and snappers (Macolor spp.)58.
Additional fish and shellfish consumed in Fiji, although not assessed for the study region include: albacore tuna (Thunnus alalunga), yellowfin tuna (Thunnus albacares), skipjack tuna (Katsuwanas pelamis), bigeye tuna (Thunnus obesus), Spanish mackerel (Scomberomorus commerson), striped marlin (Tetrapturus audax), blue marlin (Makaira mazara), barracuda (Sphyraena sp.), swordfish (Xiphias gladius), sailfish (Istiophorus platypterus), opah (Lamprius regius), sunfish (Mola mola), mahi mahi (Coryphaena sp.), black snapper (Macolor niger), goatfish (Parupeneus barberinus), parrotfish (Scarus sp.), rabbit fish (Siganus puntatus), peacock cod (Cephalopholis argus), unicornfish (Naso unicornis), cockles (Anadara antiquata), freshwater mussels (Batissa violacea) and other unspecified reef fish59.
Antibiotic Use in Fiji
Specifically, we expected that orally administered antibiotics used to treat common ailments and dental infections would be the primary target of resistance, and these are limited to beta-lactams (amoxicillin, penicillin, fluxocillin), tetracycline, chloramphenicol, quinolones (ciprofloxacin), and metronidazole60-62. Thus, differences may reflect antibiotic use in other societal sectors, such as in livestock, historical uses of antibiotics, or the acquisition of multiple antibiotic resistance genes transferred within single cassettes. These findings highlight our relatively limited understanding of the forces that drive selection for antibiotic resistance selection within populations, and the reservoirs for resistance genes63. These topics are acutely important in Fiji, as Shigella infections are common and resistance to betalactamases, tetracyclines, chloramphenicol, cephalosporins and quinolones has already been reported64.
Data availability
FijiCOMP metagenomic samples generated for this study are all deposited on NCBI’s Short Read Archive under Project Number PRJNA217052. The specific SRS numbers corresponding to each study participant’s gut and oral microbiome can be found in Supplemental Table 2. The single-cell assemblies can be found in the Data section at http://www.fijicomp.org.
Extended Data
Extended Data Figure 1. Phylogeny of assemblies utilized in the study span the bacterial Tree of Life.
A phylogenetic tree constructed using a multiple sequence alignment of the full 16S rRNA gene or the V68 region of the 16S rRNA gene of all reference genomes and single-cell assemblies used in this analysis where available. 16S alignments were constructed using RDP. The tree was then assembled using FastTree. Support was low for all deep branches in the tree, therefore the archeal branch serves as the outgroup for illustrative purposes only. The outer color bar displays taxonomic associations for archea and bacterial phyla. The inner color bar displays the source of that operational taxonomic unit: HMP reference cells (blue) and FijiCOMP single cell assemblies (red). 16S rRNA gene sequences were not available for 70 FijiCOMP single-cell assembles, which are therefore not included in this tree.
Extended Data Figure 2. Methodology for identifying horizontally transferred genes and assessing their distribution within the metagenomic samples.
Horizontally transferred regions were first identified using pair-wise BLASTs between HMP reference genomes and FijiCOMP single cell assemblies. Open reading frames were annotated within the horizontally transferred regions. Genetic redundancy was removed in the mobile gene set to ensure accurate abundance estimates using a combination of UCLUST and BLAST. Metagenomic reads were then aligned to the dataset of unique mobile genes. Alignments were filtered to retain only reads that aligned with 99% identity across over 50% of their read length. Abundances of genes in the metagenomic samples were determined for genes whose alignments had a minimum of 4x alignment depth over 80% of the gene length.
Extended Data Figure 3. The abundance of mobile gene families are largely determine by cohort.
(A) A heatmap is plotted showing the abundances (FPKM) of mobile genes aggregated by functional gene family (COG assignment, KEGG, TIGRFAM or PFAM family) within each of the metagenomic samples. Hierarchical clustering using complete linkage was performed on the Euclidean distances between profiles of functional gene families across individuals; and on the distances between individuals’ mobile gene composition. Values are plotted on a logarithmic scale. (B) A heatmap is plotted showing the abundances (FPKM) of only those mobile gene families that were deemed of higher confidence within each of the metagenomic samples. These include mobile gene families from mobile genes that were annotated as horizontal transfer machinery or had additional support for their phylogenetic placement. The placements of gene families and individuals were maintained from Extended Data Figure 3A for comparative purposes. (C) A heatmap is plotted showing the abundances (FPKM) of only those mobile genes that were observed to be transferred between HMP reference genomes within each of the metagenomic samples. The placements of gene families and individuals were maintained from Extended Data Figure 3A for comparative purposes.
Extended Data Figure 4. Distributions of glycoside hydrolase 13 genes and glycoside hydrolase families within mobile genes of higher confidence display population-specific enrichment.
(A) Prevalence and abundance (measured by FPKM) of mobile genes annotated as members of the Glycoside Hydrolase 13 family in the FijiCOMP (red) and HMP (blue) metagenomic stool samples is plotted. (B) Prevalence and abundance of all glycoside hydrolase (GH) families within the higher confidence mobile gene subset present in the FijiCOMP (red) and HMP (blue) metagenomic stool samples is plotted. Only unique gene families from mobile genes that were annotated as horizontal transfer machinery or had additional support for their phylogenetic placement are included here. Abundances were measured by FPKM, aggregated according to GH family, and plotted as a function of the density across samples. For each GH family, the number of unique horizontally transferred genes observed is noted, as are the sources of their substrates.
Extended Data Figure 5. Composition of the gut microbiomes of HMP and FijiCOMP study participants.
(A) Relative abundances of bacteria according to phylum are plotted for metagenomic samples from individuals in the HMP (blue) and FijiCOMP (red) cohorts. Samples are sorted according to cohort and the abundance of the dominant phyla. (B) Relative abundances of families within the Order Bacteriodales are plotted for metagenomic samples from individuals in the HMP (blue) and FijiCOMP (red) cohorts. Samples are sorted according to cohort and the abundance of the top Bacteroidales member.
Extended Data Figure 6. Mobile genes are observed in a wide variety of bacterial host backgrounds across the two cohorts.
(A,B) A heatmap is plotted showing the number of read-pairs per person that aligned to both a tRNA gene and two specific horizontally transferred genes. Colors within the heatmap reflect the read abundance according to the species associated with the specific tRNA gene. The color bar represents from which meteganomic cohort the reads are from: FijiCOMP (red) and HMP (blue).
Extended Data Figure 7. The relative abundances of genes and contexts across populations is not sensitive to precise definitions.
Percentages of gene families, as determined by COG annotations (left panel), identical genes (middle panel) and gene contexts (right panel) across populations for a wide range of parameters. Bars are plotted in 5% increments. Bars shaded in black are the parameters that are plotted in Figure 4.
Extended Data Figure 8. Horizontal transfer varies across cells at different phylogenetic distances.
(A) Nucleotide identity cutoffs for full length 16S rRNA and the V68 16S rRNA region were compared to avoid comparisons between closely related cells. For each pair of HMP reference genomes, nucleotide identity for their full length 16S rRNA is plotted against that of their V68 regions. 97% identity of full-length 16S (corresponding to approximately 75 million years of evolution) was used as a cutoff, whereas 95% was used as a cutoff when only sequences in the V68 region were available. Only those genomes above 90% similar at both the full-length and V68 region are shown. (C) HGT frequency is plotted as a function of the phylogenetic divergence between species between all cell-cell comparisons (black), between HMP reference genomes only (blue) and between the FijiCOMP single cell assemblies (red). This plot includes only cells for which full-length 16S rRNA genes could be identified. The number of cell-cell comparisons contributing to each of the lines is plotted in (B).
Extended Data Figure 9. Representative genes chosen for the final mobile gene dataset are highly similar to the genes that were filtered to reduce redundancy.
For each overlapping horizontally transferred region observed in cell-cell BLASTn comparisons between the reference genomes and single-cell assemblies, genes were clustered to identify unique genes and reduce the redundancy of the gene set. This step is essential for accurate abundance measurements of these genes in the metagenomic datasets after read alignment. All open reading frames from each overlapping horizontally transferred region were grouped using UCLUST. The nucleotide identities of each of the filtered genes and it’s the gene chosen for read alignment (i.e. the centroid) is plotted.
Extended Data Figure 10. Metagenomic reads align to mobile genes with high fidelity over their entire length.
Metagenomic reads were required to align with 99% identity to a mobile gene over at least 50% of the read length. Despite the seemingly low 50% cutoff, almost all reads align with near-perfect nucleotide identity over the entire length of the gene.
Supplementary Material
Acknowledgements
We would like to thank our field collaborators in the Fiji Islands: the Wildlife Conservation Society, Fiji and Wetlands International-Oceania; K. Jenkins and S. Korovou at the Fijian Ministry of Health; and N. Litidamu and K. Kishore at Fiji National University. We thank T. Poon (Broad Institute) for sample, sequencing, and data coordination, and A. Materna (QIAGEN) for technical assistance. This work was supported by grants from: the National Human Genome Research Institute (U54HG003067) to the Broad Institute, the Center for Environmental Health Sciences at MIT, the Center for Microbiome Informatics and Therapeutics at MIT, and the Fijian Ministry of Health. Additional support was provided by: a Columbia University Earth Institute Fellowship (I.L.B.), a Broad Institute Lawrence Summers Fellowship (L.X.), a Burroughs Welcome Fund Career Award at the Scientific Interface (P.C.B.), and an R01 DE020891 funded by the NIDCR and ENIGMA, a Lawrence Berkeley National Laboratory Scientific Focus Area Program supported by the U.S. Department of Energy, Office of Science, Office of Biological and Environmental Research (S.Y. and A.K.S.). Sandia is a multi-program laboratory operated by Sandia Corp., a Lockheed Martin Co., for the United States Department of Energy under Contract DE-AC04-94AL85000.
Footnotes
Author Contributions
I.L.B. and E.J.A. designed the study. I.L.B., S.D.J., A.P.J. and W.N. oversaw and performed the field collection of FijiCOMP data and samples. I.L.B., L.X., S.Y., and M.T. performed all experimental work. D.G., B.W.B., J.R.W., P.C.B., R.J.X. and A.K.S. oversaw the DNA sequencing production. I.L.B. and K.H. processed the shotgun data and performed alignments. I.L.B., K.H., and D.G. provided new analytical tools. I.L.B. K.H. and C.S.S. performed computational analysis. I.L.B. and E.J.A. wrote the manuscript.
Competing financial interests
The authors declare no competing financial interests.
References
- 1.Turnbaugh PJ, et al. An obesity-associated gut microbiome with increased capacity for energy harvest. Nature. 2006;444:1027–1031. doi: 10.1038/nature05414. [DOI] [PubMed] [Google Scholar]
- 2.Giongo A, et al. Toward defining the autoimmune microbiome for type 1 diabetes. The ISME Journal. 2011;5:82–91. doi: 10.1038/ismej.2010.92. [DOI] [PMC free article] [PubMed] [Google Scholar]
- 3.Qin J, et al. A metagenome-wide association study of gut microbiota in type 2 diabetes. Nature. 2012;490:55–60. doi: 10.1038/nature11450. [DOI] [PubMed] [Google Scholar]
- 4.Scher JU, et al. Expansion of intestinal Prevotella copri correlates with enhanced susceptibility to arthritis. eLife. 2013;2:e01202. doi: 10.7554/eLife.01202. [DOI] [PMC free article] [PubMed] [Google Scholar]
- 5.Kang DW, et al. Reduced Incidence of Prevotella and Other Fermenters in Intestinal Microflora of Autistic Children. PLOS One. 2013 doi: 10.1371/journal.pone.0068322. 10.1371/journal.pone.0068322. [DOI] [PMC free article] [PubMed] [Google Scholar]
- 6.Parks DH, Imelfort M, Skennerton CT, Hugenholtz P, Tyson GW. CheckM: assessing the quality of microbial genomes recovered from isolates, single cells, and metagenomes. PeerJ PrePrints. 2014;2:e554v1. doi: 10.1101/gr.186072.114. [DOI] [PMC free article] [PubMed] [Google Scholar]
- 7.Smillie CS, et al. Ecology drives a global network of gene exchange connecting the human microbiome. Nature. 2011;480:241–244. doi: 10.1038/nature10571. [DOI] [PubMed] [Google Scholar]
- 8.Kumarasamy KK, et al. Emergence of a new antibiotic resistance mechanism in India, Pakistan, and the UK: a molecular, biological, and epidemiological study. Lancet Infect Dis. 2010;10:597–602. doi: 10.1016/S1473-3099(10)70143-2. [DOI] [PMC free article] [PubMed] [Google Scholar]
- 9.de Filippo C, et al. Impact of diet in shaping gut microbiota revealed by a comparative study in children from Europe and rural Africa. Proc. Natl. Acad. Sci. U.S.A. 2010;107:14691–14696. doi: 10.1073/pnas.1005963107. [DOI] [PMC free article] [PubMed] [Google Scholar]
- 10.Yatsunenko T, et al. Human gut microbiome viewed across age and geography. Nature. 2012;486:222–227. doi: 10.1038/nature11053. [DOI] [PMC free article] [PubMed] [Google Scholar]
- 11.O'Donnell MM, O'Toole PW, Ross RP. Catabolic flexibility of mammalian-associated lactobacilli. Microb Cell Fact. 2013;16(12):48. doi: 10.1186/1475-2859-12-48. [DOI] [PMC free article] [PubMed] [Google Scholar]
- 12.Shapiro BJ, David LA, Friedman J, Alm EJ. Looking for Darwin’s footprints in the microbial world. Trends Microbiol. 2009;17:196–204. doi: 10.1016/j.tim.2009.02.002. [DOI] [PubMed] [Google Scholar]
- 13.Hehemann J-H, et al. Transfer of carbohydrate-active enzymes from marine bacteria to Japanese gut microbiota. Nature. 2010;464:908–912. doi: 10.1038/nature08937. [DOI] [PubMed] [Google Scholar]
- 14.Summers AO, et al. Mercury released from dental ‘silver’ fillings provokes an increase in mercury- and antibiotic-resistant bacteria in oral and intestinal floras of primates. Antimicrob. Agents Chemother. 1993;37:825–834. doi: 10.1128/aac.37.4.825. [DOI] [PMC free article] [PubMed] [Google Scholar]
- 15.Forsberg KJ, et al. The shared antibiotic resistome of soil bacteria and human pathogens. Science. 2012;337:1107–1111. doi: 10.1126/science.1220761. [DOI] [PMC free article] [PubMed] [Google Scholar]
- 16.Forslund K, et al. Country-specific antibiotic use practices impact the human gut resistome. Genome Res. 2013;7:1163–9. doi: 10.1101/gr.155465.113. [DOI] [PMC free article] [PubMed] [Google Scholar]
- 17.Coyne MJ, Zitomersky NL, McGuire AM, Earl AM, Comstock LE. Evidence of Extensive DNA Transfer between Bacteroidales Species within the Human Gut. mBio. 2014:e01305–14. doi: 10.1128/mBio.01305-14. [DOI] [PMC free article] [PubMed] [Google Scholar]
- 18.The Human Microbiome Project Consortium, Structure, function and diversity of the healthy human microbiome. Nature. 2012;486:207–214. doi: 10.1038/nature11234. [DOI] [PMC free article] [PubMed] [Google Scholar]
- 19.Jones BV, Sun F, Marchesi JR. Comparative metagenomic analysis of plasmid encoded functions in the human gut microbiome. BMC Genomics. 2010;11:46. doi: 10.1186/1471-2164-11-46. [DOI] [PMC free article] [PubMed] [Google Scholar]
- 20.Kav BA, et al. Insights into the bovine rumen plasmidome. Proc. Natl. Acad. Sci. U.S.A. 2012;109:5452–5457. doi: 10.1073/pnas.1116410109. [DOI] [PMC free article] [PubMed] [Google Scholar]
- 21.Sentchilo V, et al. Community-wide plasmid gene mobilization and selection. ISME J. 2013;7:1173–1186. doi: 10.1038/ismej.2013.13. [DOI] [PMC free article] [PubMed] [Google Scholar]
- 22.Breitbart M, et al. Metagenomic analyses of an uncultured viral community from human feces. J. Bacteriol. 2003;185:6220–6223. doi: 10.1128/JB.185.20.6220-6223.2003. [DOI] [PMC free article] [PubMed] [Google Scholar]
- 23.Reyes A, et al. Viruses in the faecal microbiota of monozygotic twins and their mothers. Nature. 2010;466:334–338. doi: 10.1038/nature09199. [DOI] [PMC free article] [PubMed] [Google Scholar]
- 24.Human Microbiome Jumpstart Reference Strains Consortium et al. A catalog of reference genomes from the human microbiome. Science. 2010;328:994–999. doi: 10.1126/science.1183605. [DOI] [PMC free article] [PubMed] [Google Scholar]
- 25.Cantarel BL, Lombard V, Henrissat B. Complex carbohydrate utilization by the healthy human microbiome. PLoS ONE. 2012;7:e28742. doi: 10.1371/journal.pone.0028742. [DOI] [PMC free article] [PubMed] [Google Scholar]
- 26.Clemente JC, et al. The microbiome of uncontacted Amerindians. Sci Adv. 2015;1(3):e1500183. doi: 10.1126/sciadv.1500183. pii. [DOI] [PMC free article] [PubMed] [Google Scholar]
- 27.Shapiro BJ, et al. Population genomics of early events in the ecological differentiation of bacteria. Science. 2012;336:48–51. doi: 10.1126/science.1218198. [DOI] [PMC free article] [PubMed] [Google Scholar]
- 28.Dutilh BE, et al. A highly abundant bacteriophage discovered in the unknown sequences of human faecal metagenomes. Nat Commun. 2014;5 doi: 10.1038/ncomms5498. [DOI] [PMC free article] [PubMed] [Google Scholar]
- 29.Faith JJ, et al. The Long-Term Stability of the Human Gut Microbiota. Science. 2013;341:1237439. doi: 10.1126/science.1237439. [DOI] [PMC free article] [PubMed] [Google Scholar]
- 30.David LA, et al. Host lifestyle affects human microbiota on daily timescales. Genome Biology. 2014;15:R89. doi: 10.1186/gb-2014-15-7-r89. [DOI] [PMC free article] [PubMed] [Google Scholar]
- 31.Dean FB, Nelson JR, Giesler TL, Lasken RS. Rapid amplification of plasmid and phage DNA using Phi 29 DNA polymerase and multiply-primed rolling circle amplification. Genome Res. 2001;11:1095–1099. doi: 10.1101/gr.180501. [DOI] [PMC free article] [PubMed] [Google Scholar]
- 32.Cole JR, et al. Ribosomal Database Project: data and tools for high throughput rRNA analysis. Nucleic Acids Res. 2014;42:D633–642. doi: 10.1093/nar/gkt1244. [DOI] [PMC free article] [PubMed] [Google Scholar]
- 33.Bankevich A, et al. SPAdes: A New Genome Assembly Algorithm and Its Applications to Single-Cell Sequencing. Journal of Computational Biology. 2012;19(5):455–477. doi: 10.1089/cmb.2012.0021. [DOI] [PMC free article] [PubMed] [Google Scholar]
- 34.Wu M, Scott AJ. Phylogenomic analysis of bacterial and archaeal sequences with AMPHORA2. Bioinformatics. 2012;28:1033–1034. doi: 10.1093/bioinformatics/bts079. [DOI] [PubMed] [Google Scholar]
- 35.Parks DH, Imelfort M, Skennerton CT, Hugenholtz P, Tyson GW. Assessing the quality of microbial genomes recovered from isolates, single cells, and metagenomes. Genome Resesarch. 2014 doi: 10.1101/gr.186072.114. doi: 10.1101/gr.186072.114. [DOI] [PMC free article] [PubMed] [Google Scholar]
- 36.Lagesen K, Hallin P, Rødland EA, Stærfeldt H, Rognes T, Ussery DW. RNAmmer: consistent and rapid annotation of ribosomal RNA genes. Nucleic Acids Res. 2007;35(9):3100–3108. doi: 10.1093/nar/gkm160. [DOI] [PMC free article] [PubMed] [Google Scholar]
- 37.Nawrocki EP, Eddy SR. Infernal 1.1: 100-fold faster RNA homology searches. Bioinformatics. 2013;29:2933–2935. doi: 10.1093/bioinformatics/btt509. [DOI] [PMC free article] [PubMed] [Google Scholar]
- 38.Price MN, Dehal PS, Arkin AP. FastTree 2 – Approximately Maximum-Likelihood Trees for Large Alignments. PLoS ONE. 2010;5(3):e9490. doi: 10.1371/journal.pone.0009490. doi: 10.1371/journal.pone.0009490. [DOI] [PMC free article] [PubMed] [Google Scholar]
- 39.Hyatt D, et al. Prodigal: prokaryotic gene recognition and translation initiation site identification. BMC Bioinformatics. 2010;11:119. doi: 10.1186/1471-2105-11-119. [DOI] [PMC free article] [PubMed] [Google Scholar]
- 40.Edgar RC. Search and clustering orders of magnitude faster than BLAST. Bioinformatics. 2010;26:2460–2461. doi: 10.1093/bioinformatics/btq461. [DOI] [PubMed] [Google Scholar]
- 41.Kanehisa M, et al. Data, information, knowledge and principle: back to metabolism in KEGG. Nucleic Acids Res. 2014;42:D199–205. doi: 10.1093/nar/gkt1076. [DOI] [PMC free article] [PubMed] [Google Scholar]
- 42.Yin Y, et al. dbCAN: a web resource for automated carbohydrate-active enzyme annotation. Nucleic Acids Res. 2012;40:W445–451. doi: 10.1093/nar/gks479. [DOI] [PMC free article] [PubMed] [Google Scholar]
- 43.Cantarel BL, Lombard V, Henrissat B. Complex carbohydrate utilization by the healthy human microbiome. PLoS ONE. 2012;7:e28742. doi: 10.1371/journal.pone.0028742. [DOI] [PMC free article] [PubMed] [Google Scholar]
- 44.Gibson MK, Forsberg KJ, Dantas G. Improved annotation of antibiotic resistance determinants reveals microbial resistomes cluster by ecology. ISME J. 2014 doi: 10.1038/ismej.2014.106. doi:10.1038/ismej.2014.106. [DOI] [PMC free article] [PubMed] [Google Scholar]
- 45.Li H, Durbin R. Fast and accurate short read alignment with Burrows-Wheeler transform. Bioinformatics. 2009;25:1754–1760. doi: 10.1093/bioinformatics/btp324. [DOI] [PMC free article] [PubMed] [Google Scholar]
- 46.Wilson DN. Ribosome-targeting antibiotics and mechanisms of bacterial resistance. Nat. Rev. Microbiol. 2014;12:35–48. doi: 10.1038/nrmicro3155. [DOI] [PubMed] [Google Scholar]
- 47.Gilbart J, Perry CR, Slocombe B. High-level mupirocin resistance in Staphylococcus aureus: evidence for two distinct isoleucyl-tRNA synthetases. Antimicrob. Agents Chemother. 1993;37:32–38. doi: 10.1128/aac.37.1.32. [DOI] [PMC free article] [PubMed] [Google Scholar]
- 48.Schimmel P, Tao J, Hill J. Aminoacyl tRNA synthetases as targets for new anti-infectives. FASEB J. 1998;12:1599–1609. [PubMed] [Google Scholar]
- 49.Hurdle JG, O’Neill AJ, Mody L, Chopra I, Bradley SF. In vivo transfer of high-level mupirocin resistance from Staphylococcus epidermidis to methicillin-resistant Staphylococcus aureus associated with failure of mupirocin prophylaxis. J. Antimicrob. Chemother. 2005;56:1166–1168. doi: 10.1093/jac/dki387. [DOI] [PMC free article] [PubMed] [Google Scholar]
- 50.Widmann J, Harris JK, Lozupone C, Wolfson A, Knight R. Stable tRNA-based phylogenies using only 76 nucleotides. RNA. 2010;16:1469–1477. doi: 10.1261/rna.726010. [DOI] [PMC free article] [PubMed] [Google Scholar]
- 51.Laslett D, Canback B. ARAGORN, a program to detect tRNA genes and tmRNA genes in nucleotide sequences. Nucleic Acids Res. 2004;32:11–16. doi: 10.1093/nar/gkh152. [DOI] [PMC free article] [PubMed] [Google Scholar]
- 52.Liu Bo, Gibbons Theodore, Ghodsi Mohammad, Treangen Todd, Pop Mihai. Accurate and fast estimation of taxonomic profiles from metagenomic shotgun sequences. BMC Genomics. 2011;12(Suppl 2):S4. doi: 10.1186/1471-2164-12-S2-S4. [DOI] [PMC free article] [PubMed] [Google Scholar]
- 53.Quast C, et al. The SILVA ribosomal RNA gene database project: improved data processing and web-based tools. Nucleic Acids Res. 2013;41:D590–596. doi: 10.1093/nar/gks1219. [DOI] [PMC free article] [PubMed] [Google Scholar]
- 54.Robertson AFS, editor. Food and Nutrition in Fiji: Nutrition-related diseases and their prevention. University of the South Pacific. Fiji. 1991 [Google Scholar]
- 55.Rush E, Hedges R, Alsbersberg B, Qionibaravi D, Laulu M. Staple food intake in a rural village in Verata. Fiji. Pac Health Dialog. 2001;8:44–46. [PubMed] [Google Scholar]
- 56.Food and Agricultural Organization Pacific Food Security Toolkit: Building Resilience to Climate Change, Root Crop and Fishery Production. Italy. 2010 [Google Scholar]
- 57.Goetze J. Evidence of artisanal fishing impacts and depth refuge in assemblages of reef fish of a Fijian Island. The University of Western Australia; Perth, Australia: 2009. Honours thesis. [Google Scholar]
- 58.Jupiter S, Saladrau W, Vave R. [Google Scholar]
- 59.Kumar M, Aalbersberg B, Mosle L. Mercury Levels in Fijian Seafoods and Potential Health Implications. World Health Organization. Western Pacific Region. 2004 [Google Scholar]
- 60.Murti A, Morse Z. Dental antibiotic prescription in Fijian adults. Int Dent J. 2007;57:65–70. doi: 10.1111/j.1875-595x.2007.tb00440.x. [DOI] [PubMed] [Google Scholar]
- 61.Ministry of Health, Government of Fiji National Drugs and Therapeutics Subcommittee. Antibiotic Guidelines. (3rd) 2011 [Google Scholar]
- 62.Thompson CN, et al. Typhoid fever in Fiji: a reversible plague? Trop Med Int Health. 2014;19:1284–1292. doi: 10.1111/tmi.12367. [DOI] [PMC free article] [PubMed] [Google Scholar]
- 63.Sommer MOA, Dantas G, Church GM. Functional characterization of the antibiotic resistance reservoir in the human microflora. Science. 2009;325:1128–1131. doi: 10.1126/science.1176950. [DOI] [PMC free article] [PubMed] [Google Scholar]
- 64.Watson C. Death from multi-resistant shigelloses: a case study from Fiji. Pac Health Dialog. 2006;13:111–114. [PubMed] [Google Scholar]
Associated Data
This section collects any data citations, data availability statements, or supplementary materials included in this article.
Supplementary Materials
Data Availability Statement
FijiCOMP metagenomic samples generated for this study are all deposited on NCBI’s Short Read Archive under Project Number PRJNA217052. The specific SRS numbers corresponding to each study participant’s gut and oral microbiome can be found in Supplemental Table 2. The single-cell assemblies can be found in the Data section at http://www.fijicomp.org.


