Abstract
Erythropoietin (EPO), used to treat anemia in cancer patients, has been reported to accelerate tumor progression and increase mortality. Research of the mechanism for this effect has focused upon EPOR expression by tumor cells. We model the high macrophage to lymphocyte ratio found in tumor microenvironments (TMEs) by culturing peritoneal cavity (PerC) cells that naturally have a high macrophage to T cell ratio. Following TCR ligation, C57BL/6J PerC T cell proliferation is suppressed due to IFNγ-triggered inducible nitric oxide synthase (iNOS) expression. EPO was tested in the PerC culture model and found to increase T cell suppression. This effect could be abrogated by inhibiting iNOS by enzyme inhibition, genetic ablation, or blocking IFNγ signaling. Flow cytometry revealed the EPOR on CD11b+F4/80+ macrophages. These results suggest that EPO could increase T cell suppression in the TME by acting directly on macrophages.
Keywords: EPO, EPOR, iNOS, macrophage, tumor microenvironment
1. Introduction
Understanding of the role of the immune system in cancer continues to undergo a revolution with growing appreciation for important differences in pre- and post-reproductive age immunity. Particularly notable is the concept of “immunoediting”, whereby the immune system controls neoplasia early in life yet also fosters subsequent emergence of immune-resistant cells [1]. Removal of apoptotic cells is an essential housekeeping function mediated by anti-inflammatory or immune suppressive phagocytes. Such cells, active in the hypoxic core of the evolving cell mass, can promote angiogenesis via vascular endothelial growth factor (VEGF) production, initiating a critical step in the further development of the nascent tumor [2,3]. VEGF is pleiotropic as it can also temper inflammation via nitric oxide (NO) production [4]. The premise that tumors are “wounds that do not heal” unites the elements of tissue repair, cell corpse clearance, and immune suppression [5,6]. Myeloid cells are key players in these processes and often have a high proportional representation in tumors [6,7]. Biopsy assessments have a growing focus on such cells as they serve as prognosis indicators as well as biomarkers for emerging immunotherapies [7,8].
Contemporary cancer treatments have begun to exploit this knowledge. Avastin, a humanized mAb that neutralizes VEGF, was developed to inhibit tumor angiogenesis. As patient data accumulated, optimal efficacy in breast cancer was found to correlate with patients having hypertension, a disease often reflecting reduced NO production [9]. Breast tumors often have significant myeloid composition including cells known to suppress immunity via NO production [10–12]. Thus, neutralization of VEGF could reduce both pathological angiogenesis and myeloid immune suppression in the tumor microenvironment (TME), particularly for hypertensive patients [13].
Like VEGF, erythropoietin (EPO) is produced under conditions of hypoxic stress. EPO promotes erythropoiesis by triggering erythroblast differentiation and blocking apoptosis of erythroid progenitors [14–16]. Recombinant EPO (Epogen/Procrit, Aranesp) was one of the first blockbuster biopharmaceuticals. Initially developed to treat anemia in kidney dialysis patients, subsequent trials in cancer patients led to its use as the primary treatment for the anemia associated with myelosuppressive chemotherapy or radiotherapy (17–20). As this treatment group expanded and patient data was analyzed EPO was found to accelerate tumor progression and increase mortality leading the FDA to revise EPO administration guidelines [21–23]. EPO, like VEGF, has been implicated in poor prognoses for oncology patients [24,25].
EPO is tissue-protective, promoting wound healing in various injury models including ischemia-reperfusion, trauma, cytotoxic infections, and tissue/organ inflammation [26]. Thus, like VEGF, EPO can exhibit pleiotropic functions that particular cancers can commandeer. With disagreement regarding erythropoietin receptor (EPOR) expression by various cancer cells [19, 27–35], the question remains as to how EPO might promote cancer progression. Evidence for leucocytes expressing the EPOR inform models for how EPO might temper immunity within TMEs [36–40].
Cellular immunity is strictly dependent upon cellular collaboration. The ratio of myeloid to lymphoid cells (M:L) has been shown to impact immunity in vitro and in vivo [7,41]. In contrast to organized lymphoid tissue with low M:L ratios [42], many tumors have high M:L ratios (7). Although these tumors often have antigen-specific T cells in situ, these cells are unresponsive. Such TMEs can be modeled in vitro via PerC cell culture wherein macrophage-dense conditions suppress T cell activation via catabolism of limiting amino acids, production of anti-inflammatory cytokines, and prostaglandin metabolism [41–44]. Data herein show that EPO increases T cell suppression in PerC cell culture by increasing macrophage catabolism of arginine. These results serve to illustrate how EPO administration could foster tumor development and validate theories that certain forms of cancer co-opt normal homeostatic tissue repair mechanisms [45].
2. Materials and methods
2.1 Mice
Two to four month old male and female mice, bred and maintained at Rider University, were handled in accord with NIH, Animal Welfare Act, and Rider University IACUC guidelines. Breeding pairs of C57BL/6J, BALB/c, IFNγR−/− (B6.129S7Ifngr/J), and iNOS−/− (B6.129P2-Nos2tm1Lau/J) mice were obtained from the Jackson Laboratory, Bar Harbor, ME.
2.2 Preparation of cell suspensions and cell culture
Spleen (SP) cell suspensions were obtained by gentle disruption of the organ between the frosted ends of sterile glass slides. Red blood cells were removed from SP cell preparations by hypertonic lysis followed by washing with Hanks Balanced Salt Solution (HBSS) (Life Technologies, Grand Island, NY). Peritoneal cavity (PerC) cells were obtained by flushing the peritoneum with 10 ml of warm (37°C) HBSS supplemented with 2–3% fetal bovine serum (FBS) (Hyclone, Logan, UT). Viable cell counts were determined by Trypan blue exclusion. Various dilutions (0.3 – 4.0 × 10⁶/ml) of cells, in RPMI 1640 culture media (Life Technologies) supplemented with 10% FBS (Hyclone), 0.1 mM nonessential amino acids, 100 U/ml penicillin, 100 μg/ml streptomycin, 50 μg/ml gentamicin, 2 mM L-glutamine, 2 × 10⁻⁵ M 2-ME, and 10 mM HEPES, were incubated in a humidified atmosphere of 5% CO2 at 37°C in 96-well “V”- or flat-bottom microtiter plates (Corning Costar, Fisher Scientific, Pittsburgh, PA). For anti-CD3 stimulation soluble anti-CD3ε monoclonal antibody (mAb) (clone 145-2C11) (eBioscience, San Diego, CA) was added at 1.0 μg/ml. To inhibit arginine catabolism, the arginase (ARG) inhibitor N-ω-hydroxy-nor-L-arginine (1-NA; CalBiochem, San Diego, CA) or the inducible nitric oxide synthase (iNOS) inhibitor NG-monomethyl-L-arginine (1-MA; CalBiochem) were added. To inhibit tryptophan catabolism via indoleamine-2,3-dioxygenase (IDO), 1-methyl-tryptophan (1-MT; CalBiochem) was added. To inhibit COX, indomethacin (INDO; Sigma) was added. All inhibitors were added at culture initiation. Mouse recombinant erythropoietin (EPO; R&D Systems, Minneapolis, MN) was reconstituted as described by the supplier and plated at 100 ng (15 U) /mL unless specified otherwise. Optimal concentrations of all reagents were determined in titration experiments. After 44 hours, 1 μCi of [3H] thymidine (Amersham, Boston, MA) was added to each well. The plates were frozen 4 hours after labeling, and then thawed for harvesting onto filter paper mats using a semi-automated cell harvester (Skatron Instruments, Richmond, VA). Radioactivity was measured by liquid scintillation spectrometry. For each experiment 3–5 wells were established for each test group. As noted in our prior studies [42,44], media only controls routinely had < 1000 CPM and were excluded from figures.
2.3 Immunofluorescence staining and flow cytometric analyses
PerC cell suspensions were first blocked with rat anti-mouse CD16/32 (Fc Block; eBioscience) and 2% normal rat serum (Jackson ImmunoResearch, West Grove, PA). The cell suspensions were then stained using titered amounts of FITC-, Cy-Chrome-, or PE-labeled rat anti-mouse CD4, CD8, CD11b, and/or F4/80 mAbs (eBioscience). Isotype- and fluorochrome-matched, nonspecific mAb controls were employed to establish analysis gates. For carboxyfluorescein succinimidyl ester (CFSE) cell proliferation assays, cells were labeled with CellTrace CFSE Cell Proliferation Kit (Thermo Fisher) prior to culture. For extracellular detection of the EPOR, cells were pre-incubated with 10% normal goat serum ex vitro. For intracellular staining cells were treated per the BioLegend Fix/Perm buffer kit (BioLegend, San Diego, CA). Bound biotinylated goat anti-mouse EPOR or biotinylated normal goat IgG control were detected with Streptavidin-PE (R&D Systems). EPOR binding was blocked by pre-incubation with an excess of sEPOR (Sino Biological Inc., Beijing, China) followed by washing. The percentage of cells co-expressing these markers were determined via multiparameter flow cytometric analyses on a FACSCalibur™ flow cytometer (Becton Dickinson Immunocytometry Systems, San Jose, CA) by FSC/SSC gating the specified cell population using CellQuest software. Fifteen to twenty thousand cells were collected per sample.
2.4 Colorimetric assays
Determination of nitrite, a product of nitric oxide catabolism, was done using a Griess Reagent kit (Thermo Fisher) microplate assay following the manufacturer’s instructions. The absorbance of the nitrite containing samples was measured at 548nm using a microplate reader (SpectraMax M2, Molecular Devices, Sunnyvale, CA).
Cell proliferation was measured using the TetraZ™ Cell Counting Kit (BioLegend) (WST-8 and Methoxy PMS) following manufacturer’s instructions. Cells were treated 48 hours ex vitro with 10 μl of TetraZ™ cell counting solution per well, then formazan absorbance was measured after a 4 hour incubation at 37°C at 480nm using a microplate reader.
2.4 Western Blot
Total PerC or SP cells were cultured for 48 hours as described; cell lysates were prepared with RIPA (Thermo Fisher) lysis and extraction buffer. For detection of EPOR expression, lysate or 5 ng of recombinant mouse EPOR (Sino Biological) were separated by SDS-PAGE on a 12% acrylamide gel (Thermo Scientific) and transferred onto a Whatman® Optitran® BA-S 85 nitrocellulose membrane (Sigma). EPOR was probed with 0.1 μg/mL biotinylated anti-mouse EPOR antibody (R&D Systems) or a 1:200 dilution of biotinylated goat anti-mouse EPOR antiserum (M-20; Santa Cruz Biotechnology, Inc.). Bound antibody was detected using 0.1 μg/mL alkaline phosphatase (AP)-conjugated streptavidin (Jackson ImmunoResearch) or goat anti-rabbit IgG-AP (sc-2057; Santa Cruz Biotechnology, Inc.) and NBT/BCIP (Thermo Scientific).
2.5 Statistical Analyses and Stimulation Indices (SI)
T cell proliferative responses are presented as the average counts per minute (CPM) ± SEM (standard error of the mean). Data sets were compared using the Student’s t-test with p-values below 0.05 considered statistically significant. The stimulation index (SI) is defined as the average treated or experimental response (e.g., anti-CD3 + drug) divided by the average control response (anti-CD3 alone). Media-only control cultures routinely have CPM values < 1000 CPM and are not included in most figures for clarity.
3. Results
3.1 Peritoneal macrophages suppress T cell activation via amino acid catabolism
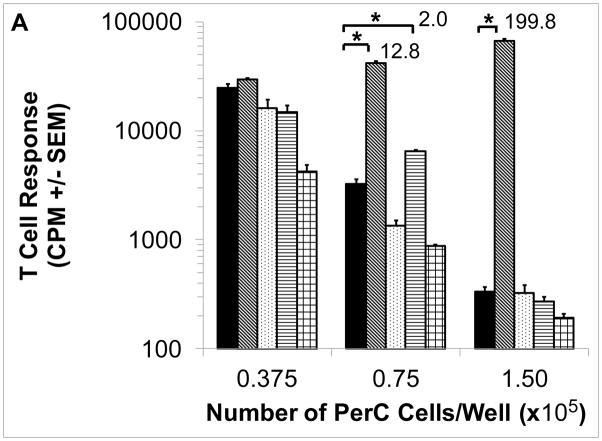
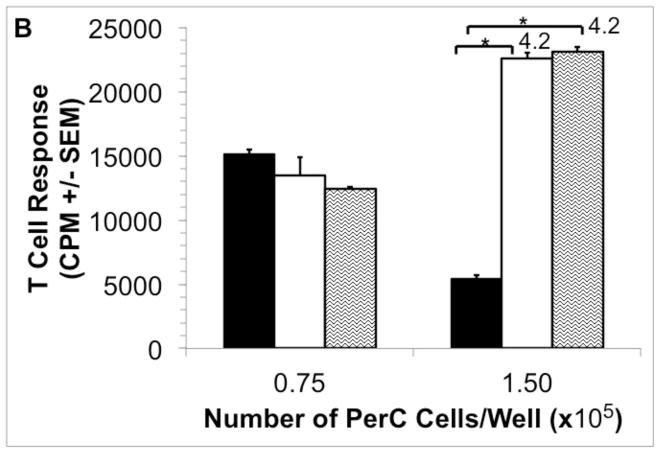
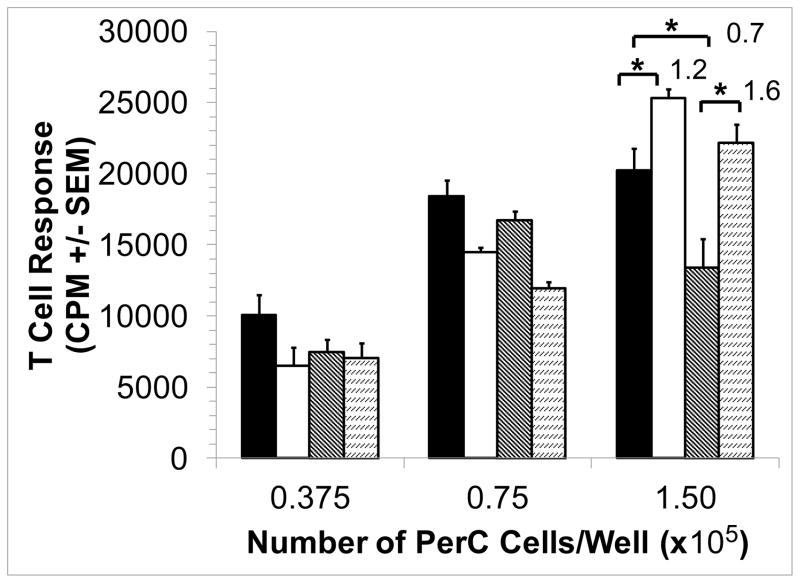
Cultures of murine peritoneal cavity (PerC) cells reproduce key features found in tumor microenvironments (TMEs), most notably a macrophage density-dependent suppression of T cell activation mediated by amino acid catabolism, inhibitory cytokine production, and/or prostaglandin production [2,7,11,41,46]. As shown by 1-methyl arginine (1-MA) inhibition of inducible nitric oxide synthase (iNOS) and based on culture density, C57BL/6J PerC T cells were suppressed primarily by arginine catabolism (Fig. 1A). Key roles for interferon-gamma (IFNγ) and iNOS in suppression were revealed by T cell responsiveness with interferon-gamma receptor knockout (IFNγR−/−) and iNOS−/− PerC cell cultures (Fig. 1B). These results demonstrate the utility of this culture model for studying macrophage suppression of T cell activation [41–44].
Figure 1. Cell concentration-dependent suppression of T cell activation.
Panel A: C57BL/6J PerC cells were cultured with (left to right) anti-CD3, anti-CD3 + 1-MA (iNOS inhibitor), anti-CD3 + 1-MT (IDO inhibitor), anti-CD3 + INDO (COX inhibitor), or anti-CD3 + 1-NA (arginase inhibitor). Panel B: Anti-CD3 activated (left to right) C57BL/6J, iNOS−/− and IFNγR−/− PerC cells. Asterisk indicates p < .05. Stimulation Indices (SI) are listed above the bars.
3.2 EPO increases macrophage suppression of T cells
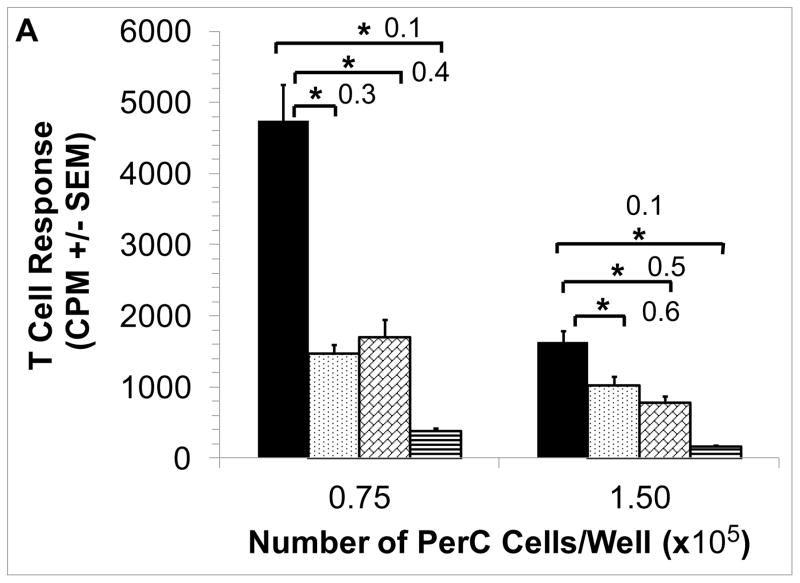
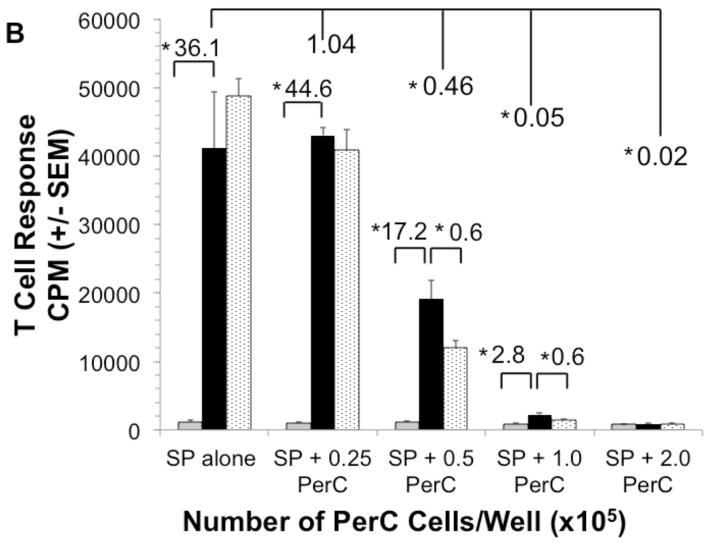
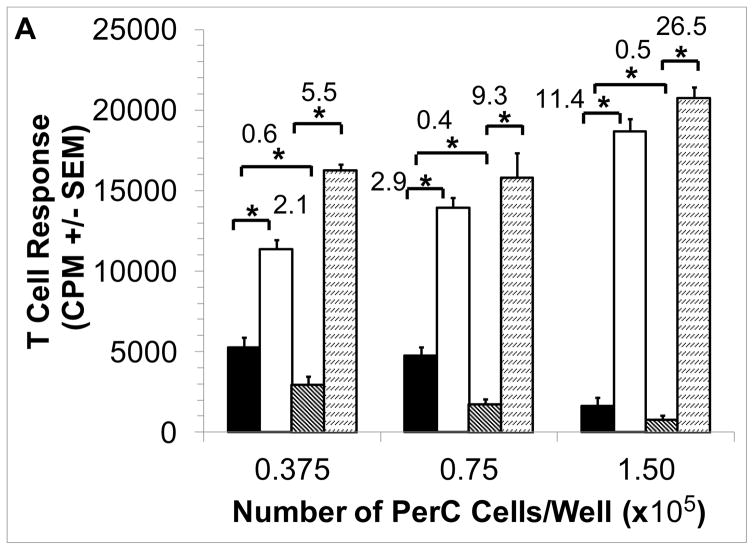
Consistent with their role in promoting wound healing, macrophages produce EPO to promote new blood vessel growth [5]. However, additional, immune-related properties for EPO have recently been reported [47,48]. To assess the effect of this hormone in the PerC cell TME model, EPO was added and T cell activation was assessed. In a dose-dependent fashion EPO increased T cell suppression (Fig. 2A). This effect was not seen in spleen (SP) cell cultures which have a normal T cell proliferative response due to the absence of the high macrophage to T cell ratio seen in PerC cell cultures (Fig. 2B) [42]. However, when graded numbers of PerC cells are added to SP cells T cell suppression returns as well as the EPO effect. Thus, EPO can increase T cell suppression in conditions that mimic the high macrophage to lymphocyte ratio found in TMEs.
Figure 2. Effect of EPO on C57BL/6J PerC and SP T cell activation.
Panel A: C57BL/6J PerC cells were cultured with (left to right) anti-CD3, anti-CD3 + 33, 100, or 300 ng/ml EPO. Graph depicts the average of three independent experiments that yielded similar results. Panel B: EPO has no effect on spleen (SP) T cell activation, yet when PerC cells are co-cultured with SP cells suppression and the EPO effect were observed. C57BL/6J SP cells cultured at 1.0 ×10⁵ cells/well with (left to right) CM, anti-CD3, anti-CD3 + 200 ng/ml EPO and graded numbers of C57BL/6J PerC cells.
3.3 Genetic variation in EPO-mediated suppression
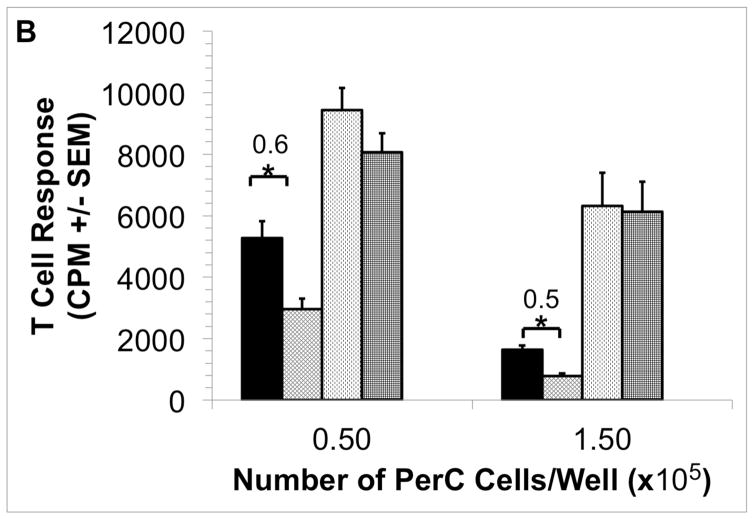
Due to their distinctive cytokine biology, BALB/c (Th2/IL4; “pro-humoral immunity”) PerC cells differ from those of C57BL/6J (Th1/IFNγ; “pro-cellular immunity”) in demonstrating macrophage suppression [42,49]. BALB/c PerC T cell proliferation is much greater in the more dense cultures (1.5 × 10⁵ cells/well) than that of C57BL/6J PerC cells. Furthermore, C57BL/6J PerC cells consistently exhibit a much greater response to 1-MA treatment (Fig. 1A versus Fig. 3). EPO still suppressed BALB/c PerC T cell activation in dense cultures (Fig. 3) and C57BL/6J PerC T cells were suppressed at all concentrations tested (Fig. 2A).
Figure 3. Effect of EPO upon BALB/c PerC T cell activation.
BALB/c PerC cells were cultured with (left to right) anti-CD3, anti-CD3 + 1-MA, anti-CD3 + 100 ng/ml EPO, anti-CD3 + EPO + 1-MA. Graph represents the average of at least three independent experiments with similar results.
3.4 Inhibition of iNOS blocks EPO-mediated suppression
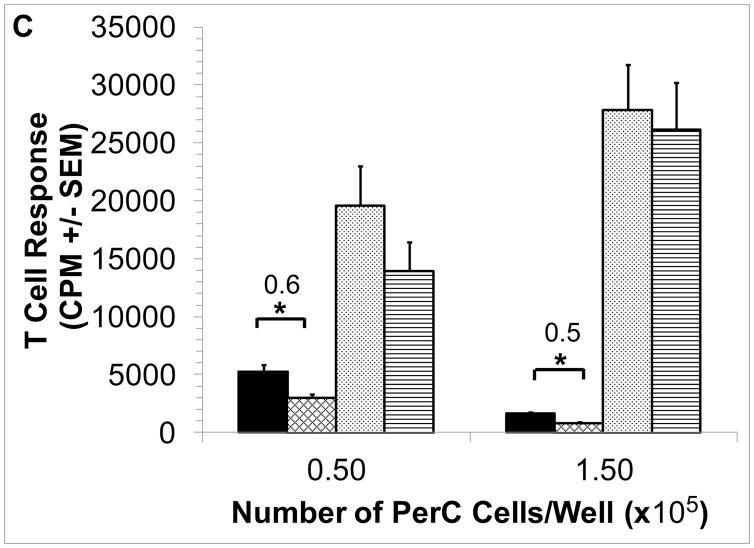
Inhibition of macrophage-produced iNOS with 1-MA permits PerC T cell activation (Fig. 1A) [41]. We tested if 1-MA could impact the increased suppression seen with the addition of EPO to C57BL/6J PerC cell cultures. The ability of EPO to increase suppression was lost when 1-MA was present in both C57BL/6J and BALB/c PerC cell cultures (Figs. 4A, 3). Likewise, EPO failed to temper T cell proliferation in iNOS−/− or IFNγR−/− PerC cell cultures (Figs. 4B, 4C). These data illustrate that EPO might increase T cell suppression by acting through the IFNγ-triggered iNOS pathway.
Figure 4. iNOS inhibition abrogates EPO-mediated suppression.
Panel A: EPO-mediated suppression is blocked by 1-MA. C57BL/6J PerC cells were cultured with (left to right) anti-CD3, anti-CD3 + 1-MA, anti- CD3 + 100 ng/ml EPO, anti-CD3 + 100 ng/ml EPO + 1-MA. Panel B: EPO effect is absent in IFNγR−/− PerC cells. Left to right, C57BL/6J PerC cells with anti-CD3, anti-CD3 + 100 ng/ml EPO; IFNγR−/−cells with anti- CD3, anti-CD3 + 100 ng/ml EPO. Panel C: EPO effect is absent in iNOS−/− PerC cells. Left to right, C57BL/6J PerC cells with anti-CD3, anti-CD3 + 100 ng/ml EPO; iNOS−/−cells with anti-CD3, anti-CD3 + 100 ng/ml EPO.
3.5 PerC T cell suppression correlates with increased NO production
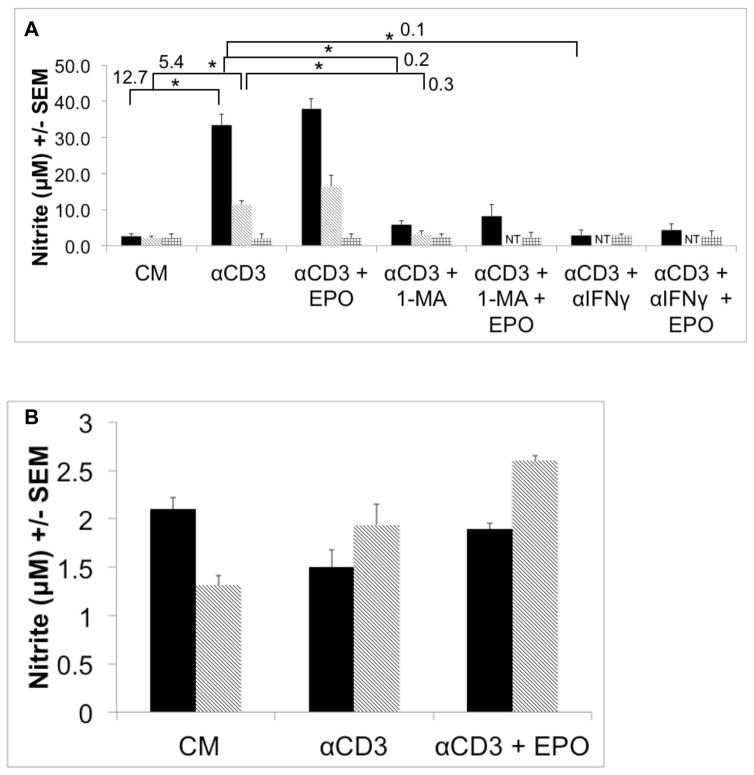
If EPO acts through the iNOS pathway, increased nitrite production, an indicator of iNOS activity, would be anticipated. Consistent with each strain’s cytokine biology and suppression profile, CD3 ligation of C57BL/6J PerC T cells resulted in significantly more nitrite production than BALB/c PerC T cells (Fig. 5A). Genetic (iNOS−/−, IFNγR−/−) or pharmacologic ablation of IFNγ signaling or iNOS activity limited nitrite production (Fig. 5A, not shown). SP cell cultures, due to their low macrophage composition, produced low levels of nitrite (Fig. 5B, note scale). Overall, nitrite production was consistent with the degree of macrophage-induced T cell suppression seen with these strains and cell sources. Although not statistically significant, exogenous EPO consistently increased nitrite production under all conditions tested.
Figure 5. PerC T cell suppression correlates with increased NO production.
Panel A: Left to right, C57BL/6J, BALB/c and iNOS−/−PerC cells were cultured as indicated. NT = not tested. Panel B: Left to right, C57BL/6J and BALB/c SP cells were cultured as shown. Nitrite was detected at 48 hours ex vitro using Griess Reagent.
3.6 EPO-mediated suppression is detectable by water-soluble tetrazolium assay
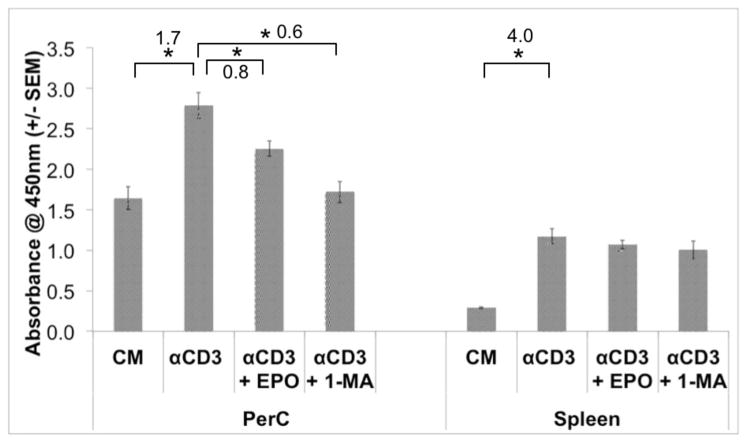
As a third measure of the impact of EPO on PerC T cell proliferation a water-soluble tetrazolium dye assay was conducted. This method quantifies cellular metabolism by measuring NADH release and recently was shown to measure superoxide production by activated phagocytes [50,51]. Interestingly, in the absence of T cell activation, PerC cells had greater absorbance than SP cells (Fig. 6). However, following CD3 ligation, SP cell cultures had the greater increase in absorbance (4- vs 1.7-fold increase in absorbance) consistent with results seen with tritiated thymidine (3H-TdR) proliferation assays. EPO reduced absorbance in PerC but not SP cell cultures. However, when suppression was blocked with 1-MA (or anti-IFNγ, not shown) absorbance decreased in PerC cell culture. As observed with 3H-TdR incorporation, there was no EPO effect with SP cells. This difference likely reflects 1-MA reducing NO production, a likely contributor to the higher, baseline-level of dye absorbance observed with PerC cells [50].
Figure 6. EPO mediated suppression is detectable by TetraZ™assay.
TetraZ™ was used to measure C57BL/6J PerC and Spleen cell proliferation 48 hours ex vitro. Cell concentrations at 1.5 ×10⁵ cells/well.
3.7 EPO suppresses both CD4+ and CD8+ T cell activation
Regardless of tissue source, T cells are heterogeneous in phenotype and function and thus likely to differ in their response to suppressive conditions. To assess potential differences in the susceptibility of PerC T cell subsets to suppression, CFSE dye-dilution and multiparameter flow cytometry were deployed to study PerC CD4+ and CD8+ T cell responses to CD3 ligation.
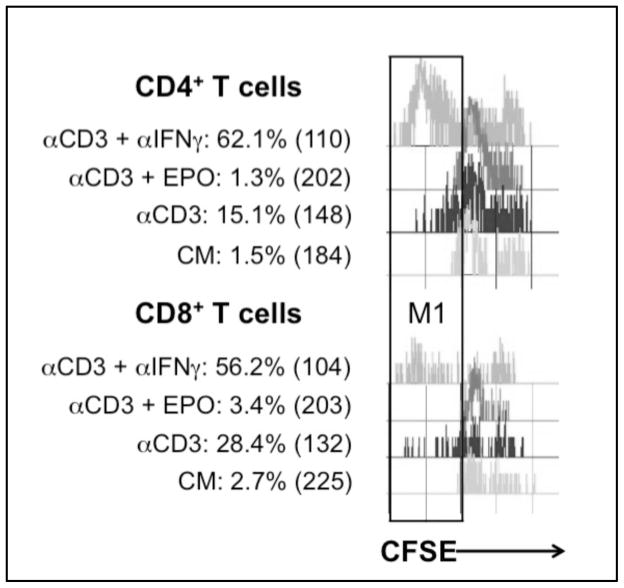
Limited division of both CD4+ and CD8+ T cells was observed with a similar increase (~10.5-fold for CD3 ligation relative to the unstimulated/CM control) in the relative percentage of cells (Fig. 7). CD4+ cells had a greater response than CD8+ cells (4.0- vs 2.1-fold) when suppression was blocked by IFNγ neutralization. EPO increased suppression of both subsets and modestly limited CD4+ cells more than CD8+ cells (9% vs 12 % of the control response). These results serve to illustrate that suppression impacts both PerC T cell subsets and validate that EPO increases suppression.
Figure 7. Effect of EPO on CD4+ and CD8+ T cell proliferation.
CD4+ and CD8+ T cell proliferation is suppressed by EPO. Percent of cells in M1 gate and CFSE MFI values are indicated on figure. Figure representative of 4 separate experiments.
3.8 EPOR expression by cultured PerC macrophages
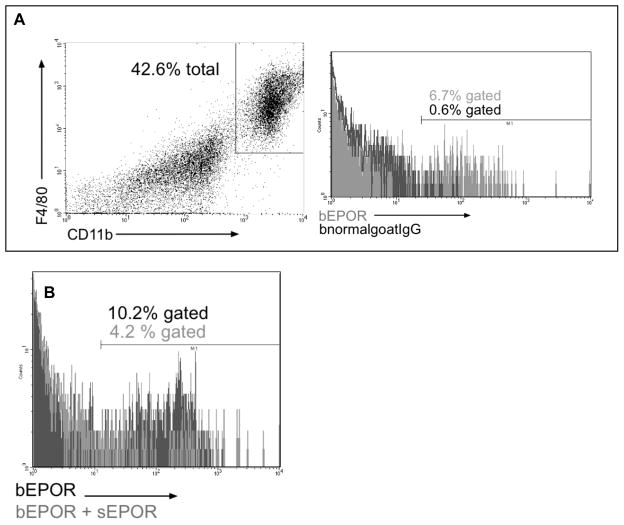
Although prior research has shown that murine macrophages express the EPOR [38,52] none of this work assessed resident macrophages following short-term culture. Western blot and flow cytometry were conducted to assess EPOR expression by PerC cells ex vitro. The anticipated 72 kD band was observed for cultured PerC cells and the intensity increased with CD3 ligation; the EPOR was not detected in cultured SP cells (Fig. 8). Identical results were seen with 2 different polyclonal antibodies, both of which bound a soluble form of the EPOR (sEPOR) control (not shown). FACS analysis of ex vitro C57BL/6J PerC cells detected the EPOR on F4/80+, CD11b+ macrophages and specificity was validated by the reduction in staining when sEPOR was used as competitive inhibitor (Figs. 9A, 9B). The percentage of macrophages expressing the EPOR increased with culture duration; the EPOR was also detectable inside macrophages (not shown). These findings confirm that macrophages express the EPOR and are noteworthy in that they validate that EPO can play a role in increasing immune suppression in myeloid-rich TMEs.
Figure 8. PerC cell expression of EPOR.
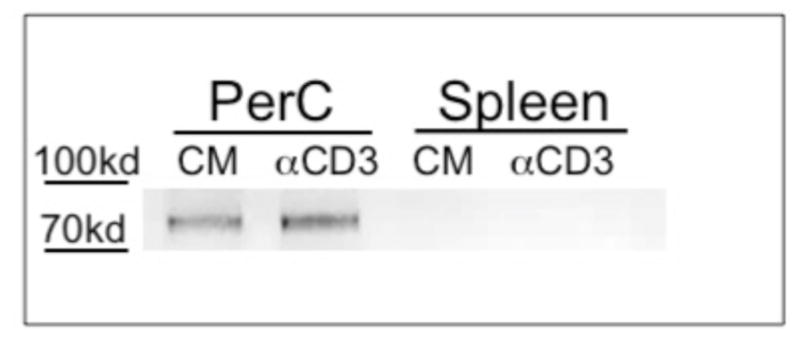
Western blot analysis of EPOR expression by cultured PerC and SP cells.
Figure 9. FACS analysis of EPOR expression by PerC macrophages.
CD11bhi F4/80hi PerC macrophages express the EPOR (Panel A). Soluble EPOR reduces EPOR staining validating specificity of EPOR detection (Panel B). Figures are representative of 3 experiments.
4. Discussion
The results reported here demonstrate that EPO increases macrophage-mediated T cell suppression in PerC cell cultures that mimic the high M:L ratios found within TMEs. Tritiated thymidine incorporation, CFSE dye dilution and tetrazolium dye reduction by TCR/CD3ε ligated C57BL/6J PerC T cells were reduced in the presence of EPO. In contrast, EPO had no effect in C57BL/6J SP cell cultures which lack the high M:L ratio found in PerC cell culture [42]. Although less susceptible to suppression, BALB/c (Th2/IL4; “pro-humoral immunity”) PerC T cell activation was also reduced by EPO. Inhibition of iNOS activity with 1-methyl arginine (1-MA) negated the reduced response seen with EPO. Likewise, EPO had no effect in cultures where suppression was neutralized by gene deletion of iNOS or the cytokine signaling pathway (IFNγR−/−) that promotes iNOS expression [11]. Thus EPO appears to temper inflammation by increasing macrophage iNOS activity in environments with high representation of these cells.
The consistency by which PerC T cell activation was reduced across assays validates that EPO can temper adaptive immunity. Reduced CD4+ T cell activation is particularly important, as these cells are key initiators of the adaptive immune response. EPO has been shown to temper innate immunity, notably the response of activated macrophages to LPS [16,53]. Since tetrazolium dye reduction occurs outside of cells it not only measures NADH release but also free radical (ROS, RNS) production associated with the macrophage respiratory burst [50,51]. This might explain why blocking iNOS activity, which tempers the respiratory burst, did not optimize tetrazolium dye reduction. Genetic ablation of NADPH oxidase activity (gp91−/−), another key component of the respiratory burst, led to results similar to that of wild type PerC cells suggesting that EPO acts specifically through iNOS (not shown). Overall these data illustrate that EPO can restrain key initiation points of both the adaptive and innate arms of the immune system.
A modest increase in nitric oxide (NO) production, was consistently found with EPO addition. Prior work has shown that EPO increases NO production in endothelial cells and their progenitors and increases iNOS expression in granulation tissue during wound healing [52,54,55]. Conversely, EPO reduces NO production by thioglycollate-elicited (activated) macrophages stimulated by LPS, a result also seen in LPS-stimulated PerC cell cultures (not shown) [16]. Such differences likely reflect direct activation of macrophages by LPS (TLR4 ligation) versus indirect activation by IL1, TNFα, and IFNγ released following T cell activation. Compared with LPS-treated PerC cells, CD3-treated cells had more iNOS protein (not shown). Either pathway can activate macrophages to increase iNOS activity for either pro- or anti-inflammatory purposes, the outcome depending upon time (duration) and context (antigen type/concentration, cellular composition). It is important to consider that culture constraints fail to ideally mimic TMEs and their metabolic signature of persistent inflammation [56].
Consistent with prior studies of myeloid lineage cells, F4/80+ CD11b+ PerC macrophages had detectable EPOR expression by both Western Blot and FACS analysis [16,38,39,52,53]. EPOR expression increased with culture duration reflecting the cellular stress/hypoxia seen in other models [52,55]. Although most of the protein exists in intracellular form, Western blot failed to reveal the EPOR in SP cells [30,57]. An alternative form of the EPOR, a dimer of the common beta chain (βC, CD131, IL3RB) with an EPOR monomer, was not observed on PerC cells even though, each molecule was individually detectable on cultured PerC macrophages [58]. CD131 is most often found as a co-receptor with the cytokine-specific subunits GM-CSFα/CD116/CSFR2α, IL-3Rα/CD123, or CD125/IL-5Rα [59]. Interestingly, we have previously shown that addition of GM-CSF or IL-3 to PerC cell culture also restrains T cell activation [43]. Perhaps the “supercomplex” of IL3, GM-CSF and EPO receptors that regulates erythropoiesis also tempers inflammation [58]. Since the expression of myeloid markers (Class II MHC, B7.1/CD80, B7.2/CD86, B7H1/PDL1/CD274) associated with controlling T cell activation was not impacted by EPO, it is likely that signaling impacts iNOS activity.
The concentration of EPO (15 mU or 100 ng/ml) used in these studies was within the normal physiologic range (3–32 mU/ml or 20–213 ng/ml) reported for this molecule [60,61]. Anemic cancer patients are treated with EPO injection regimens ranging from 150 U (1 ug) /kg thrice weekly to 40,000 U (267 ug) /kg weekly with treatment lasting a minimum of 4 weeks to foster detectable increases in hemoglobin production [62]. Short term, pre-clinical carcinoma models following similar dosing schedules have shown that EPO can accelerate pathology [63,64]. Considering that certain carcinomas can produce EPO in response to hypoxia it is possible that EPO concentrations within TMEs are even higher [52,53,65].
PerC cell culture can serve as an in vitro screening system that mimics a key feature of TMEs, i.e. high macrophage to T cell ratios that promote T cell suppression. Initially thought to be a key component of anti-tumor immunity, macrophages have been found to foster immune evasion and metastasis [6–8]. Our findings show that EPO enhances macrophage suppression demonstrating an additional pathway by which the immune system can be co-opted by cancer. Since EPO can act directly on cells of the immune system these observations are also pertinent to pathologies where tempering myeloid cells would be a clinical objective [26].
Highlights.
Peritoneal cell culture can model macrophage-rich tumor microenvironments (TMEs)
iNOS expression by peritoneal cavity macrophages suppresses T cell activation
Erythropoietin increases macrophage-mediated T cell suppression
EPO could directly promote tumor progression via EPOR-expressing macrophages
Acknowledgments
This research was supported by the NIH AREA program (R15 AI 060356-01, R15 CA 136901-01). M.A. Wood was supported by a Rider University Undergraduate Research Scholar Award. We are grateful to E. Lomakova, and G. Torres for mouse husbandry.
Abbreviations
- EPO
erythropoietin
- EPOR
erythropoietin receptor
- iNOS
inducible nitric oxide synthase
- PerC
peritoneal cavity
- 1-MA
NG-monomethyl-L-arginine
Footnotes
Publisher's Disclaimer: This is a PDF file of an unedited manuscript that has been accepted for publication. As a service to our customers we are providing this early version of the manuscript. The manuscript will undergo copyediting, typesetting, and review of the resulting proof before it is published in its final citable form. Please note that during the production process errors may be discovered which could affect the content, and all legal disclaimers that apply to the journal pertain.
References
- 1.Mittal D, Gubin MM, Schreiber RD, Smyth MJ. New insights into cancer immunoediting and its three component phases--- elimination, equilibrium, escape. Curr Opin Immunol. 2014;27:16–25. doi: 10.1016/j.coi.2014.01.004. [DOI] [PMC free article] [PubMed] [Google Scholar]
- 2.Murdoch C, Muthana M, Coffelt SB, Lewis CE. The role of myeloid cells in the promotion of tumor angiogenesis. Nat Rev Cancer. 2008;8:618–631. doi: 10.1038/nrc2444. [DOI] [PubMed] [Google Scholar]
- 3.Coffelt SB, Hughes R, Lewis CE. Tumor-associated macrophages: effectors of angiogenesis and tumor progression. Biochim Biophys Acta. 2009;1796:11–18. doi: 10.1016/j.bbcan.2009.02.004. [DOI] [PubMed] [Google Scholar]
- 4.Horowitz JR, Rivard A, van der Zee R, Hariawala M, Sheriff DD, Esakof DD, Chaudhry GM, Symes JF, Isner JM. Vascular endothelial growth factor/vascular permeability factor produces nitric oxide-dependent hypotension. Evidence for a maintenance role in quiescent adult endothelium. Arterioscler Thromb Vasc Biol. 1997;17:2793–2800. doi: 10.1161/01.atv.17.11.2793. [DOI] [PubMed] [Google Scholar]
- 5.Dvorak HF. Tumors: wounds that do not heal-redux. Cancer Immunol Res. 2015;315:1650–1659. doi: 10.1158/2326-6066.CIR-14-0209. [DOI] [PMC free article] [PubMed] [Google Scholar]
- 6.Dirkx AE, Oude Egbrink MG, Wagstaff J, Griffioen AW. Monocyte/macrophage infiltration in tumors: modulators of angiogenesis. J Leukoc Biol. 2006;80:1183–1196. doi: 10.1189/jlb.0905495. [DOI] [PubMed] [Google Scholar]
- 7.Ruffell B, Couesens LM. Macrophages and therapeutic resistance in cancer. Cancer Cell. 2015;27:462–472. doi: 10.1016/j.ccell.2015.02.015. [DOI] [PMC free article] [PubMed] [Google Scholar]
- 8.Cotechini T, Medler TR, Couessens LM. Myeloid cells as targets for therapy in solid tumors. J Cancer. 2015;4:343–350. doi: 10.1097/PPO.0000000000000132. [DOI] [PMC free article] [PubMed] [Google Scholar]
- 9.Ellis LM, Hicklin DJ. VEGF-targeted therapy: mechanisms of anti-tumour activity. Nat Rev Cancer. 2008;8:579–591. doi: 10.1038/nrc2403. [DOI] [PubMed] [Google Scholar]
- 10.Kelly PM, Davison RS, Bliss E, McGee JO. Macrophages in human breast disease: a quantitative immunohistochemical study. Br J Cancer. 1988;57:174–177. doi: 10.1038/bjc.1988.36. [DOI] [PMC free article] [PubMed] [Google Scholar]
- 11.Mills CD. Macrophage arginine metabolism to ornithine/urea or nitric oxide/citrulline: a life or death issue. Crit Rev Immunol. 2001;21:399–425. [PubMed] [Google Scholar]
- 12.Pollard JJW. Tumor-educated macrophages promote tumor progression and metastasis. Nat Rev Cancer. 2004;4:71–78. doi: 10.1038/nrc1256. [DOI] [PubMed] [Google Scholar]
- 13.Stockmann C, Doedens A, Weidemann A, Zhang N, Takeda N, Greenberg JI, Cheresh DA, Johnson RS. Deletion of vascular endothelial growth factor in myeloid cells accelerates tumorigenesis. Nature. 2008;456:814–818. doi: 10.1038/nature07445. [DOI] [PMC free article] [PubMed] [Google Scholar]
- 14.De Maria RR, Testa U, Luchetti L, Zeuner A, Stassi G, Pelosi E, Riccioni R, Felli N, Samoggia P, Peschle C. Apoptotic role of Fas/Fas ligand system in the regulation of erythropoiesis. Blood. 1999;93:796–803. [PubMed] [Google Scholar]
- 15.Liu Y, Pop R, Sadegh C, Brugnara C, Haas VH, Socolovsky M. Suppression of Fas-FasL coexpression by erythropoietin mediates erythroblast expansion during the erythropoietic stress response in vivo. Blood. 2006;108:123–133. doi: 10.1182/blood-2005-11-4458. [DOI] [PMC free article] [PubMed] [Google Scholar]
- 16.Nairz M, Schroll A, Moschen AR, Sonnweber T, Theurl M, Theurl I, Taub N, Jamnig C, Neurauter D, Huber LA, Tilg H, Moser PL, Weiss G. Erythropoietin contrastingly affects bacterial infection and experimental colitis by inhibiting nuclear factor-k-B-inducible immune pathways. Immunity. 2011;34:61–74. doi: 10.1016/j.immuni.2011.01.002. [DOI] [PMC free article] [PubMed] [Google Scholar]
- 17.Eschbach JW, Egrie JC, Downing MR, Browne JK, Adamson JW. Correction of the anemia of end-stage renal disease with recombinant human erythropoietin. Results of a combined phase I and II clinical trial. N Engl J Med. 1987;316:73–8. doi: 10.1056/NEJM198701083160203. [DOI] [PubMed] [Google Scholar]
- 18.Crawford J. Erythropoietin: high profile, high security. J Clin Oncol. 2007;25:1021–1023. doi: 10.1200/JCO.2006.08.8153. [DOI] [PubMed] [Google Scholar]
- 19.Sytkowski AJ. Does erythropoietin have a dark side? Epo signaling and cancer cells. Sci STKE. 2007;395:pe38. doi: 10.1126/stke.3952007pe38. [DOI] [PubMed] [Google Scholar]
- 20.Broxmeyer HE. Erythropoietin surprises: an immune saga. Immunity. 2011;34:6–7. doi: 10.1016/j.immuni.2011.01.004. [DOI] [PubMed] [Google Scholar]
- 21.Dicato M, Plawny L. Erythropoietin in cancer patients: pros and cons. Curr Opin Oncol. 2010;22:307–311. doi: 10.1097/CCO.0b013e32833aa9de. [DOI] [PubMed] [Google Scholar]
- 22.Glaspy J, Crawford J, Vansteenkiste J, Henry D, Rao S, Bowers JA, Berlin P, Tomita D, Bridges K, Ludwig H. Erythropoiesis-stimulating agents in oncology: a study-level meta-analysis of survival and other safety outcomes. Br J Cancer. 2010;102:301–315. doi: 10.1038/sj.bjc.6605498. [DOI] [PMC free article] [PubMed] [Google Scholar]
- 23.Rizzo JD, Brouwers M, Hurley P, Seidenfeld J, Arcasoy MO, Spivak JL, Bennett CL, Bohlius J, Evanchuk D, Goode MJ, Jakubowski AA, Regan DH, Somerfield MR American Society of Hematology and the American Society of Clinical Oncology Practice Guideline Update Committee. American Society of Hematology/American Society of Clinical Oncology clinical practice guideline update on the use of epoetin and darbepoetin in adult patients with cancer. Blood. 2010;116:4045–4059. doi: 10.1182/blood-2010-08-300541. [DOI] [PubMed] [Google Scholar]
- 24.Ribatti D. Erythropoietin and tumor angiogenesis. Stem Cells Dev. 2010;19:1–4. doi: 10.1089/scd.2009.0402. [DOI] [PubMed] [Google Scholar]
- 25.Ohm JE, Carbone DP. VEGF as a mediator of tumor–associated immunodeficiency. Immunol Res. 23:263. doi: 10.1385/IR:23:2-3:263. [DOI] [PubMed] [Google Scholar]
- 26.Brines M, Cerami A. Erythropoietin-mediated tissue protection: reducing collateral damage from the primary injury response. J Intern Med. 2008;264:405–432. doi: 10.1111/j.1365-2796.2008.02024.x. [DOI] [PubMed] [Google Scholar]
- 28.Jeong JY, Feldman L, Solar P, Szenajch J, Sytkowski AJ. Characterization of erythropoietin receptor and erythropoietin expression and function in human ovarian cancer cells. Int J Cancer. 2008;122:274–280. doi: 10.1002/ijc.23068. [DOI] [PubMed] [Google Scholar]
- 29.Elliott S, Busse L, McCaffery I, Rossi J, Sinclair A, Spahr C, Swift S, Begley CG. Identification of a sensitive anti-erythropoietin receptor monoclonal antibody allows detection of low levels of EpoR in cells. J Immunol Methods. 2009;352:126–139. doi: 10.1016/j.jim.2009.10.006. [DOI] [PubMed] [Google Scholar]
- 30.Elliott S, Sinclair A, Collins H, Rice L, Jelkmann W. Progress in detecting cell-surface protein receptors: the erythropoietin receptor example. Ann Hematol. 2014;93:181–192. doi: 10.1007/s00277-013-1947-2. [DOI] [PMC free article] [PubMed] [Google Scholar]
- 31.Paragh G, Kumar SM, Rakosy Z, Choi SC, Xu X, Acs G. RNA interference-mediated inhibition of erythropoietin receptor expression suppresses tumor growth and invasiveness in A2780 ovarian carcinoma cells. Am J Pathol. 2009;174:1504–1514. doi: 10.2353/ajpath.2009.080592. [DOI] [PMC free article] [PubMed] [Google Scholar]
- 32.Jelkmann W. Erythropoietin: back to basics. Blood. 2010;115:4151–4152. doi: 10.1182/blood-2010-03-271395. [DOI] [PubMed] [Google Scholar]
- 33.Sinclair AM, Coxon A, McCaffery I, Kaufman S, Paweletz K, Liu L, Busse L, Swift S, Elliott S, Begley CG. Functional erythropoietin receptor is undetectable in endothelial, cardiac, neuronal, and renal cells. Blood. 2010;115:4264–4272. doi: 10.1182/blood-2009-10-248666. [DOI] [PubMed] [Google Scholar]
- 34.Swift S, Ellison AR, Kassner P, McCaffery I, Rossi J, Sinclair AM, Begley CG, Elliott S. Absence of functional EpoR expression in human tumor cell lines. Blood. 2010;115:4254–4263. doi: 10.1182/blood-2009-10-248674. [DOI] [PubMed] [Google Scholar]
- 35.Maxwell P, Melendez-Rodriguez F, Matchett KB, Aragones J, Ben-Califa N, Jaekel H, Hengst L, Lindner H, Bernardini A, Brockmeier U, Fandrey J, Grunert F, Oster HS, Mittelman M, El-Tanani M, Thiersch M, Schneider Gasser EM, Gasserman M, Dangoor D, Cuthbert RJ, Irvine A, Jordan A, Lappin T, Thompson J, Neumann D. Novel antibodies directed against the human erythropoietin receptor: creating a basis for clinical implementation. Br J Haematol. 2015;168:429–442. doi: 10.1111/bjh.13133. [DOI] [PubMed] [Google Scholar]
- 36.Prutchi Sagiv S, Lifshitz L, Orkin R, Mittelman M, Neumann D. Erythropoietin effects on dendritic cells: potential mediators in its function as an immunomodulator? Exp. Hematol. 2008;36:1682–1690. doi: 10.1016/j.exphem.2008.07.010. [DOI] [PubMed] [Google Scholar]
- 37.Lifshitz L, Prutchi Sagiv S, Avneon M, Gassmann M, Mittelman M, Neumann D. Non-erythroid activities of erythropoietin: functional effects on murine dendritic cells. Mol Immunol. 2010;46:713–721. doi: 10.1016/j.molimm.2008.10.004. [DOI] [PubMed] [Google Scholar]
- 38.Lifshitz L, Tabak G, Gassmann M, Mittelman M, Neumann D. Macrophages as novel targets for erythropoietin. Haematologica. 2010;95:1823–1831. doi: 10.3324/haematol.2010.025015. [DOI] [PMC free article] [PubMed] [Google Scholar]
- 39.Lisowska K, Debska-Slizien A, Bryl E, Rutkowski B, Witkowski J. Erythropoietin receptor is expressed on human peripheral blood T and B lymphocytes and monocytes and is modulated by recombinant human erythropoietin treatment. Artif Organs. 2010;34:654–662. doi: 10.1111/j.1525-1594.2009.00948.x. [DOI] [PubMed] [Google Scholar]
- 40.Lisowska K, Bryl E, Witkowski J. Erythropoietin receptor is detectable on peripheral blood lymphocytes and its expression increases in activated T lymphocytes. Haematologica. 2011;96:e12–e13. doi: 10.3324/haematol.2010.038414. [DOI] [PMC free article] [PubMed] [Google Scholar]
- 41.Matlack R, Yeh K, Rosini L, Gonzalez D, Taylor J, Silberman D, Pennello A, Riggs J. Peritoneal macrophages suppress T-cell activation by amino acid catabolism. Immunology. 2006;117:386–395. doi: 10.1111/j.1365-2567.2005.02312.x. [DOI] [PMC free article] [PubMed] [Google Scholar]
- 42.Composto G, Gonzalez D, Bucknum A, Silberman D, Taylor J, Kozlowski M, Bloomfield T, Bartlett T, Riggs J. Peritoneal T lymphocyte regulation by macrophages. Immunobiology. 2011;216:256–264. doi: 10.1016/j.imbio.2010.04.002. [DOI] [PMC free article] [PubMed] [Google Scholar]
- 43.Silberman D, Bucknum A, Kozlowski M, Matlack R, Riggs J. Cytokine treatment of macrophage suppression of T cell activation. Immunobiology. 2010;215:70–80. doi: 10.1016/j.imbio.2009.01.015. [DOI] [PMC free article] [PubMed] [Google Scholar]
- 44.Silberman D, Bucknum A, Bartlett T, Composto G, Kozlowski M, Walker A, Werda A, Cua J, Sharpe AH, Somerville JE, Riggs J. CD28 ligation increases macrophage suppression of T-cell proliferation. Cell Mol Immunol. 2012;9:341–349. doi: 10.1038/cmi.2012.13. [DOI] [PMC free article] [PubMed] [Google Scholar]
- 45.Motz GT, Coukos G. The parallel lives of angiogenesis and immunosuppression: cancer and other tales. Nat Rev Immunol. 2011;11:702–711. doi: 10.1038/nri3064. [DOI] [PubMed] [Google Scholar]
- 46.Grohmann U, Fallarino F, Puccetti P. Tolerance, DCs and tryptophan: much ado about IDO. Trends Immunol. 2003;24:242–248. doi: 10.1016/s1471-4906(03)00072-3. [DOI] [PubMed] [Google Scholar]
- 47.Rocchetta F, Solini S, Mister M, Mele C, Cassis P, Noris M, Remuzzi G, Aiello S. Erythropoietin enhances immunostimulatory properties of immature dendritic cells. Clin Exp Immunol. 2011;165:202–210. doi: 10.1111/j.1365-2249.2011.04417.x. [DOI] [PMC free article] [PubMed] [Google Scholar]
- 48.Cravedi P, Manrique J, Hanlon KE, Reid-Adam J, Brody J, Prathuangsuk P, Mehrotra A, Heeger PS. Immunosuppressive effects of erythropoietin on human alloreactive T cells. J Am Soc Nephrol. 2014;25:2003–2015. doi: 10.1681/ASN.2013090945. [DOI] [PMC free article] [PubMed] [Google Scholar]
- 49.Mosmann TR, Cherwinski H, Bond MW, Giedlin MA, Coffman RL. Two types of murine helper T cell clone. I Definition according to profiles of lymphokine activities and secreted proteins. 1986. J Immunol. 2005;175:5–14. [PubMed] [Google Scholar]
- 50.Tan AS, Berridge MV. Superoxide produced by activated neutrophils efficiently reduces the tetrazolium salt, WST-1 to produce a soluble formazan: a simple colorimetric assay for measuring respiratory burst activation and for screening anti-inflammatory agents. J Immunol Methods. 2000;238:59–68. doi: 10.1016/s0022-1759(00)00156-3. [DOI] [PubMed] [Google Scholar]
- 51.Berridge MV, Herst PM, Tan AS. Tetrazolium dyes as tools in cell biology: new insights into their cellular reduction. Biotechnol Annu Rev. 2005;11:127–152. doi: 10.1016/S1387-2656(05)11004-7. [DOI] [PubMed] [Google Scholar]
- 52.Haroon ZA, Amin K, Jiang X, Arcasoy MO. A novel role for erythropoietin during fibrin-induced wound-healing response. Am J Pathol. 2003;163:993–1000. doi: 10.1016/S0002-9440(10)63459-1. [DOI] [PMC free article] [PubMed] [Google Scholar]
- 53.Nairz MM, Sonnweber T, Schroll A, Theurl I, Weiss G. The pleiotropic effects of erythropoietin in infection and inflammation. Microbes Infect. 2012;14:238–246. doi: 10.1016/j.micinf.2011.10.005. [DOI] [PMC free article] [PubMed] [Google Scholar]
- 54.Sautina L, Sautin Y, Beem E, Zhou Z, Schuler A, Brennan J, Zharikov S, Diao Y, Bungert J, Segal M. Induction of nitric oxide by erythropoietin is mediated by the {beta} common receptor and requires interaction with the VEGF receptor 2. Blood. 2010;115:896–905. doi: 10.1182/blood-2009-04-216432. [DOI] [PubMed] [Google Scholar]
- 55.Beleslin-Cokic BB, Cokic VP, Wang L, Piknova B, Teng R, Schechter AN, Noguchi CT. Erythropoietin and hypoxia increase erythropoietin receptor and nitric oxide levels in lung microvascular endothelial cells. Cytokine. 2011;54:129–135. doi: 10.1016/j.cyto.2011.01.015. [DOI] [PMC free article] [PubMed] [Google Scholar]
- 56.Biswas SK, Sica A, Lewis CE. Plasticity of macrophage function during tumor progression: regulation by distinct molecular mechanisms. J Immunol. 2008;180:2011–2017. doi: 10.4049/jimmunol.180.4.2011. [DOI] [PubMed] [Google Scholar]
- 57.Huang LJ, Constantinescu SN, Lodish HF. The N-terminal domain of Janus kinase 2 is required for Golgi processing and cell surface expression of erythropoietin receptor. Mol Cell. 2001;8:1327–1338. doi: 10.1016/s1097-2765(01)00401-4. [DOI] [PubMed] [Google Scholar]
- 58.Jubinsky PT, Krijanovski OI, Nathan DG, Tavernier J, Sieff CA. The beta chain of the interleukin-3 receptor functionally associates with the erythropoietin receptor. Blood. 1997;90:1867–1873. [PubMed] [Google Scholar]
- 59.Broxmeyer HE. Erythropoietin: multiple targets, actions, and modifying influences for biological and clinical consideration. J Exp Med. 2013;210:205–208. doi: 10.1084/jem.20122760. [DOI] [PMC free article] [PubMed] [Google Scholar]
- 60.Jelkman W. Regulation of erythropoietin production. J Physiol. 2011;589:1251–1258. doi: 10.1113/jphysiol.2010.195057. [DOI] [PMC free article] [PubMed] [Google Scholar]
- 61.Owen WE, Roberts WL. Performance characteristics of a new Immulite (®) 2000 system erythropoietin assay. Clin Chim Acta. 2011;412:480–482. doi: 10.1016/j.cca.2010.11.023. [DOI] [PubMed] [Google Scholar]
- 62.http://assets.procrit.com/shared/product/procrit/procrit-prescribing-information.pdf
- 63.Lee AS, Kim DH, Lee JE, Jung YJ, Kang KP, Lee S, Park SK, Kwak JY, Lee SY, Lim ST, Sung MJ, Yoon SR, Kim W. Erythropoietin induces lymph node lymphangioenesis and lymph node tumor metastasis. Cancer Res. 2011;71:4506–4517. doi: 10.1158/0008-5472.CAN-10-3787. [DOI] [PubMed] [Google Scholar]
- 64.Okazaki T, Ebihara S, Asada M, Yamanda S, Niu K, Arai H. Erythropoietin promotes the growth of tumors lacking its receptor and decreases survival of tumor-bearing mice by enhancing angiogenesis. Neoplasia. 2008;10:932–939. doi: 10.1593/neo.08140. [DOI] [PMC free article] [PubMed] [Google Scholar]
- 65.Yoshioka K, Thompson J, Miller MJ, Fisher JW. Inducible nitric oxide synthase expression and erythropoietin production in human hepatocellular carcinoma cells. Biochem Biophys Res Commun. 1997;232:702–706. doi: 10.1006/bbrc.1997.6323. [DOI] [PubMed] [Google Scholar]


