

The authors' hypothesis is that incorporating bidirectional contrast agent transport into the DSC MR imaging signal model will improve rCBV estimates in brain tumors. A unidirectional contrast agent extravasation model (Boxerman-Weisskoff) was compared with a bidirectional contrast agent exchange model. For both models, they compared the goodness of fit with the parent leakage-contaminated relaxation rate curves and the difference between modeled interstitial relaxation rate curves and dynamic contrast-enhanced MR imaging in 21 patients with glioblastoma. The authors conclude that the bidirectional model more accurately corrects for the T1 or T2* enhancement arising from contrast agent extravasation due to blood-brain barrier disruption in high-grade gliomas by incorporating interstitial washout rates into the DSC MR imaging relaxation rate model.
Abstract
BACKGROUND AND PURPOSE:
Contrast agent extravasation through a disrupted blood-brain barrier potentiates inaccurate DSC MR imaging estimation of relative CBV. We explored whether incorporation of an interstitial washout rate in a leakage-correction model for single-echo, gradient-echo DSC MR imaging improves relative CBV estimates in high-grade gliomas.
MATERIALS AND METHODS:
We modified the traditional model-based postprocessing leakage-correction algorithm, assuming unidirectional contrast agent extravasation (Boxerman-Weisskoff model) to account for bidirectional contrast agent exchange between intra- and extravascular spaces (bidirectional model). For both models, we compared the goodness of fit with the parent leakage-contaminated relaxation rate curves by using the Akaike Information Criterion and the difference between modeled interstitial relaxation rate curves and dynamic contrast-enhanced MR imaging by using Euclidean distance in 21 patients with glioblastoma multiforme.
RESULTS:
The bidirectional model had improved Akaike Information Criterion versus the bidirectional model in >50% of enhancing tumor voxels in all 21 glioblastoma multiformes (77% ± 9%; P < .0001) and had reduced the Euclidean distance in >50% of enhancing tumor voxels for 17/21 glioblastoma multiformes (62% ± 17%; P = .0041). The bidirectional model and dynamic contrast-enhanced-derived kep demonstrated a strong correlation (r = 0.74 ± 0.13). On average, enhancing tumor relative CBV for the Boxerman-Weisskoff model exceeded that for the bidirectional model by 16.6% ± 14.0%.
CONCLUSIONS:
Inclusion of the bidirectional exchange in leakage-correction models for single-echo DSC MR imaging improves the model fit to leakage-contaminated DSC MR imaging data and significantly improves the estimation of relative CBV in high-grade gliomas.
The most common DSC MR imaging metric in neuro-oncology is relative CBV (rCBV),1 which has been used for grading gliomas,2,3 predicting low-grade to high-grade transformation,4,5 distinguishing recurrent tumor from pseudoprogression,6,7 differentiating tumor regression from pseudoresponse,8 and assessing overall treatment response.9,10 Relative CBV is typically calculated by integrating the dynamic first-pass change in the transverse relaxation rate (ΔR2*) resulting from bolus injection of a gadolinium-based contrast agent, which transiently causes a dose-dependent change in the magnetic susceptibility of blood.11 This technique mimics the classic indicator-dilution theory,12 which assumes intravascular compartmentalization of injected contrast agent “tracer.” However, common gadolinium-based contrast agents extravasate in lesions with blood-brain barrier disruption,13 including malignant gliomas. The exchange of contrast agent between the intravascular and the extravascular extracellular space, which is the objective measurement in dynamic contrast-enhanced (DCE) MR imaging,14–16 contaminates the desired DSC MR imaging signal, depending on pulse sequence parameters and underlying tumor biology.17
A popular model-based DSC MR imaging leakage-correction method proposed by Weisskoff and Boxerman2,18,19 linearly fits measured ΔR2*(t) to 2 constant functions derived from the average relaxation rate in nonenhancing tissue, one of which is permeability-weighted. Deviation from the reference function is used to derive corrected rCBV for each voxel. A limiting assumption of this approach is that contrast agent reflux from the interstitial space back to blood plasma is negligible within the time frame of DSC MR imaging signal acquisition (∼2 minutes). However, standard models quantifying contrast agent exchange between blood plasma and the interstitium (ie, DCE MR imaging14) use 2-compartment pharmacokinetics to account for bidirectional transport of contrast agent. We hypothesized that incorporating bidirectional contrast agent transport into the original DSC MR imaging signal model improves rCBV estimates in brain tumors. To test this hypothesis, we compared model-based DSC MR imaging leakage-correction methods with and without consideration of bidirectional transport by using simulations and clinical application to high-grade gliomas.
Materials and Methods
Patients
We studied 24 sequential patients with histologically proved glioblastoma multiforme (GBM) treated with maximal surgical resection followed by radiation therapy and concurrent temozolomide and both DSC MR imaging and DCE MR imaging performed at initial tumor progression. Of these, 2 patients illustrated no bolus of contrast during the DSC acquisition and 1 DSC dataset was corrupted by significant motion. Thus, 21 patients (15 men; mean age, 54 years; range, 30–73 years) were included in the final cohort. Progression was defined prospectively by the treating neuro-oncologists if subsequent scans showed >2 sequential months of increasing contrast enhancement and worsening mass effect or evidence of neurologic decline. Specifically, progression was defined as ≥25% increase in the sum of enhancing lesion volumes, new enhancing lesions of >1 cm in maximum dimension, an unequivocal qualitative increase in nonenhancing tumor, or an unequivocal new area of non-contrast-enhancing tumor. Additionally, progression must have occurred >3 months following completion of radiation therapy. All participants gave informed written consent to have both DSC MR imaging and DCE MR imaging data collected. All procedures complied with the principles of the Declaration of Helsinki and were approved by the institutional review board at University of California, Los Angeles.
DSC MR Imaging and DCE MR Imaging
We retrospectively reviewed DSC MR imaging and DCE MR imaging scans (3T, Magnetom Trio or Magnetom Skyra; Siemens, Erlangen, Germany), acquired in the same scan session in all 21 patients. T1 maps were generated from 5 precontrast T1-weighted images (flip angles = 5°, 10°, 15°, 20°, 30°) before DCE MR imaging (3D spoiled gradient-echo sequence, 16 sections, 130 time points, 5-second time resolution, TE/TR = 1.87/5 ms, 25° flip angle, 3-mm section thickness, 256 × 192 matrix, 24-cm FOV). The DCE MR imaging was acquired for ∼10 minutes, which was the waiting time between preload and DSC contrast injections for this study. Contrast agent bolus (0.1 mmol/kg) (gadopentetate dimeglumine, Magnevist; Bayer HealthCare Pharmaceuticals, Wayne, New Jersey) was injected after 10–13 baseline images, serving as a preload13 for DSC MR imaging (gradient-echo EPI, TE/TR = 32/1840 ms, 35° flip angle, 120 time points, bolus injection after 20–25 baseline images, 9–20 sections, 5-mm section thickness, 128 × 128 matrix size, 24-cm FOV). The same amount of contrast agent was used for the DSC MR imaging studies. Conventional postcontrast T1-weighted imaging was subsequently performed. Patients were excluded if DCE MR imaging or DSC MR imaging was corrupted by motion or technical error.
Image Registration and ROI Selection
All conventional and DCE MR images for each subject were registered to baseline DSC MR images by using a 12-df affine transformation with a mutual information cost function (FSL; http://www.fmrib.ox.ac.uk/fsl). If required, manual alignment was subsequently performed (tkregister2, Freesurfer; http://surfer.nmr.mgh.harvard.edu/). Contrast-enhancing tumor ROIs were defined in 3D by using custom scripts (Analysis of Functional Neuro Images [AFNI]; http://afni.nimh.nih.gov/afni), excluding hemorrhage, large vessels, and central necrosis, followed by manual editing to exclude nonlesion voxels.20 Tumor sizes ranged from 2.8 to 106.6 mL, with an average enhancing volume of 40.1 ± 28.4 mL. Spheric ROIs of 1.6 mL were also selected in normal-appearing, contralateral white matter for rCBV normalization.
Computation of DSC MR Imaging rCBV
All simulations and calculations were performed in Matlab (MathWorks, Natick, Massachusetts) by using custom scripts. Uncorrected rCBV was calculated from trapezoidal integration of the original DSC MR imaging relaxation rate–time curve, ΔR̂*2(t). The whole-brain average relaxation rate for nonenhancing voxels (Equations 3 and 4, all equations are in the Appendix) was used for both the original Boxerman-Weisskoff model19 (BW model) and the new bidirectional exchange model (bidir model). Linear least-squares optimization was used to determine the free parameters for both the bidir-model (via Equation 7) and the BW model (Equation 5, with kep = 0) algorithms, and the corrected rCBV was computed from Equation 8. The average run-time per patient in Matlab was 19.5 ± 6.7 seconds for the bidir model and 18.3 ± 6.2 seconds for the BW model (3.2-GHz Intel Core i5, 32 GB RAM). Tumor rCBV for each method was subsequently normalized to median rCBV within the normal-appearing white matter ROI.
Simulation of DSC MR Imaging rCBV
The whole-brain average relaxation rate, ΔR̄*2(t), was chosen from a sample patient and corresponds to the curve with K1 = 1, K2 = 0, and kep = 0. K2 = 0.05 (adding T1-dominant leakage) with kep = 0 was set to simulate the BW model. A nonzero kep (0.002 or 0.005) was used to simulate the bidir model of ΔR̂*2(t). For kep = 0.1, the simulation is reflective of the correction of relaxation rate curves at “arterylike” voxels.
Goodness of Fit Analysis
For each enhancing tumor voxel for all patients, we computed the Akaike Information Criterion (AIC) between the leakage-contaminated relaxation rate ΔR̂*2(t) (Equation 1) and its model fit (Equation 5) for the BW model and bidir-model:
where n is the number of fitted time points (injection to the end of the DSC MR imaging acquisition), RSS is the sum of the squared residuals, and p is the number of free parameters (2 for the BW model, 3 for the bidir-model).21 Differences in the BW model and bidir model AIC were calculated for all voxels with kep > 0.
We also computed the Euclidean distance (square root of the sum of the squared differences) between the interstitial leakage relaxation rate curves, ΔR*2,E(t), generated by the BW model and bidir model corrections and the DCE MR imaging signal, in which the DCE MR imaging signal was upsampled from a 5-second resolution to a 1.8-second resolution to match that of the DSC MR imaging data via linear interpolation by using the Matlab function “resample.” Because interstitial leakage relaxation rate curves and DCE MR imaging signals have units of 1/s and mM, respectively, both were standardized to an area under the curve equal to unity and were vectorized for computation of the Euclidean distance. Higher AIC and Euclidean distance imply worse fits. Two-sample t tests were used to compare whether the AIC and Euclidean distance measurements were significantly different between the 2 leakage-correction methods.
Postprocessing of DCE MR Imaging
DCE MR imaging biomarkers, kep and contrast transfer coefficient (Ktrans), were derived via a fit to the model of Tofts and Kermode.14 As described, the temporal resolution of the DCE MR imaging data was upsampled to match the DSC MR imaging data. For the DCE MR imaging analysis, the “whole-brain average” served as the arterial input function for the DCE model fit. This was done to mirror the DSC bidir model analysis, in which the “whole-brain average” effectively serves as the arterial input function. Voxels with highly fluctuating time courses in either the DSC or DCE images were eliminated from the analysis.
Correlation between DSC- and DCE-Derived Imaging Biomarkers
DSC MR imaging biomarkers, kep and rCBV, were derived as described in the Appendix. Voxelwise Pearson correlation coefficients between the DSC- and DCE-derived parameters were performed in Matlab within contrast-enhancing tumor only, for each patient independently. In this study, we report means and SDs of the correlation coefficients from all 21 patients.
Results
Simulation of the Bidir Model
Figure 1 compares the simulated total leakage contaminated relaxation rate, ΔR̂*2(t), (Fig 1A) and the component from interstitial leakage, ΔR*2,E(t), (Fig 1B) for various conditions according to the Tofts and Kermode model,14 assuming T1-dominant leakage-associated relaxation enhancement. For the BW model, ΔR*2,E(t) rises with time in the absence of washout. For nonzero kep, there is less rise in ΔR*2,E(t) and closer approximation of the tail of ΔR̂*2(t) to ΔR̄*2(t), reflecting tumors with different contrast agent pharmacokinetics. For kep = 0.1, the tail of ΔR*2,E(t) approaches zero, but because the first-pass of ΔR̂*2(t) differs from that of ΔR̄*2(t), correction of relaxation rate curves at “arterylike” voxels by using K1 and K2 is still required to achieve accurate rCBV estimates.
Fig 1.

Sample simulated model results for all patients with GBM. A, Total leakage-contaminated relaxation rate and the component from interstitial leakage (B) for T1-dominant leakage-associated relaxation enhancement. Whole-brain average relaxation rate (WBA) is simulated with K2 = 0 and kep = 0. Kep = 0 with nonzero K2 simulates the BW model. Inclusion of a washout term (nonzero kep) in the bidir model yields less rise in ΔR*2,E(t) and closer approximation of the tail of ΔR̂*2(t) to WBA. C, The bidir model fit to the sample leakage-contaminated relaxation rate curve has substantially improved AIC compared with the BW model for T2*-dominant leakage-associated relaxation enhancement in a patient with GBM. D, The standardized interstitial leakage relaxation rate from the bidir model better tracks standardized DCE MR imaging signal than the BW model for the tumor voxel used in C, with substantially improved Euclidean distance.
Figure 1C plots sample ΔR̂*2(t), with T2*-dominant leakage-associated relaxation enhancement for a representative patient, with superimposed BW model and bidir model fit relaxation rate curves. In this example, the BW model overestimates the first-pass curve, underestimates the second and third passes, and overestimates the tail. The bidir model better approximates ΔR̂*2(t) over all time points, visually, and has substantially improved the AIC, quantitating an improved fit to the total leakage-contaminated relaxation rate curve.
Figure 1D plots standardized DCE MR imaging signal for the tumor voxel used in Fig 1C, with superimposed standardized interstitial leakage relaxation rate curves, ΔR*2,E(t), from the BW model and bidir model. The standardized interstitial leakage relaxation rate continually rises with time for the BW model, whereas it better tracks standardized DCE MR imaging for the bidir model, with a substantially improved Euclidean distance.
Goodness of Fit Analysis
Figure 2 plots the percentage of voxels in which the bidir model outperformed the BW model for AIC and Euclidean distance metrics in whole brain and tumor for the 21 patients with GBM. The bidir model had better AIC performance than the BW model in >50% of whole-brain (mean, 71% ± 6%, P < .0001) and tumor (mean, 77% ± 9%, P < .0001) voxels in all patients, and better Euclidean distance performance in >50% of whole-brain voxels (mean, 80% ± 9%, P < .0001) for all patients and in tumor voxels (mean, 62% ± 17%, P = .0041) for 17 of the 21 patients. All were statistically significant for a 1-sample t test with null hypothesis of 50%.
Fig 2.

Percentage of voxels (with mean and SD) in which the bidir model outperformed the BW model on Akaike Information Criterion and Euclidean distance (ED) metrics within whole brain and tumor for all 21 patients with GBM. The gray line represents the group mean percentage of voxels.
Correlation between DSC- and DCE-Derived Imaging Biomarkers
We then performed a voxelwise correlation between the DSC-derived imaging biomarkers from the bidirectional leakage-correction algorithm (kep and rCBV) with the DCE-derived imaging biomarkers (kep and Ktrans). The Pearson correlation coefficient between the 2 kep measurements was 0.74 ± 0.13 across the 21 patients, with a weak correlation between the Pearson correlation coefficient and tumor size (r = 0.11). Figure 3 demonstrates an example of the correlation between DSC- and DCE-derived kep. A correlation test was performed between the bidirectional model–derived rCBV and DCE-derived Ktrans, with a moderate correlation of 0.49 ± 0.22. A moderate correlation was also found between rCBV and plasma volume fraction (vp) at 0.54 ± 0.12. Finally, the correlation between the same rCBV and kep was r = 0.29 ± 0.26. The average Ktrans value was 0.0015 ± 0.0018 seconds−1 (0.09 ± 0.11 minutes−1), DCE Kep was 0.0050 ± 0.0023 seconds−1 (0.30 ± 0.14 minutes−1), DSC kep was 0.0057 ± 0.0042 seconds−1 (0.34 ± 0.25 minutes−1), vp was 0.01 ± 0.01, and rCBV was 1.98 ± 1.24.
Fig 3.

Comparison between DSC- and DCE-derived kep measurements within tumor. A, Example of anatomic MR imaging of a patient with recurrent glioblastoma. B, DSC-derived kep measurements within the tumor. C, Corresponding DCE-derived kep measurements. D, Scatterplot between B and C demonstrates high correlation (r = 0.92) for this tumor. Note that areas of low kep are similar in both DSC- and DCE-derived maps.
Difference in rCBV between the Bidir Model and BW Model
Figure 4 compares rCBV maps processed without leakage correction and with the BW model or bidir model, in 2 different patients with GBM, one with T1-dominant leakage (K2 > 0) on average in contrast-enhancing tumor voxels and the other with T2*-dominant leakage (K2 < 0). For all patients, average uncorrected rCBV was 1.98 ± 1.24, the average BW model–corrected rCBV was 1.59 ± 0.89, and the average bidir model–corrected rCBV was 1.35 ± 0.80. The average difference between BW model–corrected and the bidir model–corrected rCBV was 16.6% ± 14.0%. A closer inspection of the T2*-dominant-versus-T1-dominant voxels (as defined by a negative or positive K2, respectively) revealed that the difference between the 2 correction methods in T2*-dominant voxels was 37.7% ± 42.6%, while the same metric for T1-dominant voxels was 5.8% ± 3.4%.
Fig 4.

Comparison of uncorrected, BW model–corrected, and bidir model–corrected rCBV in a GBM with T1-dominant leakage on average in contrast-enhancing voxels (first row) and a GBM with T2*-dominant leakage (second row). For T1-dominant leakage, mean tumor rCBV is underestimated by using the BW model compared with the bidir model, with the converse true for T2*-dominant leakage. Arrows depict regions of the tumor with large changes in estimated rCBV between leakage-correction models.
Discussion
By incorporating the Tofts and Kermode model into the single-echo DSC MR imaging relaxation rate equation, we developed an improved postprocessing leakage-correction method accounting for bidirectional contrast agent transport between the intravascular and interstitial spaces that commonly occurs in angiogenic high-grade gliomas. Our results demonstrate the importance of considering the interstitial washout term, even when modeling the relaxation rate changes during short image acquisitions. For instance, in the simulation, we observed differences between the bidir model and the BW model fits to relaxation rate data in high-grade gliomas in the first-pass curve (as early as 10–20 seconds after injection). Furthermore, inclusion of a washout term in the bidir model alleviates the error in relaxation rate estimates for arteries and normal brain introduced by conventional models constrained to increasing contrast agent concentration with time in all tissues.
Our results suggest that the conventional BW model undercorrects rCBV, with insufficiently increased and decreased rCBV compared with uncorrected rCBV in T1-dominant and T2*-dominant leakage scenarios, respectively. Furthermore, because the low flip angle DSC MR imaging protocol was largely T2*-dominant and the largest discrepancies between the bidir model and BW model estimates of rCBV existed for T2* dominant voxels, our results suggest that the bidir model may be particularly advantageous over the BW model for correcting the residual T2* effects frequently encountered in dual-echo gradient-echo acquisitions. This algorithm can be performed without a substantial increase in postprocessing computation time over the unidirectional model; therefore, the bidirectional model can simply replace the previous model in routine clinical work and for evaluating tumor grade, distinguishing pseudoprogression from true progression, and evaluating treatment response.
Several postprocessing leakage-correction techniques have previously been proposed.22,23 The method by Boxerman-Weisskoff,2,18,19 which linearly fits measured ΔR̂*2(t) to 2 constant functions derived from the average relaxation rate in nonenhancing tissue, can be applied quickly to conventional single-echo (spin-echo or gradient-echo) acquisitions and contrast agent injection schemes. Improved correlation of rCBV with glioma grade compared with uncorrected rCBV19 provides anecdotal evidence of the benefit of the BW model, which has also been shown to improve correlation of gadolinium-based rCBV measures over those obtained by using the intravascular magnetic iron oxide nanoparticles agent as a criterion standard.24
Bjornerud et al25 proposed a method that reduces the sensitivity of rCBV correction to mean transit time that could be combined with the bidir model scheme. Most interesting, Schmiedeskamp et al23 used a multiecho, gradient-echo, spin-echo acquisition scheme to correct for T1 and T2* leakage by using a backflow term; however, results were highly dependent on literature values for r*2,E and r*2,P, the T2* relaxation effects of gadolinium in the extravascular space and plasma, respectively, which can vary quite substantially depending on the literature source. Additionally, Quarles et al17 suggested that these values could vary from tumor to tumor, depending on physiologic factors such as interstitial, vascular, and cell volume fractions and vessel and cell size. An advantage of the bidir model correction method is the lack of assumptions for r*2,E and r*2,P. All of these leakage-correction algorithms aim to isolate the relaxation rate due to the residual intravascular contrast agent by eliminating the T1- and T2*-related contributions to the relaxation rate from the extravasated contrast agent. They do not “add back” T2* relaxation that would have been realized had the extravasated contrast agent not left the plasma space, so “corrected rCBV” may still differ from that computed for a tumor with no vascular permeability, all other parameters (including true blood volume) being equal.
One potential limitation to this study is its retrospective design, which may have yielded a selection bias in the sample. Specifically, all patients were chosen because they failed standard therapy. Another potential limitation is the lack of correlation with a criterion standard, such as histology, or with CBV estimates by using intravascular agents such as iron oxide contrast agents. Moreover, AIC is a unitless quantity, which can compare relative goodness of fit between models but does not have a direct test to determine whether one model is significantly better than the other. Finally, the current study only included patients with glioblastoma; therefore, we were unable to recommend a threshold between low-grade and high-grade gliomas by using the new leakage-correction algorithm.
Conclusions
The bidir model more accurately corrects for the T1 or T2* enhancement arising from contrast agent extravasation due to blood-brain barrier disruption in high-grade gliomas by incorporating interstitial washout rates into the DSC MR imaging relaxation rate model. To this end, the bidir model may potentially improve patient diagnosis and evaluation of treatment response by more accurately estimating rCBV in DSC MR imaging.
ABBREVIATIONS:
- AIC
Akaike Information Criterion
- bidir model
bidirectional model
- BW model
Boxerman-Weisskoff model
- ΔR2*
transverse relaxation rate
- DCE
dynamic contrast-enhanced
- GBM
glioblastoma multiforme
- kep
transfer constant from the extracellular extravascular space back to the blood plasma
- Ktrans
contrast transfer coefficient
- rCBV
relative cerebral blood volume
Appendix
Following Equation A6 of Boxerman et al,19 the leakage-contaminated DSC MR imaging relaxation rate–time curve, ΔR̂*2(t), equals the intravascular contrast-driven transverse relaxation rate change, ΔR*2(t) plus ΔR*2,E(t), a tissue-leakage term describing the simultaneous T1 and T2* relaxation effects resulting from gadolinium extravasation:
 |
where E1 = e−TR/T1o, T1o is the precontrast tissue T1, r1 is the T1 relaxivity of gadolinium, CE(t) is the concentration of gadolinium in the extravascular extracellular space, and r*2,E represents the T2* relaxation effects of gadolinium extravasation, as described by Quarles et al17 and Schmiedeskamp et al.23 From the original Tofts and Kermode model describing bidirectional contrast agent flux between the intravascular and extravascular compartments,14 we can estimate the concentration in the extravascular space as:
where ktrans and kep are the transfer coefficients for intra- to extravascular and extra- to intravascular contrast flux, respectively, and Cp(t) is the plasma contrast concentration. Cp(t) and ΔR2*(t) can be defined as scaled versions of the whole-brain average relaxation rate in nonenhancing voxels, ΔR̄*2(t)19:
Combining Equations 1–4 yields the following:
where
K1, K2, and kep (units of second−1) are the free parameters of Equation 5. In general, K1 depends on CBV, vessel size, and other physiologic factors, while K2 is related to vascular permeability. Substituting kep = 0, which occurs with no backflow of extravasated contrast agent, yields the original Boxerman-Weisskoff leakage-correction algorithm, where K1 and K2 are solved by linear least-squares fit to ΔR̂*2(t).19 For the bidir model correction method, a linear least-squares fit to K1, K2, and kep can be used with the methodology of Murase,26 as described by the following equation:
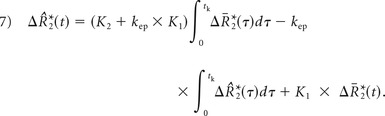 |
Integrating the corrected relaxation rate–time curve yields the following expression for leakage-corrected rCBV:
Footnotes
Disclosures: Timothy F. Cloughesy—UNRELATED: Consultancy: F. Hoffmann-La Roche; Genentech; Celgene, Tocagen, AbbVie, Novocure, StemCycle, Novartis, Nektar, Newgen, Notable Labs, Upshire-Smith, VBL. Albert Lai—UNRELATED: Consultancy: Genentech, F. Hoffmann-La Roche, Novocure. Linda Liau—UNRELATED: Grants/Grants Pending: Northwest Biotherapeutics,* Comments: research grant. Whitney B. Pope—UNRELATED: Consultancy: Guerbet. *Money paid to the institution.
This work was supported by the American Cancer Society Research Scholar Grant RSG-15-003-01-CCE (B.M.E.); National Institutes of Health/National Cancer Institute R21CA167354 (B.M.E.); UCLA Jonsson Comprehensive Cancer Center Seed Grant (B.M.E.); National Brain Tumor Society Research Grant (B.M.E.); Siemens Healthcare Research Grant (B.M.E.); Art of the Brain (T.F.C.); Ziering Family Foundation in memory of Sigi Ziering (T.F.C.); Singleton Family Foundation (T.F.C.); Clarence Klein Fund for Neuro-Oncology (T.F.C.); National Institutes of Health National Institute of General Medical Sciences training grant, GM08042 (K.L.); and the University of California, Los Angeles Medical Scientist Training Program (K.L.).
References
- 1. Cha S, Knopp EA, Johnson G, et al. Intracranial mass lesions: dynamic contrast-enhanced susceptibility-weighted echo-planar perfusion MR imaging. Radiology 2002;223:11–29 10.1148/radiol.2231010594 [DOI] [PubMed] [Google Scholar]
- 2. Aronen HJ, Gazit IE, Louis DN, et al. Cerebral blood volume maps of gliomas: comparison with tumor grade and histologic findings. Radiology 1994;191:41–51 10.1148/radiology.191.1.8134596 [DOI] [PubMed] [Google Scholar]
- 3. Law M, Yang S, Wang H, et al. Glioma grading: sensitivity, specificity, and predictive values of perfusion MR imaging and proton MR spectroscopic imaging compared with conventional MR imaging. AJNR Am J Neuroradiol 2003;24:1989–98 [PMC free article] [PubMed] [Google Scholar]
- 4. Law M, Oh S, Babb JS, et al. Low-grade gliomas: dynamic susceptibility-weighted contrast-enhanced perfusion MR imaging–prediction of patient clinical response. Radiology 2006;238:658–67 10.1148/radiol.2382042180 [DOI] [PubMed] [Google Scholar]
- 5. Danchaivijitr N, Waldman AD, Tozer DJ, et al. Low-grade gliomas: do changes in rCBV measurements at longitudinal perfusion-weighted MR imaging predict malignant transformation? Radiology 2008;247:170–78 10.1148/radiol.2471062089 [DOI] [PubMed] [Google Scholar]
- 6. Boxerman JL, Ellingson BM, Jeyapalan S, et al. Longitudinal DSC-MRI for distinguishing tumor recurrence from pseudoprogression in patients with a high-grade glioma. Am J Clin Oncol 2014. November 26. [Epub ahead of print] [DOI] [PubMed] [Google Scholar]
- 7. Gahramanov S, Varallyay C, Tyson RM, et al. Diagnosis of pseudoprogression using MRI perfusion in patients with glioblastoma multiforme may predict improved survival. CNS Oncol 2014;3:389–400 10.2217/cns.14.42 [DOI] [PMC free article] [PubMed] [Google Scholar]
- 8. Schmainda KM, Zhang Z, Prah M, et al. Dynamic susceptibility contrast MRI measures of relative cerebral blood volume as a prognostic marker for overall survival in recurrent glioblastoma: results from the ACRIN 6677/RTOG 0625 multicenter trial. Neuro Oncol 2015;17:1148–56 10.1093/neuonc/nou364 [DOI] [PMC free article] [PubMed] [Google Scholar]
- 9. Leu K, Enzmann DR, Woodworth DC, et al. Hypervascular tumor volume estimated by comparison to a large-scale cerebral blood volume radiographic atlas predicts survival in recurrent glioblastoma treated with bevacizumab. Cancer Imaging 2014;14:31 10.1186/s40644-014-0031-z [DOI] [PMC free article] [PubMed] [Google Scholar]
- 10. LaViolette PS, Cohen AD, Prah MA, et al. Vascular change measured with independent component analysis of dynamic susceptibility contrast MRI predicts bevacizumab response in high-grade glioma. Neuro Oncol 2013;15:442–50 10.1093/neuonc/nos323 [DOI] [PMC free article] [PubMed] [Google Scholar]
- 11. Villringer A, Rosen BR, Belliveau JW, et al. Dynamic imaging with lanthanide chelates in normal brain: contrast due to magnetic susceptibility effects. Magn Reson Med 1988;6:164–74 10.1002/mrm.1910060205 [DOI] [PubMed] [Google Scholar]
- 12. Meier P, Zierler KL. On the theory of the indicator-dilution method for measurement of blood flow and volume. J Appl Physiol 1954;6:731–44 [DOI] [PubMed] [Google Scholar]
- 13. Paulson ES, Schmainda KM. Comparison of dynamic susceptibility-weighted contrast-enhanced MR methods: recommendations for measuring relative cerebral blood volume in brain tumors. Radiology 2008;249:601–13 10.1148/radiol.2492071659 [DOI] [PMC free article] [PubMed] [Google Scholar]
- 14. Tofts PS, Kermode AG. Measurement of the blood-brain barrier permeability and leakage space using dynamic MR imaging, 1: fundamental concepts. Magn Reson Med 1991;17:357–67 10.1002/mrm.1910170208 [DOI] [PubMed] [Google Scholar]
- 15. Roberts HC, Roberts TP, Brasch RC, et al. Quantitative measurement of microvascular permeability in human brain tumors achieved using dynamic contrast-enhanced MR imaging: correlation with histologic grade. AJNR Am J Neuroradiol 2000;21:891–99 [PMC free article] [PubMed] [Google Scholar]
- 16. Ludemann L, Wurm R, Zimmer C. Pharmacokinetic modeling of Gd-DTPA extravasation in brain tumors. Invest Radiol 2002;37:562–70 [DOI] [PubMed] [Google Scholar]
- 17. Quarles CC, Gochberg DF, Gore JC, et al. A theoretical framework to model DSC-MRI data acquired in the presence of contrast agent extravasation. Phys Med Biol 2009;54:5749–66 [DOI] [PMC free article] [PubMed] [Google Scholar]
- 18. Donahue KM, Krouwer HG, Rand SD, et al. Utility of simultaneously acquired gradient-echo and spin-echo cerebral blood volume and morphology maps in brain tumor patients. Magn Reson Med 2000;43:845–53 [DOI] [PubMed] [Google Scholar]
- 19. Boxerman JL, Schmainda KM, Weisskoff RM. Relative cerebral blood volume maps corrected for contrast agent extravasation significantly correlate with glioma tumor grade, whereas uncorrected maps do not. AJNR Am J Neuroradiol 2006;27:859–67 [PMC free article] [PubMed] [Google Scholar]
- 20. Ellingson BM, Cloughesy TF, Lai A, et al. Quantitative volumetric analysis of conventional MRI response in recurrent glioblastoma treated with bevacizumab. Neuro Oncol 2011;13:401–09 10.1093/neuonc/noq206 [DOI] [PMC free article] [PubMed] [Google Scholar]
- 21. Burnham KP, Anderson DR. Model Selection and Inference: A Practical Information-Theoretic Approach. New York: Springer-Verlag; 1998 [Google Scholar]
- 22. Quarles CC, Ward BD, Schmainda KM. Improving the reliability of obtaining tumor hemodynamic parameters in the presence of contrast agent extravasation. Magn Reson Med 2005;53:1307–16 [DOI] [PubMed] [Google Scholar]
- 23. Schmiedeskamp H, Andre JB, Straka M, et al. Simultaneous perfusion and permeability measurements using combined spin- and gradient-echo MRI. J Cereb Blood Flow Metab 2013;33:732–43 10.1038/jcbfm.2013.10 [DOI] [PMC free article] [PubMed] [Google Scholar]
- 24. Boxerman JL, Prah DE, Paulson ES, et al. The role of preload and leakage correction in gadolinium-based cerebral blood volume estimation determined by comparison with MION as a criterion standard. AJNR Am J Neuroradiol 2012;33:1081–87 10.3174/ajnr.A2934 [DOI] [PMC free article] [PubMed] [Google Scholar]
- 25. Bjornerud A, Sorensen AG, Mouridsen K, et al. T1- and T2*-dominant extravasation correction in DSC-MRI, part I: theoretical considerations and implications for assessment of tumor hemodynamic properties. J Cereb Blood Flow Metab 2011;31:2041–53 10.1038/jcbfm.2011.52 [DOI] [PMC free article] [PubMed] [Google Scholar]
- 26. Murase K. Efficient method for calculating kinetic parameters using T-1-weighted dynamic contrast-enhanced magnetic resonance imaging. Magn Reson Med 2004;51:858–62 [DOI] [PubMed] [Google Scholar]