Abstract
Disc degeneration is one of the leading factors that contribute to low back pain. Thus, the further understanding of the mechanisms leading to degeneration of the intervertebral disc degeneration is critical for the development of therapies and strategies for treating low back pain. Rodent models are attractive for conducting mechanistic studies particularly because of the availability of genetically modified animals. However, currently imaging technologies such as magnetic resonance imaging, do not have the ability to resolve spatial features at the tens- to single- micrometer scale. We propose here a contrast-enhanced microCT technique to conduct high-resolution imaging of the rodent intervertebral discs at 10μm spatial resolution. Based on the iodinated-hydrophilic contrast agent Ioversol, we are able to conduct high resolution imaging on rat and mouse intervertebral discs. Leveraging the hydrophilic characteristic of the contrast agent, we are able to discriminate the annulus fibrosus from the water-rich nucleus pulposus. Moreover, this technique allows for the quantitative measurement of disc morphologies and volumes, and we demonstrate the versatility of this technique on cultured live intervertebral discs. Coupled with our semi-automated segmentation technique, we are able to quantify the intervertebral disc volumes with a high degree of reproducibility. The contrast-enhanced microCT images were qualitatively and quantitatively indistinguishable from the traditional histological assessment of the same sample. Furthermore, stereological measures compared well between histology and microCT images. Taken together, the results reveal that rat and mouse intervertebral discs can be imaged longitudinally in vitro at high resolutions, with no adverse effects on viability and features of the intervertebral disc.
Keywords: Intervertebral disc, contrast-enhanced MicroCT, disc degeneration, Ioversol
1. Introduction
Low back pain is one of the most common and costly problems in healthcare today with a lifetime prevalence of 65–80% 1 and costing billions of dollars in healthcare costs and loss of productivity annually2. Degeneration of the intervertebral disc (IVD) is a significant contributor to development of low back pain3,4, and a better understanding of the biological, biochemical, and structural changes that occur in the IVD during degeneration is thus critical for elucidating the mechanisms associated with this debilitating cascade 5,6.
The IVD is a fibrocartilaginous joint that lies between two adjacent vertebrae in the vertebral column and consists of two parts: the annulus fibrosus (AF) and the nucleus pulposus (NP). The annulus primary consists of several lamella of fibrocartilage, which surrounds the gelatinous proteoglycan-rich nucleus pulposus7. IVDs serve key structural roles in the spine, with the annulus providing support against compressive forces and the nucleus providing shock absorption8,9. Cartilaginous endplates connect each IVD to its adjacent vertebral bodies 10, and this entire unit of IVD, cartilaginous endplates, and adjacent vertebral bodies is known as a functional spinal unit (FSU).
One of the primary challenges in understanding IVD degeneration is the lack of a high-resolution imaging tool to study rodent models. While MRI is commonly used to quantify changes in IVD morphology in humans and other large animal models11, its comparatively low resolution limits its ability to visualize the sub millimeter changes that occur at the onset of disc degeneration in rodent models12. Micro-Computed Tomography (microCT) is an imaging technique based on the attenuation of x-rays that pass through the object imaged that has a resolution at the single micrometer level. However, microCT has difficulty resolving unmineralized soft tissue such as the IVD, due to their low attenuation13.
Recent studies have shown that ionic contrast agents greatly improve the detection threshold of unmineralized soft tissues in microCT 13–19. Iondinated anionic contrast agents such as Hexabrix (ioxaglate) and Cysto Conray II (iothalamate) distribute inversely proportional to the negatively charged glycosaminoglycans (GAGs) in soft tissue13–16. Thus loss of GAGs in soft tissue leads to increased presence of atomically dense contrast agent, which can be visualized by microCT 13–16. However, due to the electrostatic repulsion between anionic contrast agents and the GAGs, there is a limited magnitude of attenuation intensity at the site of interest16. On the other hand, cationic contrast agents bind proportionally to the negatively charged GAGs due to electrostatic attraction. Thus, cationic contrast agents allow for quantification of articular cartilage GAGs content at lower concentrations compared to anionic contrast agents17–19. However, the strong electrostatic attraction of the cationic contrast agent to the GAGs increases the time it takes for an organism to clear the contrast agent17–19.
To address some of the limitations of ionic contrast agents, we propose a novel contrast-enhanced CT technique using Ioversol, a clinically available nonionic contrast agent containing iodine. Contrast-enhanced microCT using Ioversol makes use of the high resolution of microCT and the differential binding of Ioversol in the AF and NP due to different levels of tissue hydration to provide a high resolution, nondestructive technique of imaging rodent IVD models in vitro longitudinally.
The objective of our study is threefold: (1) develop a novel technique for nondestructively imaging the IVD using Ioversol contrast-enhanced microCT, (2) develop a tool for semi-automated thresholding of the microstructural components of the IVD, and (3) determine the sensitivity and robustness of this technique.
2. Methods
To demonstrate versatility of this imaging approach in rodents, we examined both rat and mouse intervertebral discs. For both species, we extracted Functional Spine Units (FSUs) containing an intact intervertebral disc sandwiched by the intact end-plate and vertebrae on both ends. To show the non-toxic and in vitro longitudinal applicability, we applied the imaging technique to an in vitro organ culture of mouse FSUs to verify that the contrast agent does not tamper with the homeostasis of the IVD cells. All procedures were done with approval from Washington University’s Animal Studies Committee. Soft tissues were carefully removed using a scalpel and dissecting scissors before incubating the samples.
2.1 Rat ex vivo samples incubation
Four FSUs were dissected from the tails of freshly frozen 4-month old Sprague Dawley rats (n = 4). These FSUs were incubated in a 1mL solution of 50mg/mL Ioversol (from a stock solution of 350 mg/mL of Ioversol) and 1% penstrep in 1mL PBS at 37C. After a one-day incubation period, the sample was prepared for the day 0 scan. Samples were scanned using a VivaCT40 at 45kVp, 177uA, high resolution, 300ms integration, and 10μm voxel size (Scanco Medical, CH). After each microCT scan the sample is returned to the incubation solution.
2.2 Mouse Organ Culture
Fifteen mouse FSUs were dissected from the tails of 8-week old BALB/c mice. These FSUs were randomly assigned to one of four organ culture treatment groups (n=3/group): Control, Ioversol, microCT, and dead control (flash frozen by liquid nitrogen). The control, Ioversol, and dead control groups were not scanned with microCT and served as controls for comparing the metabolic assay and histology results with the microCT group to assess longitudinal viability of the group. Metabolic assays confirmed that all organ culture samples remained viable during the entire culture period. Three additional FSUs were harvested and immediately processed for histology to serve as an additional control (fresh control).
Mouse organ culture samples were incubated in 2mL DMEM/F12 supplemented with 20% FBS and 1% penicillin-streptomycin. We have previously demonstrated the sustained viability of this model using metabolic, mechanical, and histological assays20. Four hours before each microCT scan, 300mL of sterile filtered Ioversol (350 mg/mL) was added to wells for Ioversol and microCT groups, giving a concentration of approximately 50 mg/mL in the culture solution. The organ culture system was kept sterile during the scan by wrapping the FSU in sterile gauze and placing the wrapped sample into a sterile microcentrifuge tube that could be secured inside of the microCT tube for scanning. Samples were scanned using a VivaCT40 at 45kVp, 177uA, high resolution, 300ms integration, and 10μm voxel size (Scanco Medical, CH). Immediately after scanning, the sample is placed back into fresh Ioversol-free media. An Alamar Blue metabolic activity assay was used to track sample viability during culture. After 7 days in culture, all samples were processed for histology (10 um thick sections) and stained with Safranin-O and Fast Green.
2.3 MicroCT data contouring, thresholding, and segmentation
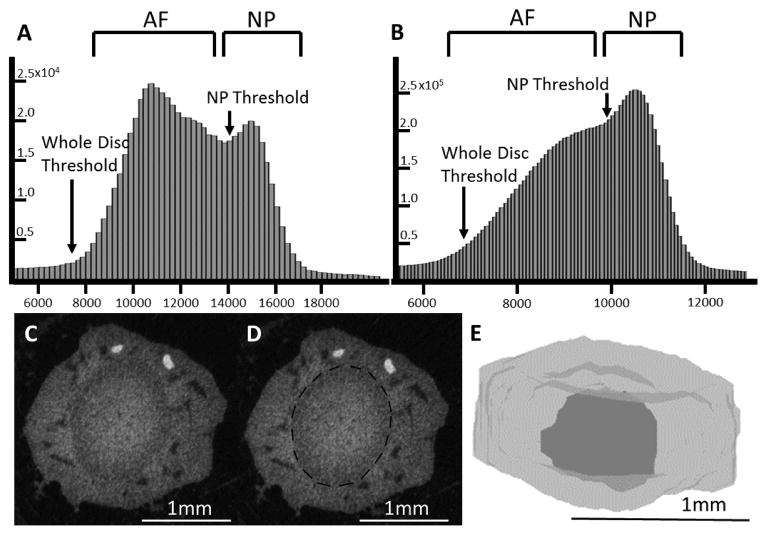
The rat and mouse microCT data were processed using the same technique. Raw data of the microCT scans were exported as a DICOM file in order to be further processed. To ensure that the approach is compatible with other 3D imaging systems, we opted to use Matlab for our analyses. Soft tissue not part of the IVD was contoured out by visual inspection and slices that did not contain the IVD were removed. Contours were drawn every 5 slices and morphed using a linear interpolation (Blended 3D poly2 mask on MATLAB file exchange). Removing extraneous tissue is important since some of the attenuation values may overlap between the AF and soft tissue. Thus, contouring out the soft tissue reduces potential sources of error in the automated segmentation. This processed DICOM file was input into a MATLAB program that has the user-selected thresholds for the whole disc and the NP based on a histogram of attenuation values. The whole disc threshold was fitted to 4 gaussian distributions corresponding to bone, annulus, nucleus, and air. Approximately the intersection of the 1st and 2nd Gaussians was defined to be start of the AF threshold, and the NP threshold was defined to be the intersection of the 2nd and 3rd Gaussian (Figure 2). Typical thresholding values are around 6000–8000 on a 16-bit greyscale for the whole disc and around 10000–14000 for the NP with mouse generally having higher NP threshold values. Using these thresholds, the program first heavily filters the image (sigma=8, support=9) and then generates threshold masks for the whole disc and the NP. A morphological close followed by a morphological open was performed on each threshold mask to smooth out the shapes and fill in any interior holes. The size of the open and close operations was empirically determined and kept constant for all samples of a given species. Lastly, volumes of the whole disc and the NP were calculated from the volume enclosed by the corresponding final threshold masks.
Figure 2.
Representative attenuation histograms of (A) Mouse and (B) Rat obtained from the day zero samples with the AF and NP thresholds shown. Attenuation values are reported on the raw 16 bit greyscale (C) MicroCT image of a transverse section of the Ioversol contrast-enhanced intervertebral disc before any processing. (D) MicroCT image of the Ioversol contrast-enhanced intervertebral disc with a dotted line outlining the intervertebral disc. (E) Computer model of the intervertebral disc obtained by the MATLAB program.
2.4 Data processing technique analyses
Multiple analyses were performed to test the robustness of our method for data processing. First, a thresholding sensitivity analysis was performed, which reveals how changing the threshold influences the final calculated volume. This was done by processing one of the day 0 microCT scans for both the rat and mouse using the MATLAB program across a wide range of values below and above the defined thresholds. Second, contouring sensitivity analysis was performed to determine the effects of edge slices on subsequent volumes. The same day 0 microCT scans for the rat and mouse were used and processed multiple times using the MATLAB program but varying the number of slices by including a few slices more or less in the dataset when compared to the baseline. Third, a propagation of errors analysis was performed to assess how all steps including the initial segmentation of soft tissue, removal of extraneous slices, threshold selection, and systematic errors in the program factor into the final volumes calculated. A single rat and mouse sample from the day 0 time point were both processed entirely from start to finish individually ten times and the coefficient of variation was calculated.
2.5 Comparisons between microCT and histological images
Measurements of AF width, NP width, and disc height taken from midsagittal histological sections to the corresponding slice of the microCT scan using Osirix to confirm the accuracy of the contrast-enhanced microCT technique. Two dimensional measurements such as AF width, NP width, and disc height, were used for the comparison since they can be obtained using both histology and microCT without the need for additional calculations and assumptions. AF and NP were measured at the widest part of the disc and disc height was measured at the center of each disc. An additional metric of disc height ratio, defined as the ratio of disc height/AF width, was calculated as it provides information about the geometry of the disc. AF width and NP width are sensitive to thresholding so values above and below the control thresholding value were also computed. Changes in threshold are represented as a percentage of the range of attenuation values of the entire disc to account for potential differences between samples.
2.6 Statistical analyses
T-tests were used to determine the differences between microCT- and histology- derived measurements and Pearson’s correlations were used to determine their relationship. The rat and mouse whole disc volumes, as well as the NP volumes were examined using one-way ANOVA to examine the change of these parameters over time. The statistics were done using Prism 6.0 (GraphPad, San Diego CA).
3. Results
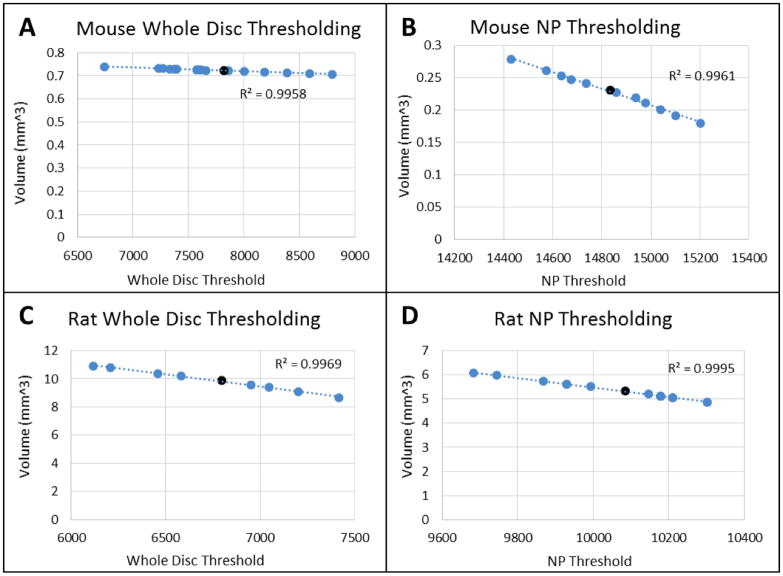
The thresholding sensitivity analysis (Figure 3) shows linear relationships between threshold and volumes calculated for both the whole disc and the NP only in both rats and mice. This ensures that the selected threshold value does not occur on an inflection point. Thresholds well above and below the threshold selected by the gaussian analysis were used in this the sensitivity analysis in order to provide a more complete picture of the relationship between the threshold selected and the calculated volume. The whole disc is relatively insensitive to the changes threshold selection. The NP threshold sensitivity was comparatively higher for both mouse and the rat but the rat showed lower NP sensitivity than the mouse, possibly due to the the attenuation gradient at the annular-nucleo interface.
Figure 3.
Thresholding Sensitivity of (A) Mouse Whole Disc (B) Mouse NP (C) Rat Whole Disc (D) Rat NP. The whole disc volume for the mouse and rat discs are relatively insensitive to the threshold value, while the NP volume, which is bound by the annular-nuclear interface, is quite susceptible to threshold value. The darkened data points represent the chosen thresholds from the Gaussian analysis. Representative analyses are shown here but all of the calculated volumes varied linearly with respect to thresholding.
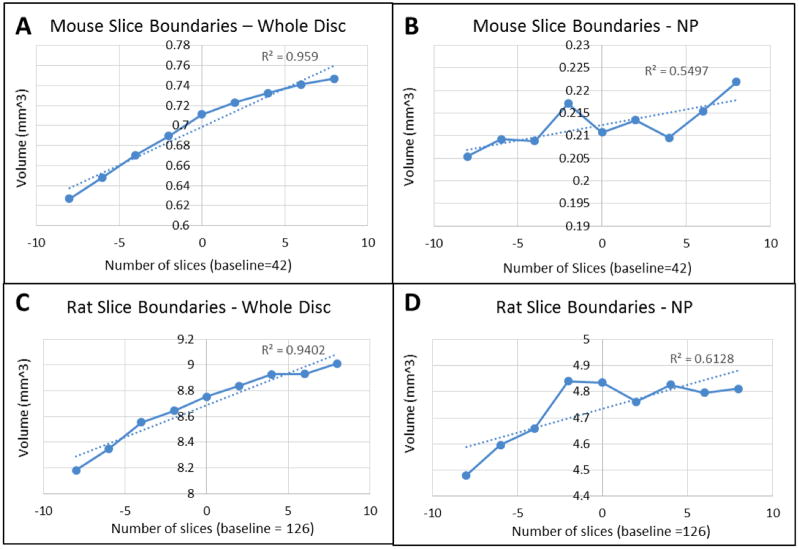
Contouring Sensitivity (Figure 4) shows small increases and decreases in calculated volumes as the boundaries for the data processing became more inclusive (more slices) and exclusive (fewer slices) when compared to a baseline number of slices for that sample. All samples show a roughly linear relationship between the number of slices included in the analysis and the calculated volume. Both rat and mice showed similar magnitudes in variation of calculated volumes at different slice numbers with the NP value being slightly more sensitive.
Figure 4.
Contouring Sensitivity of (A) Mouse Whole Disc (B) Mouse NP (C) Rat Whole Disc (D) Rat NP. Increases and decreases in the total number slices, corresponding to whether the outmost slices of data were included in data processing, resulted in comparatively small increases and decreases in calculated volumes. Representative plots are shown, and all samples showed similar trends.
Propagation of error analysis (Table 1) shows coefficient of variations of the calculated volumes. Under these assumptions, the maximum error that would be introduced into these measures are on the order of 1.5% for mice discs, and 3.5% for rat discs.
Table 1.
Propagation of error analysis shows smaller coefficient of variations in the mouse samples when compared to rat samples and smaller coefficient of variations for the NP when compared to the whole disc.
| Coefficient of Variation | Whole Disc | NP |
|---|---|---|
| Mouse | 1.59% | 0.91% |
| Rat | 3.45% | 1.81% |
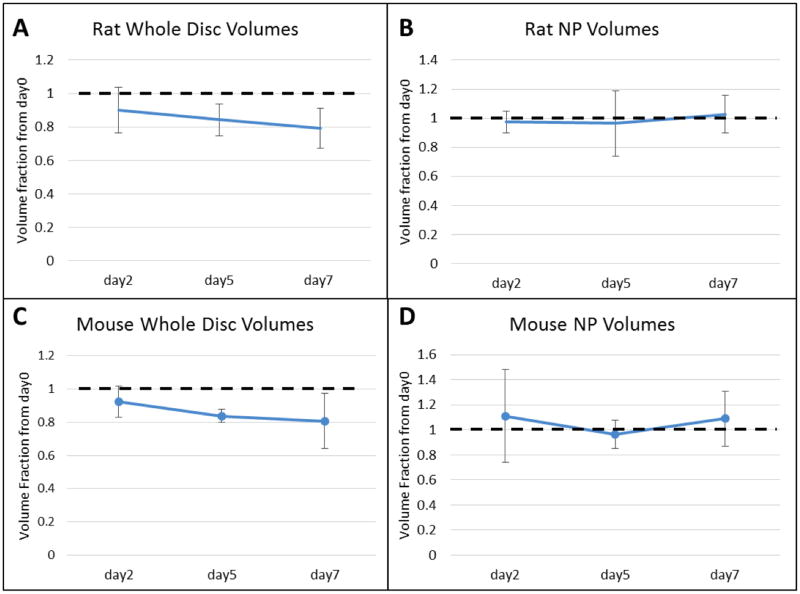
Calculating the volumes of the samples scanned (Figure 5), the mouse discs reveal no significant changes in the disc volumes over the organ cultured period. The rat whole disc volume declines over time (p = 0.018), possibly due to endogenous activation of proteases in the absence of live cells. In both the rat and mouse NP volumes, no change was observed over time.
Figure 5.
Calculated Volume Fractions of Mouse and Rat samples over time of (A) Mouse Whole Disc (B) Mouse NP (C) Rat Whole Disc (D) Rat NP.
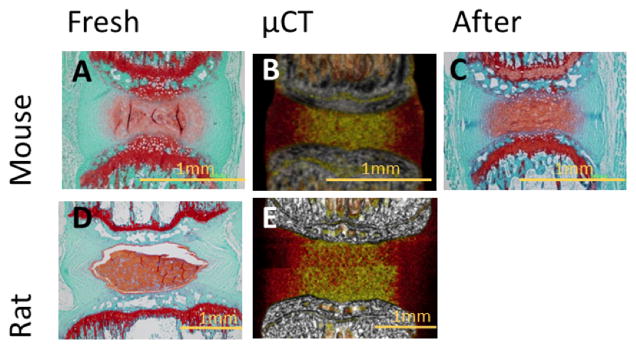
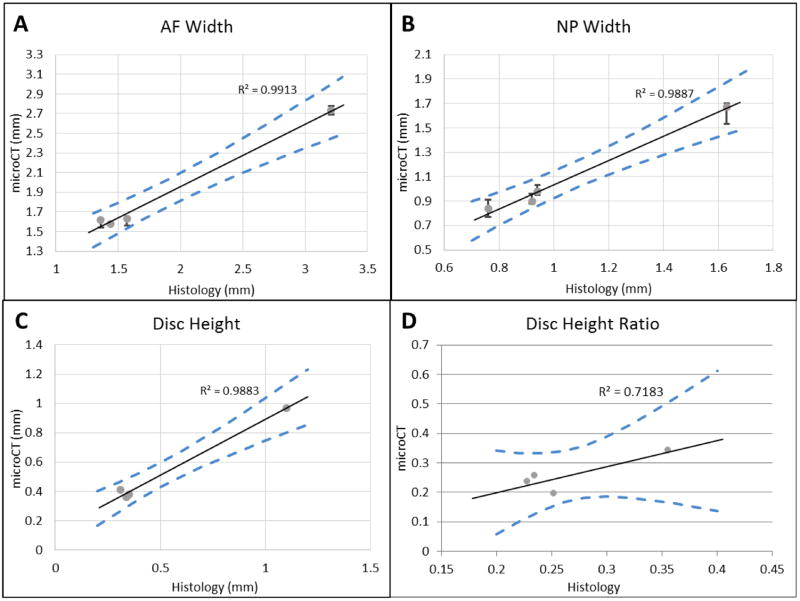
The microCT- and histological- derived parameters were highly correlated AF width (r2 = 0.9913), NP width (r2 = 0.9887), disc height (r2 = 0.9883), and disc height ratio (r2 = 0.7183). Changing the threshold by 10% for the AF and 5% for the NP are shown to fall within the 95% confidence interval of the linear regression, which is consistent with the less defined but less sensitive AF threshold and the better defined but more sensitive NP threshold. A paired t-test showed no difference between the histology and microCT groups for AF width (p = 0.9775), NP width (p = 0.1881), disc height (p = 0.9242), and disc height ratio (p = 0.6308). Additionally there was no qualitatively observable difference in histology (Figure 7) between the fresh controls and the microCT samples.
Figure 7.
Histology and Osirix Visualization of the IVD. (A) Histology of freshly dissected mouse IVD (B) Osirix visualization of mouse microCT scan data (C) Histology of mouse IVD after the day 7 time point (D) Histology of freshly dissected rat IVD (E) Osirix visualization of rat microCT scan data.
4. Discussion
A novel technique was developed for nondestructive in vitro longitudinal imaging of rodent IVDs suitable for both ex vivo samples and in vitro organ culture samples that allows the same sample to be analyzed across multiple timepoints during a study. The Ioversol contrast-enhanced microCT imaging process preserves the structural and biochemical properties of the IVD, and thus can be performed in conjunction with or prior to other analysis methods without impacting the results. Although the typical clinical classification of disc degeneration provides qualitative guidance with respect to disc height changes21, the utilization of this approach in vitro models provides an opportunity to define structural changes with a greater degree of fidelity.
This imaging and data processing technique quantifies total and NP volumes of murine IVDs with high reproducibility. The contour can be consistently selected based on clear anatomical landmarks. Additionally, our sensitivity analyses reveal linear relationships between the threshold and the resultant volumes, and that small changes in threshold selection do not result in large changes in calculated volumes. It is important to perform analysis in the region where two variables are linearly related in order to ensure that a small change in the independent variable does not result in a dramatic change in the dependent variable. The slice boundaries also have a relatively small effect on the variations of the calculated volumes that culminate in volume changes on the order of 3–4%. Additionally, there are only small changes in volume as the number of slices varied. These two factors combined account for the high repeatability within processing of a single microCT scan.
It is worth noting that the determination of the NP volume may be susceptible to errors due to the ambiguous boundary between the AF and the NP when using a nonpolar hydrophilic contrast agent such as Ioversol. As such, the attenuation values for the AF and NP will overlap to some degree. Comparisons to histology show that two-dimensional metrics obtained by microCT are consistent with those from histology, providing additional validation to our segmentation approach of the intervertebral disc compartments.
This newly developed technique will have broad applicability for those using rodent models to study IVD degeneration. Contrast enhanced microCT using Ioversol is able to nondestructively obtain quantitative and qualitative data about the intervertebral disc in both ex vivo models and in vitro organ culture models. As expected in a non-living ex vivo system, there is some level of degeneration in the sample over time that, which could be quantified by loss of total disc volume in the rat samples. However, there are no observable changes in the volumes of the mouse cultured FSUs during the 7 days. These results are consistent with the histology and the metabolic assays confirming the nondestructive nature of Ioversol contrast-enhanced microCT in an organ culture system.
5. Conclusion
We demonstrate here a nondestructive method to conduct contrast-enhanced microCT imaging on rat and mouse intervertebral discs. The imaging data, combined with our contouring and segmentation strategies, reveal that this approach is highly reproducible with a relatively small amount of error. This method can be applied longitudinally in vitro and does not disturb the viability of live cells. We expect this technique to be valuable for studies to examine the mechanisms of degeneration in rodent models.
Figure 1.
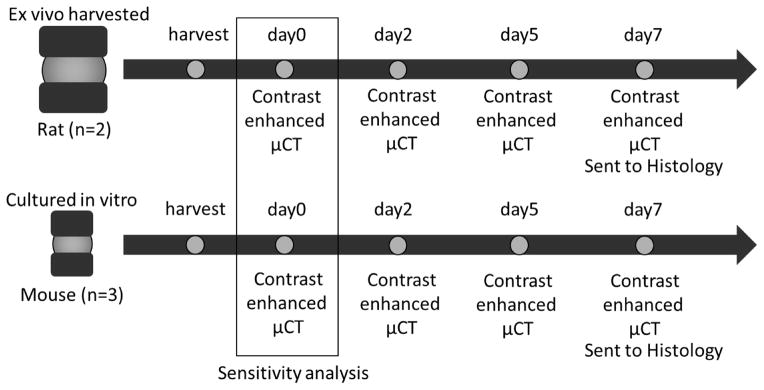
Schematic of the experimental design.
Figure 6.
Measured values from histology compared to measured values from microCT of (A) AF width, (B) NP width, (C) Disc Height, and (D) Disc height ratio (disc height/AF width). The black line is the linear regression and the blue dotted lines represent the 95% confidence interval of the linear regression. On panels A and B, the error bars represent the microCT lengths from 10% and 5% threshold changes respectively.
Acknowledgments
This work was supported in part by the Washington University Musculoskeletal Research Center (NIH P30 AR057235). The authors thank Christian Weber for a critical reading of the manuscript.
Footnotes
Disclosures:
The authors have no relevant conflicts to disclose
Publisher's Disclaimer: This is a PDF file of an unedited manuscript that has been accepted for publication. As a service to our customers we are providing this early version of the manuscript. The manuscript will undergo copyediting, typesetting, and review of the resulting proof before it is published in its final citable form. Please note that during the production process errors may be discovered which could affect the content, and all legal disclaimers that apply to the journal pertain.
References
- 1.Manchikanti L. Epidemiology of low back pain. [Accessed November 4, 2015];Pain Physician. 2000 3(2):167–192. http://www.ncbi.nlm.nih.gov/pubmed/16906196. [PubMed] [Google Scholar]
- 2.Luo X, Pietrobon R, Sun SX, Liu GG, Hey L. Estimates and patterns of direct health care expenditures among individuals with back pain in the United States. Spine (Phila Pa 1976) 2004;29(1):79–86. doi: 10.1097/01.BRS.0000105527.13866.0F. [DOI] [PubMed] [Google Scholar]
- 3.Cheung KMC. The relationship between disc degeneration, low back pain, and human pain genetics. Spine J. 2010;10(11):958–960. doi: 10.1016/j.spinee.2010.09.011. [DOI] [PubMed] [Google Scholar]
- 4.Antoniou J, Steffen T, Nelson F, et al. The human lumbar intervertebral disc: evidence for changes in the biosynthesis and denaturation of the extracellular matrix with growth, maturation, ageing, and degeneration. J Clin Invest. 1996;98(4):996–1003. doi: 10.1172/JCI118884. [DOI] [PMC free article] [PubMed] [Google Scholar]
- 5.Deng M, Griffith JF, Zhu X-M, Poon WS, Ahuja AT, Wang Y-XJ. Effect of ovariectomy on contrast agent diffusion into lumbar intervertebral disc: a dynamic contrast-enhanced MRI study in female rats. Magn Reson Imaging. 2012;30(5):683–688. doi: 10.1016/j.mri.2012.01.001. [DOI] [PubMed] [Google Scholar]
- 6.Niinimäki JL, Parviainen O, Ruohonen J, et al. In vivo quantification of delayed gadolinium enhancement in the nucleus pulposus of human intervertebral disc. J Magn Reson Imaging. 2006;24(4):796–800. doi: 10.1002/jmri.20693. [DOI] [PubMed] [Google Scholar]
- 7.Marchand F, Ahmed AM. Investigation of the laminate structure of lumbar disc anulus fibrosus. [Accessed November 4, 2015];Spine (Phila Pa 1976) 1990 15(5):402–410. doi: 10.1097/00007632-199005000-00011. http://www.ncbi.nlm.nih.gov/pubmed/2363068. [DOI] [PubMed] [Google Scholar]
- 8.Niosi CA, Oxland TR. Degenerative mechanics of the lumbar spine. Spine J. 2004;4(6 Suppl):202S–208S. doi: 10.1016/j.spinee.2004.07.013. [DOI] [PubMed] [Google Scholar]
- 9.Iatridis JC, Setton LA, Foster RJ, Rawlins BA, Weidenbaum M, Mow VC. Degeneration affects the anisotropic and nonlinear behaviors of human anulus fibrosus in compression. J Biomech. 1998;31(6):535–544. doi: 10.1016/S0021-9290(98)00046-3. [DOI] [PubMed] [Google Scholar]
- 10.Grignon B, Grignon Y, Mainard D, Braun M, Netter P, Roland J. The structure of the cartilaginous end-plates in elder people. Surg Radiol Anat. 2000;22(1):13–19. doi: 10.1007/s00276-000-0013-7. [DOI] [PubMed] [Google Scholar]
- 11.Mwale F, Iatridis JC, Antoniou J. Quantitative MRI as a diagnostic tool of intervertebral disc matrix composition and integrity. Eur Spine J. 2008;17(Suppl 4):432–440. doi: 10.1007/s00586-008-0744-4. [DOI] [PMC free article] [PubMed] [Google Scholar]
- 12.Majumdar S. Magnetic resonance imaging and spectroscopy of the intervertebral disc. NMR in Biomedicine. 2006;19(7):894–903. doi: 10.1002/nbm.1106. http://doi.org/10.1002/nbm.1106. [DOI] [PubMed] [Google Scholar]
- 13.Palmer AW, Guldberg RE, Levenston ME. Analysis of cartilage matrix fixed charge density and three-dimensional morphology via contrast-enhanced microcomputed tomography. Proc Natl Acad Sci U S A. 2006;103(51):19255–19260. doi: 10.1073/pnas.0606406103. [DOI] [PMC free article] [PubMed] [Google Scholar]
- 14.Kallioniemi AS, Jurvelin JS, Nieminen MT, Lammi MJ, Töyräs J. Contrast agent enhanced pQCT of articular cartilage. Phys Med Biol. 2007;52(4):1209–1219. doi: 10.1088/0031-9155/52/4/024. [DOI] [PubMed] [Google Scholar]
- 15.Silvast TS, Jurvelin JS, Lammi MJ, Töyräs J. pQCT study on diffusion and equilibrium distribution of iodinated anionic contrast agent in human articular cartilage--associations to matrix composition and integrity. Osteoarthritis Cartilage. 2009;17(1):26–32. doi: 10.1016/j.joca.2008.05.012. [DOI] [PubMed] [Google Scholar]
- 16.Bansal PN, Joshi NS, Entezari V, Grinstaff MW, Snyder BD. Contrast enhanced computed tomography can predict the glycosaminoglycan content and biomechanical properties of articular cartilage. Osteoarthritis Cartilage. 2010;18(2):184–191. doi: 10.1016/j.joca.2009.09.003. [DOI] [PubMed] [Google Scholar]
- 17.Bansal PN, Joshi NS, Entezari V, et al. Cationic contrast agents improve quantification of glycosaminoglycan (GAG) content by contrast enhanced CT imaging of cartilage. J Orthop Res. 2011;29(5):704–709. doi: 10.1002/jor.21312. [DOI] [PubMed] [Google Scholar]
- 18.Bansal PN, Stewart RC, Entezari V, Snyder BD, Grinstaff MW. Contrast agent electrostatic attraction rather than repulsion to glycosaminoglycans affords a greater contrast uptake ratio and improved quantitative CT imaging in cartilage. Osteoarthritis Cartilage. 2011;19(8):970–976. doi: 10.1016/j.joca.2011.04.004. [DOI] [PubMed] [Google Scholar]
- 19.Hayward LNM, de Bakker CMJ, Gerstenfeld LC, Grinstaff MW, Morgan EF. Assessment of contrast-enhanced computed tomography for imaging of cartilage during fracture healing. J Orthop Res. 2013;31(4):567–573. doi: 10.1002/jor.22265. [DOI] [PMC free article] [PubMed] [Google Scholar]
- 20.Abraham AC, Liu JW, Tang SY. A murine intervertebral disc organ culture system for the longitudinal monitoring of pro inflammatory cytokines. 2016 Accepted to J Ortho Res. [Google Scholar]
- 21.Pfirrmann CW, Metzdorf A, Zanetti M, Hodler J, Boos N. Magnetic resonance classification of lumbar intervertebral disc degeneration. Spine. 2001;26(17):1873–1878. doi: 10.1097/00007632-200109010-00011. [DOI] [PubMed] [Google Scholar]


