

Abstract
Alterations in myocardial wall texture stand out among ADPKD cardiovascular manifestations, in hypertensive and normotensive patients. To elucidate their pathogenesis, we analyzed the cardiac phenotype in Pkd1cond/cond:Nestincre (CYG+) cystic mice exposed to increased blood pressure, at 5–6 and 20–24 weeks of age, and Pkd1+/− (HTG+) noncystic mice at 5–6 and 10–13 weeks. Echocardiographic analyses revealed decreased myocardial deformation and systolic function in CYG+ and HTG+ mice, as well as diastolic dysfunction in older CYG+ mice, compared to their Pkd1cond/cond and Pkd1+/+ controls. Hearts from CYG+ and HTG+ mice presented reduced polycystin-1 expression, increased apoptosis and mild fibrosis. Since galectin-3 has been associated with heart dysfunction, we studied it as a potential modifier of the ADPKD cardiac phenotype. Double-mutant Pkd1cond/cond:Nestincre;Lgals3−/− (CYG−) and Pkd1+/−;Lgals3−/− (HTG−) mice displayed improved cardiac deformability and systolic parameters compared to single-mutants, not differing from their controls. CYG− and HTG− showed decreased apoptosis and fibrosis. Analysis of a severe cystic model (Pkd1V/V; VVG+) showed that Pkd1V/V;Lgals3−/− (VVG−) mice have longer survival, decreased cardiac apoptosis and improved heart function compared to VVG+. CYG− and VVG− animals showed no difference in renal cystic burden compared to CYG+ and VVG+ mice. Thus, myocardial dysfunction occurs in different Pkd1-deficient models and suppression of galectin-3 expression rescues this phenotype.
Keywords: ADPKD, Pkd1-deficiency, cardiomyopathy, cardiac dysfunction, galectin-3, apoptosis
INTRODUCTION
With the availability of renal replacement therapy, cardiovascular disease has become the most common cause of death in ADPKD (1, 2). Systemic arterial hypertension (SAH) is an early finding, occurring in ~60% of patients prior to a significant decline in glomerular filtration rate (GFR) (3). Left ventricular hypertrophy (LVH) and cardiac valve abnormalities are also often observed (4, 5), while idiopathic dilated cardiomyopathy constitutes a finding just recently described (6).
Polycystin-1 (PC1) and polycystin-2 (PC2), the PKD1 and PKD2 products, are essential for the development of the heart (7, 8). Homozygous Pkd1 and Pkd2 knockout (KO) mice exhibit embryonic lethality due to cardiac defects (9–11). Few studies, however, have addressed the potential heart abnormalities in viable animal models orthologous to ADPKD (6, 11–16). Critical points relating Pkd1/Pkd2 deficiency, including human ADPKD, and cardiac function and structure, therefore, remain to be elucidated. To address this concept, we sought to analyze the cardiac phenotype in three mouse models with distinct profiles of Pkd1-deficiency: noncystic Pkd1-haplonsufficient (14, 17–18), cystic Pkd1cond/cond:Nestincre (14, 19) and severely cystic Pkd1V/V mice (20).
Galectin-3 has emerged as a regulator of fibrosis through mediation of the effects of transforming growth factor (TGF)-β in the heart, liver and kidney (21–23). Elevated galectin-3 circulating levels have been associated with heart failure (24), incident chronic kidney disease (CKD) and rapid decline in GFR (25). This protein plays a role in terminal differentiation of collecting ducts and is expressed in cyst epithelia, where it associates with primary cilia (26). Interestingly, knockout of the galectin-3 gene (Lgals3) aggravated the cystic phenotype in cpk mice, a model nonorthologous to autosomal recessive PKD (26).
We postulated that Lgals3 could potentially be a modifier of cardiac and renal phenotypes resulting from PKD1/Pkd1-deficiency. We also evaluated, therefore, the interaction between Pkd1 and Lgals3 at the cardiac and renal levels, by knocking out Lgals3 in each of the Pkd1-deficient models. Our results revealed that Pkd1-haploinsufficient and Pkd1cond/cond:Nestincre mice develop cardiac abnormalities that resemble human ADPKD. Notably, this phenotype was largely rescued by knocking out Lgals3, an effect associated with decrease in apoptosis. Moreover, in the Pkd1V/V model, which includes early end-stage renal disease and mortality, Lgals3 KO improved survival. Our data suggest that different patterns of Pkd1 deficiency can lead to cardiac dysfunction and that galectin-3 has a role in intensifying this phenotype and limiting survival, effects potentially applicable to human ADPKD.
RESULTS
Pkd1-deficient mouse models and double mutants associated with Lgals3 knockout
We used three mouse models with distinct patterns of Pkd1 deficiency, which were also bred to Lgals3 KO animals to generate double mutants that allowed evaluation of potential genetic interaction between the two loci. All experiments were performed in C57BL/6-background males.
The heterozygous mouse with a null mutation reproduces the systemic Pkd1-haploinsufficient background found in ADPKD1 patients but with no renal cysts by 15 weeks (wk) of life (Pkd1+/−; HTG+). Wild-type littermates (Pkd1+/+; WT) were used as controls. Homozygous mice for a Pkd1-floxed allele, in turn, with a mosaic pattern of gene inactivation driven by a Nestin-Cre transgene and excision of exons 2–4 (Pkd1cond/cond:Nestincre; CYG+) (14, 17), developed a milder renal phenotype in our animal-care facility than in another center (14, 19). The CYG+ mice develop cystic kidneys and increased mean arterial pressure (MAP) (14), reproducing the ADPKD phenotype, however do not have a systemic Pkd1-haploinsufficiency background. Noncystic animals (Pkd1cond/cond; NC) were their controls. The third model, homozygous mice for a Pkd1-knockin hypomorphic allele that prevents PC1 cleavage at the GPS site (Pkd1V/V; VVG+), develop early-onset, post-natal, massive cystic disease, characterized by distal nephron involvement, uremia and early mortality (20). The three models were bred with homozygous mice for a Lgals3-null mutation (Lgals3−/−; G−) (27), generating Pkd1+/−:Lgals3−/− (HTG−), Pkd1cond/cond:Nestincre;Lgals3−/− (CYG−) and Pkd1V/V;Lgals3−/− (VVG−) double mutants.
Pkd1-haploinsufficient and Pkd1-deficient cystic mice display abnormal myocardial deformation as well as systolic and diastolic dysfunction
Speckle-tracking based strain echocardiography has emerged as an imaging tool for fast cardiovascular phenotyping in mice (28, 29). This methodology yields higher sensitivity to detect subtle and early myocardial changes, compared to conventional echocardiography (see mini-glossary in Supplementary Information). This technique allows analysis of myocardial tissue deformation by quantifying tissue strain and strain rate (SR). While the former represents relative deformation, indicating how much the myocardial tissue deforms, the later is its temporal derivative, indicating how fast the myocardial tissue deforms. In this study strain and SR results are expressed as global values, resulting from data averaged across six standardized segments and derived from peak values.
Both HTG+ and CYG+ mice showed decrease in half (4/8) of the assessed myocardial deformation parameters at 5–6 wk, a finding consistent with reduced myocardial deformation (Figures 1, 2, S1 and S2; Table S1).
Figure 1.

Strain analyses in Pkd1-deficient mice. Comparative analyses of (A, E, I and M) short-axis circumferential strain; (B, F, J and N) short-axis radial strain; (C, G, K and O) long-axis longitudinal strain; and (D, H, L and P) long-axis radial strain among (A–D) WT, HTG+ and HTG− mice at 5–6 wk of age; (I–L) WT, HTG+ and HTG− animals at 12–13 wk; (E–H) NC, CYG+ and CYG− mice at 5–6 wk; and (M–P) NC, CYG+ and CYG− animals at 22–23 wk. Parametric data were compared using one-way ANOVA, with results presented as mean±SD. A–D and I–L: *p<0.05 vs WT; †p<0.05 vs HTG+; ††p<0.01 vs HTG+; †††p<0.01 vs HTG+. EH and M–P: *p<0.05 vs NC; **p<0.01 vs NC; †p<0.05 vs CYG+; ††p<0.01 vs CYG+; †††p<0.01 vs CYG+.
Figure 2.

Strain rate analyses in Pkd1-deficient mice. Comparative analyses of (A, E, I and M) short-axis circumferential strain rate; (B, F, J and N) short-axis radial strain rate; (C, G, K and O) long-axis longitudinal strain rate; and (D, H, L and P) long-axis radial strain rate among (AD) WT, HTG+ and HTG− mice at 5–6 wk of age; (I–L) WT, HTG+ and HTG− animals at 12–13 wk; (E–H) NC, CYG+ and CYG− mice at 5–6 wk; and (M–P) NC, CYG+ and CYG− animals at 22–23 wk. Parametric data were compared using one-way ANOVA, with results presented as mean±SD. A–D and I–L: *p<0.05 vs WT; †p<0.05 vs HTG+; †††p<0.01 vs HTG+. E–H and M–P: *p<0.05 vs NC; **p<0.01 vs NC; †p<0.05 vs CYG+; ††p<0.01 vs CYG+.
Different sets of HTG+ and CYG+ animals were evaluated at 12–13 and 22–23 wk, respectively. CYG+ mice presented decrease in all but one strain parameters, and even this displayed a similar trend (Figures 1 and 2; Table S1). HTG+ animals also displayed reduced short-axis radial SR and longitudinal strain compared with WTs, and three other strain parameters followed the same trend.
Conventional echocardiography performed at 5–6 wk revealed reduced left ventricular ejection fraction (LVEF) in HTG+ compared to WT mice and in CYG+ compared to NC animals, demonstrating systolic dysfunction. The myocardial performance index (MPI), a global parameter of myocardial function, followed the same pattern (see mini-glossary in Supplementary Information). No signs of diastolic dysfunction, however, were detected in the younger Pkd1-deficient groups (Figures 3, 4 and S3; Table S2).
Figure 3.

Structural and systolic function analyses in Pkd1-deficient mice. Comparative analyses of (A, E, I and M) left ventricular mass normalized to body weight (LVM/BW); (B, F, J and N) left ventricular internal diameter in diastole normalized to body weight (LVIDD/BW); (C, G, K and O) left ventricular ejection fraction (LVEF); and (D, H, L and P) myocardial performance index (MPI) among (A–D) WT, HTG+ and HTG− mice at 5–6 wk of age; (I–L) WT, HTG+ and HTG− animals at 12–13 wk; (E–H) NC, CYG+ and CTG− mice at 5–6 wk; and (M–P) NC, CYG+ and CYG− animals at 22–23 wk. Parametric data were compared using one-way ANOVA, with results presented as mean±SD. A–D and I–L: *p<0.05 vs WT; **p<0.01 vs WT; †p<0.05 vs HTG+; ††p<0.01 vs HTG+; and †††p<0.001 vs HTG+. E–H and M–P: *p<0.05 vs NC; **p<0.01 vs NC; †p<0.05 vs CYG+; ††p<0.01 vs CYG+; and †††p<0.001 vs CYG+.
Figure 4.
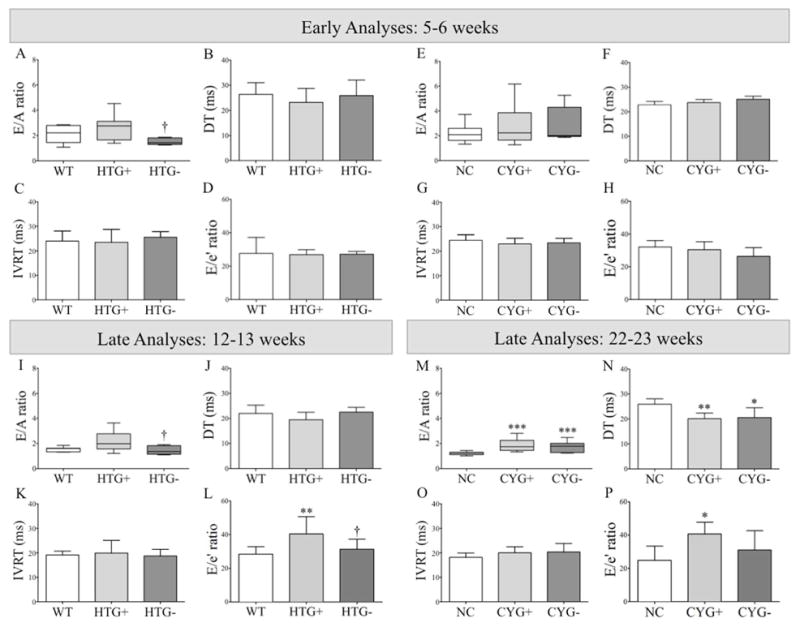
Analyses of diastolic function in Pkd1-deficient mice. Comparative analyses of (A, E, I and M) E/A ratio; (B, F, J and N) deceleration time (DT); (C, G, K and O) isovolumetric relaxation time (IVRT); and (D, H, L and P) E/e′ ratio among (A–D) WT, HTG+ and HTG− mice at 5–6 wk of age; (I–L) WT, HTG+ and HTG− animals at 12–13 wk; (E–H) NC, CYG+ and CYG− mice at 5–6 wk; and (M–P) NC, CYG+ and CYG− animals at 22–23 wk. Parametric data were compared using one-way ANOVA, with results presented as mean±SD. Non-parametric data were compared by the Kruskal-Wallis test, with results expressed as median (lower to upper quartile). A–D and I–L: **p<0.01 vs WT; and †p<0.05 vs HTG+. E–H and M–P: **p<0.01 vs NC; and ***p<0.001 vs NC.
The older Pkd1-deficient groups also presented signs of systolic dysfunction when compared with their respective WT and NC controls (Figure 3; Table S3), at a similar magnitude to that observed in the younger mice. At older ages, however, both Pkd1-deficient groups presented signs of diastolic dysfunction, more severely in CYG+ mice. The E/A wave ratio, a parameter applied to identify patterns of abnormal mitral inflow (see mini-glossary in Supplementary Information), was higher in CYG+ than NC mice, whereas a similar trend was detected in HTG+s (Figure 4 and S4; Table S3). These data were supported by the finding of shorter mitral valve deceleration time (DT) in CYG+ mice; the same trend was observed in HTG+s. This parameter reflects the flow velocity decline in early diastole, also providing meaningful information on diastolic function (see mini-glossary in Supplementary Information).
The E/e′ wave ratio, a predictor of left ventricular filling pressure (see mini-glossary in Supplementary Information), was not significantly different in younger Pkd1-deficient groups. It was higher, however, in older CYG+ than NC mice and in older HTG+s than WTs. Since no signs of mitral valve reflux (not even prolapse) were detected, the worsening of this index suggests progression of ventricular dysfunction with aging (Figure 4; Tables S2 and S3).
No evidence of increased left ventricular mass (LVM) or dilated cardiomyopathy was detected by assessment of LVM normalized to body weight (LVM/BW) and left ventricular internal diameter in diastole normalized to BW (LVIDD/BW) indexes, respectively (Figure 3, Tables S2 and S3).
Pkd1 deficiency is the primary cause of cardiac dysfunction
HTG+ animals were shown not to have increased mean arterial pressure (MAP) at 13 wk in the 129Sv background (14) and our current study has confirmed this finding in the C57BL/6 background (Table S4). On the other hand, we have previously shown that CYG+ mice presented elevated MAP at 5 and 13 wk in the C57BL/6 background (14), while a non-significant higher numerical value was observed at 24 wk (Table S4). Whereas these data might a priori suggest that long-term increased MAP could play the major role in CYG+ cardiac dysfunction, the observation that this phenotype occurs at a significant level already at 5–6 wk in such animals is highly suggestive that the primary cause of this dysfunction is deficiency of Pkd1 activity. Decreased gene function, therefore, is apparently the primary cause of heart dysfunction in both models.
Polycystin-1 expression is reduced in Pkd1-deficient hearts, a phenotype rescued by Lgals3 knockout in Pkd1-deficient cystic mice but not in Pkd1-haploinsufficient animals
The hypothesis of Pkd1 deficiency as the primary cause of cardiac dysfunction required the analyses of PC1 expression in HTG+ and CYG+ hearts. Despite low PC1 expression in normal heart and the limitations of western blot analyses, our data supports this hypothesis, revealing reduced PC1 expression in HTG+ compared to WT hearts, as well as in CYG+ compared to NC organs (Figure 5). We also extended our analysis to potential effects of galectin-3 and its KO on PC1 expression. Notably, PC1 expression increased in CYG− compared with CYG+ cardiac tissue, reaching levels similar to those observed in NC hearts. HTG− cardiac tissue, however, displayed a non-significant numerical increase in PC1 expression compared with HTG+ hearts.
Figure 5.

Polycystin-1, galectin-3 and TGF-β1 expression in heart tissue. Comparative western blot analyses of polycystin-1 expression among (A) WT (n=6), HTG+ (n=6) and HTG− (n=8) mice; and (D) NC (n=7), CYG+ (n=7) and CYG− (n=6) animals. Comparative analyses of galectin-3 expression between (B) WT (n=7) and HTG+ (n=9) mice; and (E) NC (n=5) and CYG+ (n=5) animals. Comparative analyses of TGF-β1 expression among (C) WT (n=7), HTG+ (n=9) and HTG− (n=5) mice; and (F) NC (n=4), CYG+ (n=4) and CYG− (n=4) animals. A, D: 6 wk; B, C: 13 wk; E, F: 23 wk. Immunoblots showing polycystin-1/GAPDH expression ratio in (G) WT, HTG+ and HTG− mice; and (I) NC, CYG+ and CYG− animals. L: lung tissue; K: medullary kidney tissue. Immunoblots showing galectin-3/GAPDH and TGF-β1/GAPDH expression ratios in (H) WT, HTG+ and HTG− mice; and (J) NC, CYG+ and CYG− animals. Parametric data were compared by one-way ANOVA in A and D, with results presented as mean±SD. Non-parametric data were compared by the Mann-Whitney test in B, C, E and F, with results presented as median (lower to upper quartile). A–C: **p<0,01 vs WT; and ***p<0,001 vs WT. D–F: *p<0,05 vs NC; and †p<0,05 vs CYG+.
Galectin-3 expression, but not TGF-β1 is increased in Pkd1cond/cond:Nestincre hearts
Previous studies have shown that galectin-3 expression is increased in failing hearts of murine models, while its direct administration in normal hearts can cause cardiac dysfunction (30, 31). Since then, galectin-3 has been associated to heart dysfunction in humans, as a modulator of the TGF-β pathway (21–23). Based on the Lgals3-KO modulation of PC1 expression in CYG− hearts, we analyzed by western blot galectin-3 and TGF-β1 expression in the cardiac tissue of both Pkd1-deficient models. Our results revealed higher galectin-3 expression in CYG+ compared with NC hearts, a pattern not observed between HTG+ and WT mice (Figure 5). TGF-β1 expression, on the other hand, was heterogeneous within the groups and did not differ between the Pkd1-deficient mice and their controls.
Pkd1-haploinsufficient and Pkd1-deficient cystic mice show increased cardiac apoptosis and interstitial fibrosis
Higher apoptotic rates were detected in HTG+ than WT hearts and in CYG+ than NC organs (Figure 6). As expected, cardiac cell proliferation was virtually absent in both models and controls (data not shown).
Figure 6.

Apoptosis and fibrosis in heart tissue. Comparative analyses of (A) TUNEL staining among WT (n=7), HTG+ (n=9) and HTG− (n=7) mice; (B) TUNEL staining among NC (n=9), CYG+ (n=7) and CYG− animals (n=8); (C) Sirius red staining among WT (n=8), HTG+ (n=11) and HTG− (n=8) mice; and (D) Sirius red staining among NC (n=9), CYG+ (n=7) and CYG− (n=6) animals. A, C: 13 wk; B, D: 23 wk. (E) Representative images of TUNEL staining in cardiac tissue. Original magnification, x400; inserts x800. Scale bars, 10 μm. (F) Representative images of Sirius red staining in heart tissue. Original magnification, x400; scale bars, 10 μm. Non-parametric data were compared by Kruskal-Wallis test, with results expressed as median (lower to upper quartile). A, C: **p<0.01 vs WT; †††p<0.001 vs HTG+. B, D: **p<0.01 vs NC; ***p<0.001 vs NC; ††p<0.01 vs CYG+; †††p<0.001 vs CYG+.
The cardiac interstitial fibrosis index was mild but higher in HTG+ than WT hearts and in CYG+ than NC mice (Figure 6).
Lgals3 knockout largely rescues the heart phenotype in Pkd1-haploinsufficient and Pkd1-deficient cystic mice
Strain echocardiography revealed improvement in six of eight analyzed parameters in HTG− and CYG− mice at 5–6 wk of age when compared with their respective WT and NC controls (Figures 1, 2, S1 and S2; Table S1). Conventional echocardiography, in turn, showed higher LVEF in HTG− than HTG+ mice, a pattern also observed in CYG− compared with CYG+ animals. Notably, HTG− and CYG− mice presented equivalent LVEF values to WTs and NCs, indicating complete rescue of systolic function. The E/A ratio was lower in HTG− than HTG+ animals but not than WTs, whereas DT did not differ among the three genotypes. The E/A ratio in CYG− mice, in turn, did not differ from the CYG+ group but was higher than NCs. DT paralleled these findings, being lower in CYG− than NC mice but not different between CYG− and CYG+ animals. MPI values were also rescued in HTG− compared to HTG+ mice as well as in CYG− compared to CYG+ animals, confirming the rescue of systolic function (Figures 3, 4 and S3; Table S2).
Most strain parameters were rescued in 12–13-wk HTG− and 22–23-wk CYG− mice, not differing from their respective controls WT and NC. At these ages, conventional echocardiography revealed higher LVEF in HTG− than HTG+ animals, a pattern also observed in CYG− compared with CYG+ mice. The HTG− and CYG− values were equivalent to WTs and NCs, indicating complete rescue of systolic function. The E/A ratio was lower in HTG− than HTG+ animals, while both E/A ratio and DT did not differ between HTG− and WT animals. CYG− mice, however, did not show improvement in E/A ratio and DT compared to CYG+s. While no difference in E/e′ ratio was detected at 5–6 wk, this parameter was lower in HTG− than HTG+ mice at 12–13 wk but not in CYG− compared with CYG+ animals at 22–23 wk. MPI was also improved in CYG− compared with CYG+ mice, following the same pattern of systolic function rescue.
The heart phenotype improvement determined by Lgals3 knockout in Pkd1-deficient mice is associated with reduction in apoptosis and fibrosis
Cardiac apoptotic rates were lower in HTG− than HTG+ mice and in CYG− compared to CYG+ animals, reaching similar levels to WTs and NCs. Our analyses also revealed lower fibrotic indexes in HTG− than HTG+ hearts and in CYG− compared to CYG+ hearts, approaching the WT and NC levels (Figure 6).
Renal phenotype in Pkd1-haploinsufficient and Pkd1-deficient cystic mice
Serum urea nitrogen (SUN) did not differ between HTG+ and WT and between CYG+ and NC mice. No differences in fractional excretion of Na+ (FENa), K+ (FEK) and Cl− (FECl) between such groups were detected either. Ultrasound analysis confirmed absence of renal cysts in WT, HTG+ and NC animals, showed no cysts in HTG-s, and confirmed the presence of renal cysts in CYG+ and CYG− mice (Figure 7; Table S4).
Figure 7.

Renal phenotype in Pkd1-deficient mice. Comparative analyses of SUN among (A) WT, HTG+ and HTG− mice at 10–11 wk of age, and among (B) NC, CYG+ and CYG− animals at 20–21 wk; and comparative analyses of renal cystic index between (C) CYG+ and CYG− mice at 22–23 wk. (D) Representative images of galectin-3 staining in WT, HTG+, HTG−, NC, CYG+ and CYG− kidneys. Original magnification, x400; scale bar, 10 μm. The * symbol indicates a cyst. (E) H&E representative images of kidney cysts in CYG+ and CYG− mice, and absence of cysts in NC mice. Original magnification, x40; scale bar, 50 μm. (F) Representative ultrasound images in longitudinal axis of NC, CYG+ and CYG− kidneys; scale bar, 2.5 mm. Non-parametric data were compared by Kruskal-Wallis test (A, B) and Mann-Whitney test (C), with results expressed as median (lower to upper quartile).
A higher renal cell proliferation rate was detected in HTG+ than WT mice and in CYG+ than NC kidneys. HTG+ animals showed increased renal apoptotic rate compared to WTs, a difference also found between CYG+ and NC kidneys. Although mild, renal fibrosis was also higher in HTG+ than WT mice and in CYG+s than NCs (Figure 8).
Figure 8.

Cell proliferation, apoptosis and fibrosis in renal tissue. Comparative analyses of renal cell Ki-67 staining among (A) WT (n=6), HTG+ (n=10) and HTG− (n=6) organs, and (D) NC (n=7), CYG+ (n=5) and CYG− (n=7) in whole kidney, and in CYG+ and CYG− in cyst epithelia; comparative analyses of renal TUNEL staining among (B) WT (n=5), HTG+ (n=6) and HTG− (n=5) mice in whole kidney, and in CYG+ and CYG− cyst epithelia, and (E) NC (n=7), CYG+ (n=6) and CYG− (n=6) animals; and comparative analyses of area of interstitial fibrosis among (C) WT (n=8), HTG+ (n=11) and HTG− (n=7) kidneys, and (F) NC (n=9), CYG+ (n=7) and CYG− (n=7) organs. (G) Representative images of Ki-67 staining. (H) Representative images of TUNEL staining. (I) Representative images of Sirius red staining. G–H: Original magnification, x400; inserts x800; scale bar, 10 μm. I: Original magnification, x200; scale bar, 10 μm. Non-parametric data were compared by Kruskal-Wallis or Mann-Whitney test, with results expressed as median (lower to upper quartile). A–C: **p<0.01 vs WT; ***p<0.001 vs WT; †p<0.05 vs HTG+. D–F: *p<0.05 vs NC; ***p<0.001 vs NC. †p<0.05 vs CYG+. D, E: ¥¥p<0.01 vs CYG+ in cyst epithelia.
Lgals3 knockout rescues cell proliferation, apoptosis and fibrosis phenotypes in Pkd1-deficient kidneys
The absence of Lgals3 rescued the cell proliferation phenotype in HTG− kidneys, decreasing its rate in comparison to HTG+s, and in CYG− mice, reaching lower values than in CYG+s (Figure 8). The same effect was observed in cyst epithelia. Lgals3 knockout also rescued the tubular apoptotic phenotype in HTG− kidneys, reducing its rate when compared to HTG+s, while a similar trend was observed in CYG− kidneys (Figure 8). The cyst epithelia apoptotic rate, in turn, was significantly lower in CYG− than CYG+ kidneys. Renal interstitial fibrosis phenotype was also rescued in HTG− mice, whereas a similar trend was detected in CYG− kidneys (Figure 8). No variations in FENa, FEK and FECl, however, were verified in HTG− and CYG− animals (Table S4). Ultrasound analyses, in turn, did not reveal different cystic indexes between CYG− and CYG+ mice (Figure 7; Table S4). HTG− mice presented, however, a lower number of glomeruli per left kidney than WT and HTG+ animals (Figure S5).
Lgals3 knockout prolongs survival in uremic Pkd1V/V mice by rescuing systolic function
Absence of galectin-3 expression increased survival, extending it from 21 days (d) in VVG+ to 30 d in VVG− mice (Figure 9). To elucidate the likely cause of this finding, the heart and kidney phenotypes were analyzed at P18. Interestingly, VVG+ animals showed reduced LVEF compared to WT mice, revealing significant systolic dysfunction. VVG− mice, in turn, displayed higher LVEF than VVG+ and similar values to WT animals, indicating complete rescue of systolic function by knocking out Lgals3. No evidence of increased LVM/BW, dilated cardiomyopathy (increased LVIDD/BW) or pleural effusion was detected in VVG+ and VVG− mice (Table S5). Interestingly, VVG+ animals showed increased cardiac apoptosis compared to WTs, a phenotype that was rescued in VVG− mice (Figure 10). We found no difference, however, in heart fibrosis as well as in galectin-3, TGF-β1 and pSmad2/Smad2 expression (Figure 10).
Figure 9.

Effects of Lgals3 knockout in survival, cardiac and renal phenotypes in Pkd1+/+, Pkd1V/V and Pkd1V/V;Lgals3−/− mice. (A) Survival of VVG+ and VVG− mice. The median age of survival was 21 days [20–24] for VVG+ mice (n=22) mice and 30 days [26–33] for VVG− animals (n=22). (B) Left ventricular ejection fraction in WT, VVG+ and VVG− mice at P18. (C) M-mode images used for LVEF calculation in (B). (D) Comparative analyses of renal cystic index between VVG+ and VVG− mice at P18. (E) Representative ultrasound images in transversal axis of VVG+ and VVG− kidneys; scale bar, 2.5 mm. In (A), data were compared with the Log-rank test. ***p<0.001 vs VVG+. In (B), parametric data were compared using one-way ANOVA, with results presented as mean±SD. In (D), non-parametric data were compared using the Kruskal-Wallis test, with results expressed as median (lower to upper quartile). **p<0.01 vs WT; ††p<0.01 vs VVG+.
Figure 10.

Cardiac phenotype in Pkd1+/+, Pkd1V/V and Pkd1V/V;Lgals3−/− mice at P18. (A) TUNEL staining in WT (n=5), VVG+ (n=6) and VVG− (n=7) hearts; (B) area of cardiac interstitial fibrosis in WT (n=5), VVG+ (n=6) and VVG− (n=7) mice. (C) Comparative western blot analysis of galectin-3 expression in heart tissue in WT (n=6) and VVG+ (n=6) animals; (D) comparative analysis of TGF-β1 expression in WT (n=6), VVG+ (n=6) and VVG− (n=5) hearts; (E) comparative analysis of pSmad2/Smad2 ratio in WT (n=6), VVG+ (n=6) and VVG− (n=6) hearts. Representative images in heart tissue of (F) galectin-3 expression; (G) TUNEL staining; and (H) Sirius red staining. In (F–H), original magnification, x400; inserts x800; scale bar, 10 μm. In (H), original magnification, x200; scale bar, 10 μm. Immunoblots showing galectin-3 (I) and TGF-β1 (J) expression relative to GAPDH in WT, VVG+ and VVG− hearts. Parametric data were compared using one-way ANOVA, with results presented as mean±SD. Non-parametric data were compared by Kruskal-Wallis test, with results expressed as median (lower to upper quartile). **p<0.01 vs WT; †p<0.05 vs VVG+.
The kidney phenotype characterization revealed no SUN difference between VVG+ and VVG− mice at P18, although the values were higher in both groups compared with WTs (Figure 11). The renal cystic index also did not differ between VVG+ and VVG− mice (Figure 9). In addition, the rate of renal cell proliferation was higher in VVG+ than WT animals, a phenotype that was rescued in VVG-s (Figure 11). The same rescue effect was detected at the level of the cyst epithelia. A similar behavior was observed for the renal apoptotic rate, with higher rates in VVG+ than WT kidneys, while a trend of rescue was verified in VVG-s. The cyst epithelia apoptotic rate, in turn, was reduced in VVG− compared to VVG+ mice. A higher fibrotic index was also observed in VVG+ compared to WT kidneys, with a trend towards rescue shown in VVG-s (Figure 11).
Figure 11.

Renal phenotype in Pkd1+/+, Pkd1V/V and Pkd1V/V;Lgals3−/− mice at P18. Comparative analyses of (A) SUN among WT (n=5), VVG+ (n=6) and VVG− (n=8) mice; (B) Ki-67 staining in renal tissue among WT (n=5), VVG+ (n=6) and VVG− (n=8) animals; (C) TUNEL staining in renal tissue among WT (n=5), VVG+ (n=5) and VVG− (n=6) mice; and (D) area of interstitial fibrosis in renal tissue among WT (n=5), VVG+ (n=6) and VVG− (n=8) animals. Representative images in kidney tissue of (E) galectin-3 expression; (F) Ki-67 staining; (G) TUNEL staining; and (H) Sirius red staining. In (E–G), original magnification, x400; inserts x800; scale bar, 10 μm. In (H), original magnification, x200; scale bar, 10 μm. Non-parametric data were compared by Kruskal-Wallis test, with results expressed as median (lower to upper quartile). *p<0.05 vs WT; **p<0.01 vs WT; ***p<0.001 vs WT; †p<0.05 vs VVG+. ¥¥p<0.01 vs VVG+ in cyst epithelia.
DISCUSSION
Understanding the mechanisms involved in ADPKD-associated cardiac manifestations may open specific therapeutic perspectives, however the precise pathways and interactions remain largely unknown. To study key aspects of them, we analyzed the cardiac phenotype in viable mouse models orthologous to this disease. HTG+ mice may closely represent ADPKD1 heart disease, given their Pkd1-haploinsufficient background also present in the patients. This model does not allow, however, investigation of potential effects of hypertension on the cardiac phenotype. Moreover, the virtual absence of renal cysts at the analyzed age suggests that HTG+ animals may possibly have less Pkd1 second hits than ADPKD1 patients, in kidneys and other organs as the heart. The CYG+ model, on the other hand, does not have the Pkd1-haploinsufficient background but develops early increased blood pressure (BP). In addition, such mice contain a substantial number of cells with Pkd1 double hit, in kidneys and heart. The cardiac scenario of ADPKD1, therefore, includes features of HTG+ and CYG+ animals, which together likely contemplate the basic ADPKD1 heart status. The nature of these models and such integrated analyses strengthen the value of translating the results and conclusions of this study to human ADPKD.
While our data suggested that Pkd1 deficiency is the primary cause of cardiac dysfunction in HTG+ mice, chronically increased MAP might be a major determinant of this phenotype in the CYG+ model. The presence of overt dysfunction in these mice already at 5–6 wk, however, strongly suggests that Pkd1 deficiency is also the primary cause of heart dysfunction in this model. Despite the low PC1 expression in normal heart, this mechanism is also supported by the observation of its decreased expression in HTG+ and CYG+ cardiac tissue. The detection of diastolic dysfunction in CYG+ mice at 22–24 wk but not at 5–6 wk, however, suggests that higher MAP may worsen the heart phenotype with age.
PC1 has been shown to function as a mechanosensor in cardiomyocytes, required both for stretch-induced cardiomyocyte hypertrophy and pressure overload-induced hypertrophy (15). PC1 stabilizes α1C protein, a subunit of the L-type calcium channel involved in calcium influx into the cardiomyocyte. Along this line, PC1-KO hearts display decreased α1C protein levels and systolic dysfunction (15). Heart function has also been shown to depend on Pkd2 activity, as evidenced by the fact that lack of PC2 in zebrafish led to signs of heart failure, as well as the finding that ADPKD2 patients are prone to develop idiopathic dilated cardiomyopathy (6). While PC2 regulates intracellular calcium cycling, a follow-up report showed that Pkd2-haploinsufficient mice present a desensitized calcium-contraction coupling in cardiomyocytes and an altered response to adrenergic stimulus (16).
PC1 is a critical modulator of apoptosis and fibrosis (32, 33). Perturbations in these cell processes, in turn, can be potentially involved in the development of heart failure (34, 35). Unlike the kidneys, the cardiac phenotype of Pkd1-deficient mice is parenchymal and non-focal, not including cystic lesions. Although heart fibrosis was increased, it was mild in the HTG+ and CYG+ mice and absent in VVG+, a model that also developed abnormal systolic function. The observed HTG+ and CYG+ fibrotic phenotypes were, in fact, much less severe than those reported in other cardiac disorders (35). It was not surprising, therefore, that TGF-β1 expression was not increased in Pkd1-deficient hearts. Interestingly, the pSmad2/Smad2 ratio also did not differ between VVG+ and WT mice. These findings suggest that fibrosis is unlikely to be the primary lesion of heart dysfunction in Pkd1-deficient models, although it can be a consequence of such a phenotype and exacerbate it with aging. Notably, we also detected mild fibrosis in Pkd1-deficient kidneys.
Our models displayed, however, increased cardiac apoptosis, suggesting that, in addition to defective calcium cycling/influx in cardiomyocytes, increased programmed cell death may also be a relevant determinant of the Pkd1-deficient heart dysfunction. Since cardiomyocytes do not proliferate, a relatively small rate of apoptosis can have significant functional impact. Moreover, given that apoptosis interruptus has been recognized as an important mechanism of heart failure (34), the number of TUNEL-positive cells likely represents only the cells that underwent complete apoptosis with nuclear damage. In this context, a significantly higher number of apoptotic cells, including complete and incomplete apoptosis, are probably present in the Pkd1-deficient hearts.
Galectin-3 regulates gene expression, cell cycle, apoptosis, organogenesis and cell-cell and cell-matrix interactions (36, 37). Its expression was found to be higher in CYG+ but not in HTG+ compared with their controls, suggesting that Pkd1-full-KO cardiac cells may trigger increased galectin-3 production by cardiomyocytes and/or other cells such as cardiac macrophages.
To evaluate galectin-3 as a potential modifier of the cardiac phenotype associated with ADPKD, analyses of Lgals3 KO mice became essential. Myocardial deformability was rescued in CYG− and HTG− mice. Increase in LVIDD/BW was observed in CYG+ mice at both ages, however 22–23-wk CYG− presented a lower value than CYG+ animals. A similar effect was detected in 5–6-wk HTG− mice. Such data suggest that Lgals3 KO may have a primary anti-dilatation effect independent of the defective phenotype. The three double mutants showed improved systolic performance compared to their single mutants at all evaluated ages. This finding was associated with decreased cardiac apoptosis in the older HTG+ and CYG+ as well as in the VVG+ mice. The return to baseline levels supports phenotype rescue by Lgals3 KO in all Pkd1-deficient animals. Inhibition of the apoptotic response, therefore, appears to have contributed to the functional rescue effects.
Diastolic dysfunction was observed in 22–23-wk CYG+ mice, with a similar trend detected in 12–13-wk HTG+s. Only Pkd1-haploinsufficient animals, however, benefited from knocking out Lgals3. These results suggest that the diastolic rescuing mechanism observed in HTG+s may differ from the one that underlies the rescue of systolic function.
PC1 and galectin-3 are expressed in primary cilium (38, 26), an organelle essential for early heart development (39). Since galectin-3 expression is increased in CYG+ hearts, it is possible that elevated levels may downregulate PC1 expression in primary cilia. This effect may have contributed to the pronounced decrease of PC1 expression in CYG+ hearts. Removal of galectin-3, in turn, may decrease PC1 degradation, increasing its expression in primary cilia of Pkd1-expressing cells. This model is consistent with the return of PC1 expression to basal levels in CYG− hearts. Previous data support this hypothesis, as galectin-3 KO increases the expression of ENaC α-subunit in renal cortex (40). Although the Lgals3-KO-mediated increase in PC1 expression occurs in Pkd1-expressing cells, the syncytial nature of cardiomyocytes may potentially allow a positive impact also on Pkd1-KO cardiomyocytes. According to this model, Lgals3 KO did not lead to a significant increase in PC1 expression in HTG− cardiac tissue because galectin-3 cardiac expression was not higher in HTG+ hearts.
The proposed regulation of PC1 expression by galectin-3 in CYG+ hearts, however, does not necessarily require expression of this protein in cilia, since extracellular galectin-3 might play this role. Moreover, extracellular galectin-3 can induce apoptosis (36), a likely contributor to cardiac dysfunction in our models. In addition, galectin-3 has not been detected in cardiomyocytes in previous studies (31, 41), suggesting that the proposed modulation may depend on extracellular galectin-3. More detailed analyses, however, are required to investigate whether galectin-3 is expressed in the primary cilium and/or at specific time windows in cardiomyocytes. The anti-apoptotic effect of PC1 (42) may also contribute to the decrease in apoptosis and functional rescue induced by Lgals3 KO in CYG− hearts. The absence of higher galectin-3 levels in HTG+ hearts, on the other hand, suggests that the decrease in PC1 expression is determined exclusively by the Pkd1-haploinsufficient background. The lack of significant increase of PC1 expression in HTG− hearts, in turn, suggests that Lgals3 KO rescues the phenotype in HTG− mice by halting galectin-3 deleterious effects not directly related to the PC1 expression level.
The absence of increased BP or worse renal function in HTG− mice supports the concept that despite the ~10%-decrease in glomeruli number, Lgals3 KO does not introduce a secondary deleterious renal effect. Lgals3 KO, in fact, showed no significant impact on cystic burden and renal function, despite decrease in cell proliferation in CYG−, HTG− and VVG− kidneys, reduction in apoptosis in CYG− and VVG− cystic epithelia and HTG− kidneys, and decreased renal fibrosis in HTG− animals, a trend also observed in cystic mice. This lack of change in cystic burden differs from its worsening in the cpk mice (26), suggesting that Lgals3 KO may have beneficial and deleterious effects on cystic phenotypes. This hypothesis is supported by the multifunctional nature of galectin-3, a protein capable of generating opposing effects in kidney tissue: Lgals3 KO aggravated diabetic nephropathy (43), while attenuating injury in an ischemia/reperfusion model (44). Therefore, different, antagonistic factors and signaling pathways triggered by Lgals3 KO could differentially affect the cystic phenotype in our ADPKD1 orthologous models and in the recessive, non-orthologous model cpk. A deleterious effect determined by Lgals3 KO may have occurred at the epithelial level of cpk cysts, which may have not been balanced by sufficient decrease in cell proliferation and apoptosis. In our models, on the other hand, this negative effect induced by knocking out Lgals3 may have also occurred, but it was likely counterbalanced by the decrease in cell proliferation and apoptosis at the cystic epithelia, leading to a final non-significant change in cystic burden.
Lgals3 KO prolonged survival of VVG+ mice, revealing a partial rescuing effect on systemic phenotype. The lack of difference in renal function and cystic burden between the VVG+ and VVG− groups suggests that improvement in renal phenotype is not the determinant of increased survival. On the other hand, the heart dysfunction observed in VVG+ mice, associated with the complete rescue of systolic function determined by Lgals3 KO in VVG− mice, suggests that the detected improvement in survival is based on superior cardiac function. Altogether, our data support that uremia is the essential cause of death in this model, with heart dysfunction contributing to accelerate it. Lgals3 KO, in turn, corrects the cardiac phenotype, allowing the animals to extend their lives by a median of nine days. Recently, two papers described new roles of polycystins in lymphatic development (45, 46), suggesting that edema could contribute to death. In our study, however, VVG+ and VVG− mice were not found to have macroscopic edema, ascites or pericardial effusion. In support of our observations, Outeda et al. (47) showed that Pkd1-null embryos exhibited a dilated and disorganized lymphatic network, while no abnormality in such a network was observed in Pkd1V/Vs.
Our findings demonstrate abnormal myocardial deformability and cardiac dysfunction associated with different profiles of Pkd1 deficiency. They also suggest that a primary effect dependent on PC1 decreased expression is responsible for the development of this phenotype. Our results show, in addition, that Lgals3 KO rescues the normal strain and systolic-function phenotypes in cystic and Pkd1-haploinsufficient mice. This effect is associated with reduction in cardiac apoptosis and involves mechanisms that may be related to increase in PC1 expression. Lgals3 KO also prolongs survival of Pkd1V/V animals likely by rescuing systolic function. Given the complementary nature of the evaluated Pkd1-deficient models, our data provide key insights into the understanding of the human ADPKD cardiac phenotype, as well as to the potential use of galectin-3 as a biomarker and as a target for future therapies directed towards heart dysfunction in this disease.
METHODS
Mouse models
We have previously reported a mouse line with a Pkd1 null allele, characterized by transcriptional interruption in exon 2 (14, 17, 18). Heterozygotes (Pkd1+/−) display no renal cysts by 15 wk of age. The cystic mice were created based on the generation of a Pkd1 floxed allele (Pkd1cond) (17) and association with a Nestin-Cre transgene. Cre recombinase-mediated excision of exons 2–4 leads to formation of the inactive allele Pkd1del2–4 following a mosaic pattern.
The Pkd1 knockin T3041V allele prevents the autoproteolytic cleavage of polycystin-1 (PC1) at the GPS site (20). Pkd1V/V homozygotes present no gross phenotype by P8, but develop rapid and progressive distal nephron dilatation thereafter. This severe renal phenotype, translated into renal failure, is apparently responsible for the early mortality that occurs between the 2nd and 6th wk.
The Lgals3−/− mouse model (G−) was based on a null allele generated by exon 5 interruption (27). These animals are fertile, have ~11% fewer glomeruli and present a higher urinary chloride excretion (40). The double-mutant mice were generated by breeding these mice with each of the Pkd1-deficient models.
This study has been approved by the Research Ethics Committee and the Internal Biosafety Commission of Genetically Modified Organisms of the University of São Paulo School of Medicine. All experiments were conducted in male mice and in accordance with international standards of animal care and experimentation.
Echocardiographic analyses
Echocardiographic evaluations were performed using the Vevo 2100® (VisualSonics Inc, Toronto, Canada) device with a 40 mHz transducer in: (1) Pkd1+/−, Pkd1+/+ and Pkd1+/−;Lgals3−/− mice at 5–6 wk of age; (2) Pkd1+/−, Pkd1+/+ and Pkd1+/−;Lgals3−/− at 12–13 wk; (3) Pkd1cond/cond:Nestincre, Pkd1cond/cond and Pkd1cond/cond:Nestincre;Lgals3−/− mice at 5–6 wk; (4) Pkd1cond/cond:Nestincre, Pkd1cond/cond and Pkd1cond/cond:Nestincre;Lgals3−/− at 22–23 wk; and (5) Pkd1+/+, Pkd1V/V and Pkd1V/V;Lgals3−/− at P18. The mice were anesthetized with a mixture of oxygen and isoflurane and placed at dorsal decubitus. Heart rate and the electrocardiographic trace were monitored aiming to a ~400-bpm target in the first two groups, while in the last group heart rate was acquired from M-mode echocardiography. After thoracic trichotomy, echocardiography was conducted with M-mode, color Doppler and tissue Doppler imaging, followed by calculation of LVEF (%), LV fractional shortening (LVFS; %), LVM/BW (mg/g), left ventricular internal diameter in diastole to BW (LVIDD/BW) and MPI (48) in the first two groups, whereas only LVEF, LVM/BW and LVIDD/BW were obtained in the last group.
Strain measures of myocardial deformation based on speckle-tracking
Speckle-tracking echocardiography imaging is a recently developed technique that assesses myocardial deformation by tracking acoustic markers, or speckles, within the myocardium. Extensional strain of a soft tissue is defined as the change in length of a segment divided by its original length ([L1-L0]/L0), where strain rate (SR) is the rate of change of this deformation over time ([L1-L0]/L0]×s−1) (32). To determine myocardial deformation from frame to frame in B-mode images, however, the effects of tethering and the translational motion of the whole heart must be subtracted.
Using speckle-tracking based strain analysis of 2D gray scale echocardiographic images, acquired from the parasternal long- and short-axis, strain and SR were quantified in the longitudinal, radial, and circumferential axes in 5–6-wk and 12–13-wk Pkd1+/−, Pkd1+/+ and Pkd1+/−;Lgals3−/− mice and in 5–6-wk and 22–23-wk Pkd1cond/cond:Nestincre, Pkd1cond/cond and Pkd1cond/cond:Nestincre;Lgals3−/− animals. All images were acquired at a rate of 200 frames/s and a depth of 11 mm, and image acquisition was conducted using the speckle-tracking algorithm (VevoStrain, VisualSonics, Toronto, Canada).
B-mode loops were selected from digitally-acquired images based on visualization of the endocardial border and absence of image artifacts. Three consecutive cardiac cycles were selected for analysis. Semi-automated tracing of the endocardial and epicardial borders were performed over the cardiac cycles and corrected to achieve good tracking quality throughout each cine loop. Tracked images were then processed in a frame-by-frame. Strain measures were averaged over the cardiac cycles, yielding the curvilinear strain and SR data. Strain and SR results were global, resulting from data averaged across all six standardized segments and derived from peak values.
Renal ultrasonographic evaluation
Renal ultrasonographic analyses were carried out with the same equipment applied to echocardiography, at 12–13 wk in HTG+, HTG− and WT mice, at 22–23 wk in CYG+, CYG− and NC animals, and at P18 in WT, VVG+ and VVG− mice. The followed method was the same, except for ventral decubitus and dorsal trichotomy. Bidimensional images were acquired for each kidney and measurements related to the three axes obtained. Each kidney was submitted to a 200-image scan, acquired in axial cut within 3-s periods. Renal volume was attained by applying the modified ellipsoid volume approach (49) while, assuming a spherical cystic configuration and having cyst diameter measured, cyst’s individual volumes were obtained. The renal cystic index is the ratio between the sum of cyst volumes of both kidneys and the total volume of the organs.
Direct assessment of mean arterial pressure
The HTG+, HTG− and WT groups were submitted to direct MAP determination at 13 wk, to warrant an age associated with absence of renal cysts. CYG+, CYG− and NC mice, on the other hand, had the MAP measured at 24 wk, to guarantee a significant and long-term kidney cystic burden. To avoid potential interferences of other procedures on MAP, independent animal groups were assigned to this protocol. After submission to anesthesia with 1.5% isoflurane inhalation, a 4.0-cm-long catheter with 0.4-mm external diameter and 0.25-mm internal diameter (Micro-Renathane, Braintree Science Inc., Braintree, MA) was inserted into the right carotid artery (50). Prior to implantation, the catheter was filled with saline solution containing heparin 50 IU/mL and occluded with a metal pin. Once finished the procedure, it was exteriorized at the nape with a trocar and the incision was sutured. The catheter was then connected to a pressure transducer linked to a data acquisition system (BIOPAC Systems, Santa Barbara, CA) for measurement in mmHg. MAP was assessed 24 h after surgery, allowing animals to recover and return to baseline conditions.
Biochemical determinations
Blood samples were drawn by retro-orbital puncture from WT, HTG+ and HTG mice at 10–11 wk and from NC, CYG+ and CYG− animals at 20–21 wk. In VVG+, VVG− and the WT control mice, samples were obtained at P18 by decapitation with surgical scissors, following the international guidelines for animal euthanasia. Twelve h after blood collection the animals were housed for 12 h for urine collection, without food and water. SUN was determined using the Crocker’s colorimetric assay (Celm, Barueri, Brazil) while serum and urine creatinine were measured according to another colorimetric assay (Labtest, Lagoa Santa, Brazil).
Histological assessment preparation
Kidneys and hearts were harvested from HTG+, HTG− and WT at 13 wk of age, from CYG+, CYG− and NC animals at 23 wk, and from VV mice and controls at P18. The first two models were anesthetized with intraperitoneal thiopental (80 μg/g of BW) and subjected to complete exsanguination; the procedure was finalized with the organ collection. The third model followed the same protocol described, except for saline perfusion. Kidneys and hearts were fixed with 4% buffered paraformaldehyde, paraffin embedded, sectioned at 4 μm, and submitted to hematoxylin/eosin (H&E) and Sirius red staining.
Immunohistochemical evaluation of apoptosis, cell proliferation and galectin-3 expression
Apoptosis was quantified using the In Situ Cell Death Detection Kit (Roche, Mannheim, Germany). Spleen tissue served as positive control while negative control was achieved by incubation without TdT. Ten myocardial fields and 10 kidney fields (eight representing renal cortex and two renal medulla) were analyzed for each mouse. TUNEL-positive nuclei were quantified at x400 magnification and the results were expressed as number of positive cells/10,000 cells or percentage of cells (%).
Cell proliferation rates were determined by quantifying Ki-67-positive cells following immunohistochemistry with a monoclonal antibody (Ab) directed to this antigen (Abcam, Cambridge, UK). Spleen tissue served as positive control while negative control was achieved by incubation without Ab. This analysis included similar fields to the ones used in the apoptosis evaluation, with data represented as number of positive cells/10,000 cells or percentage of cells (%).
The galectin-3 expression profile was also evaluated by immunohistochemistry, employing a monoclonal Ab that recognizes the galectin-3 N-terminal portion (M3/38 hybridoma). Secondary Abs were conjugated with avidin-biotin-peroxidase complex (Dako, Carpinteria, CA). Peroxidase activity was examined using diaminobenzidine tetrahydroxychloride as substrate.
Tissue fibrosis analyses
Sections were submitted to 0.2% picrosirius staining (Sirius Red, Direct Red 80, Milwaukee, WI). Staining quantification was performed using an optical microscope (Olympus BX-51, Hatagaya, Japan) equipped with a light polarizer. Twelve myocardial fields and 12 kidney fields (10 representing renal cortex and two medulla) were randomly digitized at x400 magnification. The images were processed using the Image ProPlus 6.0 software (Media Cybernetics Inc., Rockville, MD), allowing collagen quantification by selecting the red, orange or green birefringent tonalities. The results were expressed as collagen content area/total area ratios.
Glomeruli number
The total glomeruli number was determined in the WT, HTG+ and HTG− groups. Left kidneys were submitted to the analyses using an unbiased stereological method known as the physical dissector/fractionator combination (51).
Western blot analyses
Heart tissue was homogenized in T-PER Tissue Protein Extraction Reagent (Thermo Scientific, Waltham, MA) with Protease Inhibitor Cocktail (Sigma-Aldrich, St Louis, MO) and Halt Phosphatase Inhibitor Cocktail (Thermo Scientific, Waltham, MA). For galectin-3 and TGF-β1 analyses, homogenates were centrifuged at 12,000 rpm for 10 min at 4°C and the supernatants collected for protein concentration determination. Total protein extracts (100 μg/lane) were resolved in 15% SDS-PAGE and transferred onto 0,22 μm nitrocellulose membranes. For PC1 analyses, heart tissue was homogenized in lysis buffer (25 mM sodium phosphate pH 7.2, 150 mM NaCl, 10% Glycerol, 1 mM EDTA, 1% Triton, Protease Inhibitor Cocktail and Halt Phosphatase Inhibitor Cocktail). Homogenates were rotated 1 h at 4°C followed by an initial centrifugation at 10,000 rpm for 10 min at 4°. The resulting supernatant was centrifuged at 100,000 x g for 120 min at 4°C to obtain the membrane fraction. The pellet was suspended in lysis buffer before determination of protein concentration. The membrane fraction extracts (70 μg/lane) were resolved in a 3–8% gradient gel (NuPAGE 3–8% Tris-Acetate Gel, Thermo Scientific) and blotted onto 0,45 μm PVDF membranes, according to the manufacturer instructions. After blotting, the membranes were probed with the anti-galectin-3 Ab previously described, anti-TGF-β1 Ab (BD Biosciences, San Jose, CA), anti-pSmad2 and anti-Smad2 (Cell Signaling Technology, Boston, MA), anti-PC1 (CC#5183, Baltimore PKD Core Center) and anti-GAPDH (Sigma-Aldrich), followed by horseradish peroxidase-conjugated secondary Abs. Bands were detected by the image acquisition chemiluminescence system (ALLIANCE 4.7, UVITEC, Cambridge, MA) and were quantified by densitometry analysis. The results were expressed as specific protein/GAPDH ratio.
Statistical analyses
The data were classified in parametric or nonparametric applying the test of Komolgorov–Smirnov. When three groups were compared, we used one-way analysis of variance with Tukey’s or LSD post-test for similar variances (Bartlet test), or Dunnet’s C post-test for different variances. When the data were nonparametric, we employed the Mann-Whitney test for two-group comparisons, or the Kruskal–Wallis test with Müller–Dunn, Conover-Inman or Dwass-Steel-Chritchlow-Fligner post-test for three-group comparisons. The survival analysis was performed using the Kaplan-Meyer Curve with the Log-rank test. We have accepted a risk ≤ 5% and β risk ≤ 20%. The tests were applied using SPSS 20.0 (IBM, Armonk, NY), Systat 13.0 (Systat Software, San Jose, CA) and GraphPad 5.0 (Prism Software, GraphPad Software, La Jolla, CA).
Supplementary Material
Acknowledgments
Sources of support:
Fundação de Amparo à Pesquisa do Estado de São Paulo (grant 2010/17424-0 to LFO)
Conselho Nacional de Desenvolvimento Científico e Tecnológico (grant 141881/2010-0 to BEB and LFO)
NIDDK-sponsored Baltimore Polycystic Kidney Disease Research and Clinical Core Center (grant P30DK090868).
We thank Flávio M. Ferreira, Milena C. Motta, Cynthia M. Santos, Jaqueline Nascimento, Selmo Silva, Robison Cruz, Lucy Ebsui, Carlos Lemos, Leandro Iannuzzi and Pedro Alcântara for significant animal care support. This work was supported by Fundação de Amparo à Pesquisa do Estado de São Paulo (grant 2010/17424-0 to LFO) and Conselho Nacional de Desenvolvimento Científico e Tecnológico (grant 141881/2010-0 to BEB and LFO), and Laboratórios de Investigação Médica da Universidade de São Paulo. These studies utilized resources provided by the NIDDK-sponsored Baltimore Polycystic Kidney Disease Research and Clinical Core Center (grant P30DK090868).
Footnotes
DISCLOSURE
None.
Publisher's Disclaimer: This is a PDF file of an unedited manuscript that has been accepted for publication. As a service to our customers we are providing this early version of the manuscript. The manuscript will undergo copyediting, typesetting, and review of the resulting proof before it is published in its final citable form. Please note that during the production process errors may be discovered which could affect the content, and all legal disclaimers that apply to the journal pertain.
References
- 1.Perrone RD, Ruthazer R, Terrin NC. Survival after end-stage renal disease in autosomal dominant polycystic kidney disease: Contribution of extrarenal complications to mortality. Am J Kidney Dis. 2001;38(4):777–84. doi: 10.1053/ajkd.2001.27720. [DOI] [PubMed] [Google Scholar]
- 2.Ecder T, Schrier RW. Cardiovascular abnormalities in autosomal dominant polycystic kidney disease. Nat Rev Nephrol. 2009;5(4):221–28. doi: 10.1038/nrneph.2009.13. [DOI] [PMC free article] [PubMed] [Google Scholar]
- 3.Rahbari-Oskoui F, Williams O, Chapman A. Mechanisms and management of hypertension in autosomal dominant polycystic kidney disease. Nephrol Dial Transplant. 2014;29(12):2194–201. doi: 10.1093/ndt/gft513. [DOI] [PubMed] [Google Scholar]
- 4.Chapman AB, Johnson AM, Rainguet S, et al. Left ventricular hypertrophy in autosomal dominant polycystic kidney disease. J Am Soc Nephrol. 1997;8(8):1292–7. doi: 10.1681/ASN.V881292. [DOI] [PubMed] [Google Scholar]
- 5.Bardají A, Vea AM, Gutierrez C, et al. Left ventricular mass and diastolic function in normotensive young adults with autosomal dominant polycystic kidney disease. Am J Kidney Dis. 1998;32(6):970–5. doi: 10.1016/s0272-6386(98)70071-x. [DOI] [PubMed] [Google Scholar]
- 6.Paavola J, Schliffke S, Rossetti S, et al. Polycystin-2 mutations lead to impaired calcium cycling in the heart and predispose to dilated cardiomyopathy. J Mol Cell Cardiol. 2013;58:199–208. doi: 10.1016/j.yjmcc.2013.01.015. [DOI] [PMC free article] [PubMed] [Google Scholar]
- 7.Geng L, Segal Y, Pavlova A, et al. Distribution and developmentally regulated expression of murine polycystin. Am J Physiol. 1997;272(4):F451–9. doi: 10.1152/ajprenal.1997.272.4.F451. [DOI] [PubMed] [Google Scholar]
- 8.Markowitz GS, Cai Y, Li L, et al. Polycystin-2 expression is developmentally regulated. Am J Physiol. 1999;277(1 Pt 2):F17–25. doi: 10.1152/ajprenal.1999.277.1.F17. [DOI] [PubMed] [Google Scholar]
- 9.Boulter C, Mulroy S, Webb S, et al. Cardiovascular, skeletal, and renal defects in mice with a targeted disruption of the Pkd1 gene. Proc Natl Acad Sci USA. 2001;98(21):12174–9. doi: 10.1073/pnas.211191098. [DOI] [PMC free article] [PubMed] [Google Scholar]
- 10.Wu G, Markowitz GS, Li L, et al. Cardiac defects and renal failure in mice with targeted mutations in Pkd2. Nat Genet. 2000;24(1):75–8. doi: 10.1038/71724. [DOI] [PubMed] [Google Scholar]
- 11.Muto S, Aiba A, Saito Y, et al. Pioglitazone improves the phenotype and molecular defects of a targeted Pkd1 mutant. Hum Mol Genet. 2002;11(15):1731–42. doi: 10.1093/hmg/11.15.1731. [DOI] [PubMed] [Google Scholar]
- 12.Kurbegovic A, Côté O, Couillard M, et al. Pkd1 transgenic mice: adult model of polycystic kidney disease with extrarenal and renal phenotypes. Hum Mol Genet. 2010;19(7):1174–89. doi: 10.1093/hmg/ddp588. [DOI] [PMC free article] [PubMed] [Google Scholar]
- 13.Stypmann J, Engelen MA, Orwat S, et al. Cardiovascular characterization of Pkd2 (+/LacZ) mice, an animal model for the autosomal dominant polycystic kidney disease type 2 (ADPKD2) Int J Cardiol. 2007;120(2):158–66. doi: 10.1016/j.ijcard.2006.09.013. [DOI] [PubMed] [Google Scholar]
- 14.Fonseca JM, Bastos AP, Amaral AG, et al. Renal cyst growth is the main determinant for hypertension and concentrating deficit in Pkd1-deficient mice. Kidney Int. 2014;85(5):1137–50. doi: 10.1038/ki.2013.501. [DOI] [PMC free article] [PubMed] [Google Scholar]
- 15.Pedrozo Z, Criollo A, Battiprolu PK, et al. Polycystin-1 is a cardiomyocyte mechanosensor that governs L-type Ca2+ channel protein stability. Circulation. 2015;131(24):2131–42. doi: 10.1161/CIRCULATIONAHA.114.013537. [DOI] [PMC free article] [PubMed] [Google Scholar]
- 16.Kuo IY, Kwaczala AT, Nguyen L, et al. Decreased polycystin-2 expression alters calcium-contraction coupling and changes β-adrenergic signaling pathways. Proc Natl Acad Sci USA. 2014;111(46):16604–9. doi: 10.1073/pnas.1415933111. [DOI] [PMC free article] [PubMed] [Google Scholar]
- 17.Piontek KB, Huso DL, Grinberg A, et al. A functional floxed allele of Pkd1 that can be conditionally inactivated in vivo. J Am Soc Nephrol. 2004;15(12):3035–43. doi: 10.1097/01.ASN.0000144204.01352.86. [DOI] [PubMed] [Google Scholar]
- 18.Bastos AP, Piontek K, Silva AM, et al. Pkd1 haploinsufficiency increases renal damage and induces microcysts formation following ischemia/reperfusion. J Am Soc Nephrol. 2009;20(11):2389–402. doi: 10.1681/ASN.2008040435. [DOI] [PMC free article] [PubMed] [Google Scholar]
- 19.Shillingford JM, Piontek KB, Germino GG, et al. Rapamycin ameliorates PKD resulting from conditional inactivation of Pkd1. J Am Soc Nephrol. 2010;21(3):489–97. doi: 10.1681/ASN.2009040421. [DOI] [PMC free article] [PubMed] [Google Scholar]
- 20.Yu S, Hackmann K, Gao J, et al. Essential role of cleavage of Polycycstin-1 at G protein-coupled receptor proteolytic site for kidney tubular structure. Proc Natl Acad Sci USA. 2007;104(47):18688–93. doi: 10.1073/pnas.0708217104. [DOI] [PMC free article] [PubMed] [Google Scholar]
- 21.Yu L, Ruifrok WP, Meissner M, et al. Genetic and pharmacological inhibition of galectin-3 prevents cardiac remodeling by interfering with myocardial fibrogenesis. Cir Heart Fail. 2013;6(1):107–17. doi: 10.1161/CIRCHEARTFAILURE.112.971168. [DOI] [PubMed] [Google Scholar]
- 22.Henderson NC, Mackinnon AC, Farnworth SL, et al. Galectin-3 regulates myofibroblast activation and hepatic fibrosis. Proc Natl Acad Sci USA. 2006;103(13):5060–5. doi: 10.1073/pnas.0511167103. [DOI] [PMC free article] [PubMed] [Google Scholar]
- 23.Henderson NC, Mackinnon AC, Farnworth SL, et al. Galectin-3 expression and secretion links macrophages to the promotion of renal fibrosis. Am J Pathol. 2008;172(2):288–98. doi: 10.2353/ajpath.2008.070726. [DOI] [PMC free article] [PubMed] [Google Scholar]
- 24.van Kimmenade RR, Januzzi JL, Jr, Ellinor PT, et al. Utility of amino-terminal pro-brain natriuretic peptide, galectin-3, and apelin for the evaluation of patients with acute heart failure. J Am Coll Cardiol. 2006;48(6):1217–22. doi: 10.1016/j.jacc.2006.03.061. [DOI] [PubMed] [Google Scholar]
- 25.O’Seaghdha CM, Hwang SJ, Ho JE, et al. Elevated galectin-3 precedes the development of CKD. J Am Soc Nephrol. 2013;24(9):1470–7. doi: 10.1681/ASN.2012090909. [DOI] [PMC free article] [PubMed] [Google Scholar]
- 26.Chiu MG, Johnson TM, Woolf AS, et al. Galectin-3 associates with the primary cilium and modulates cyst growth in congenital polycystic kidney disease. Am J Pathol. 2006;169(6):1925–38. doi: 10.2353/ajpath.2006.060245. [DOI] [PMC free article] [PubMed] [Google Scholar]
- 27.Hsu DK, Yang RY, Pan Z, et al. Targeted disruption of the galectin-3 gene results in attenuated peritoneal inflammatory responses. Am J Pathol. 2000;156(3):1073–83. doi: 10.1016/S0002-9440(10)64975-9. [DOI] [PMC free article] [PubMed] [Google Scholar]
- 28.Bauer M, Cheng S, Jain M, et al. Echocardiographic speckle-tracking based strain imaging for rapid cardiovascular phenotyping in mice. Cir Res. 2011;108(8):908–16. doi: 10.1161/CIRCRESAHA.110.239574. [DOI] [PMC free article] [PubMed] [Google Scholar]
- 29.Kramann R, Erpenbeck J, Schneider RK, et al. Speckle tracking echocardiography detects uremic cardiomyopathy early and predicts cardiovascular mortality in ESRD. J Am Soc Nephrol. 2014;25(10):2351–65. doi: 10.1681/ASN.2013070734. [DOI] [PMC free article] [PubMed] [Google Scholar]
- 30.Schroen B, Heymans S, Sharma U, et al. Thrombospondin-2 is essential for myocardial matrix integrity: increased expression identifies failure-prone cardiac hypertrophy. Cir Res. 2004;95(5):515–22. doi: 10.1161/01.RES.0000141019.20332.3e. [DOI] [PubMed] [Google Scholar]
- 31.Sharma UC, Pokharel S, van Brakel TJ, et al. Galectin-3 marks activated macrophages in failure-prone hyperthrophied hearts and contributes to cardiac dysfunction. Circulation. 2004;110(9):3121–28. doi: 10.1161/01.CIR.0000147181.65298.4D. [DOI] [PubMed] [Google Scholar]
- 32.Gallagher AR, Germino GG, Somlo S. Molecular advances in autosomal dominant polycstic kidney disease. Adv Chronic Kidney Dis. 2010;17(2):118–30. doi: 10.1053/j.ackd.2010.01.002. [DOI] [PMC free article] [PubMed] [Google Scholar]
- 33.Hassane S, Leonhard WN, van der Wal A, et al. Elevated TGF beta-Smad signaling in experimental Pkd1 models and human patients with polycystic kidney disease. J Pathol. 2010;222(1):21–31. doi: 10.1002/path.2734. [DOI] [PubMed] [Google Scholar]
- 34.Narula J, Haider N, Arbustini E, et al. Mechanisms of disease: apoptosis in heart failure – seeing hope in death. Nat Clin Pract Cardiovasc Med. 2006;3(12):681–88. doi: 10.1038/ncpcardio0710. [DOI] [PubMed] [Google Scholar]
- 35.Martos R, Baugh J, Ledwidge M, et al. Diastolic heart failure: evidence of increased myocardial collagen turnover linked to diastolic dysfunction. Circulation. 2007;115(7):888–95. doi: 10.1161/CIRCULATIONAHA.106.638569. [DOI] [PubMed] [Google Scholar]
- 36.Krzeslak A, Lipinska A. Galectin-3 as a multifunctional protein. Cell Mol Biol Lett. 2004;9(2):305–28. [PubMed] [Google Scholar]
- 37.Dumic J, Dabelic S, Flögel M. Galectin-3: an open-ended story. Biochim Biophys Acta. 2006;1760(4):616–35. doi: 10.1016/j.bbagen.2005.12.020. [DOI] [PubMed] [Google Scholar]
- 38.Yoder BK, Hou X, Guay-Woodford LM. The polycystic kidney disease proteins, polycystin-1, polycystin-2, Polaris, and cystin, are co-localized in renal cilia. J Am Soc Nephrol. 2002;13(10):2508–16. doi: 10.1097/01.asn.0000029587.47950.25. [DOI] [PubMed] [Google Scholar]
- 39.Clement CA, Kristensen SG, Møllgård K, et al. The primary cilium coordinates early cardiogenesis and hedgehog signaling in cardiomyocyte differentiation. J Cell Sci. 2009;122(Pt 17):3070–82. doi: 10.1242/jcs.049676. [DOI] [PMC free article] [PubMed] [Google Scholar]
- 40.Bichara M, Attmane-Elakeb A, Brown D, et al. Exploring the role of galectin 3 in kidney function: a genetic approach. Glycobiology. 2006;16(1):36–45. doi: 10.1093/glycob/cwj035. [DOI] [PubMed] [Google Scholar]
- 41.Kim H, Lee J, Hyun JW, et al. Expression and immunohistochemical localization of galectin-3 in various mouse tissues. Cell Biol Int. 2007;31(7):655–62. doi: 10.1016/j.cellbi.2006.11.036. [DOI] [PubMed] [Google Scholar]
- 42.Boletta A, Qian F, Onuchic LF, et al. Polycystin-1, the gene product of PKD1, induces resistance to apoptosis and spontaneous tubulogenesis in MDCK cells. Mol Cell. 2000;6(5):1267–73. doi: 10.1016/s1097-2765(00)00123-4. [DOI] [PubMed] [Google Scholar]
- 43.Iacobini C, Amadio L, Oddi G, et al. Role of galectin-3 in diabetic nephropathy. J Am Soc Nephrol. 2003;14(8 Suppl 3):S264–70. doi: 10.1097/01.asn.0000077402.95720.b4. [DOI] [PubMed] [Google Scholar]
- 44.Fernandes Bertocchi AP, Campanhole G, Wang PH, et al. A role for galectin-3 in renal tissue damage triggered by ischemia and reperfusion injury. Transpl Int. 2008;21(10):999–1007. doi: 10.1111/j.1432-2277.2008.00705.x. [DOI] [PubMed] [Google Scholar]
- 45.Outeda P, Huso DL, Fisher SA, et al. Polycystin signaling is required for directed endothelial cell migration and lymphatic development. Cell Rep. 2014;7(3):634–44. doi: 10.1016/j.celrep.2014.03.064. [DOI] [PMC free article] [PubMed] [Google Scholar]
- 46.Coxam B, Sabine A, Bower NI, et al. Pkd1 regulates lymphatic vascular morphogenesis during development. Cell Rep. 2014;7(3):623–33. doi: 10.1016/j.celrep.2014.03.063. [DOI] [PMC free article] [PubMed] [Google Scholar]
- 47.Outeda P, Mcavoy K, Qian F, et al. The role of polycystin 1 GPS cleavage in vascular development. Poster session presented at: Kidney Week, American Society of Nephrology; 2014 Nov 11–16; Philadelphia, PA. [Google Scholar]
- 48.Ramires FJ, Salemi VM, Ianni BM, et al. Aldosterone antagonism in an inflammatory state: evidence of myocardial protection. J Renin Angiotensin Aldosterone Syst. 2006;7(3):162–7. doi: 10.3317/jraas.2006.026. [DOI] [PubMed] [Google Scholar]
- 49.Nishiura JL, Neves RF, Eloi SR, et al. Evaluation of nephrolithiasis in autosomal dominant polycystic kidney disease patients. Clin J Am Soc Nephrol. 2009;4(4):838–44. doi: 10.2215/CJN.03100608. [DOI] [PMC free article] [PubMed] [Google Scholar]
- 50.Ceroni A, Moreira ED, Mostarda CT, et al. Ace gene dosage influences the development of renovascular hypertension. Clin Exp Pharmacol Physiol. 2010;37(4):490–5. doi: 10.1111/j.1440-1681.2009.05330.x. [DOI] [PubMed] [Google Scholar]
- 51.Bertran JF. Counting the kidney. Kidney Int. 2001;59(2):792–6. doi: 10.1046/j.1523-1755.2001.059002792.x. [DOI] [PubMed] [Google Scholar]
Associated Data
This section collects any data citations, data availability statements, or supplementary materials included in this article.