
Fig. 4.
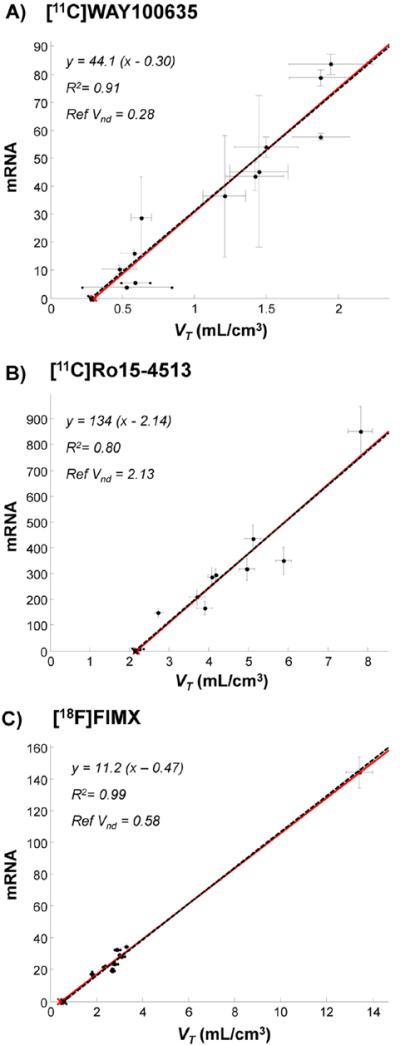
Genomic plot in PET measured data: successful cases. A) [11C]WAY100635 (15 subjects), B) [11C]Ro15-4513 (4 subjects) and C) [18F]FIMX (12 subjects). Data points (●) indicate regional population values. Both VT (x-axis) and mRNA (y-axis) standard errors are reported. Red lines refer to genomic plot regressions. Black dashed lines refer to the data regression with x-intercepts forced to the reference VND values, i.e. the VND values as derived from independent blocking studies. Please note that with [18F]FIMX the correlation is driven by a very high uptake region (i.e. cerebellum). When this is removed from the plot, the correlation is still significant (R2 = 0.65).