Abstract
Background
Shock is a spectrum of circulatory failure that, if not properly managed, would lead to high mortality. Special diagnostic and treatment strategies are essential to save lives. However, clinical and laboratory findings are always non-specific, resulting in clinical dilemmas.
Main content
Focused cardiac ultrasound (FoCUS) has emerged as one of the power tools for clinicians to answer simple clinical questions and guide subsequent management in hypotensive patients. This article will review the development and utility of FoCUS in different types of shock. The sonographic features and ultrasound enhanced management of hypotensive patients by a de novo “SIMPLE” approach will be described. Current evidence on FoCUS will also be reviewed.
Conclusion
Focused cardiac ultrasound provides timely and valuable information for the evaluation of shock. It helps to improve the diagnostic accuracy, narrow the possible differential diagnoses, and guide specific management. SIMPLE is an easy-to-remember mnemonic for non-cardiologists or novice clinical sonographers to apply FoCUS and interpret the specific sonographic findings when evaluating patients in shock.
Keywords: Shock, Ultrasound, Echocardiography, Emergency department, Critical care, Sepsis
Background
Shock is a clinical syndrome in which there is inadequate cellular and tissue oxygenation due to circulatory failure [1]. The presentation of shock can vary with different causes of shocks and degrees of physiological abnormalities. Shock can be classified into five different categories according to the underlying pathophysiology, namely hypovolemic shock (due to hemorrhage or intravascular volume depletion), cardiogenic shock (e.g., acute myocardial infarction, myocarditis), obstructive shock (e.g., pulmonary embolism, tension pneumothorax, and cardiac tamponade), and distributive shock (e.g., septic, neurogenic, and anaphylactic), and lastly, shock related to cellular poisoning [2]. One of the cardinal features of shock is hypotension. It can be defined as systolic blood pressure lower than 90 mmHg or more precisely mean arterial pressure lower than 65 mmHg as suggested by the latest international consensus definitions for sepsis and septic shock [3]. It is associated with high mortality and adverse hospital outcomes in non-traumatic patients in the emergency department [4, 5].
In order to save our patients in shock, early diagnosis, and timely targeted therapy is vital. To do so in a timely manner is a challenge as clinical presentation of different types of shock may be similar. Point-of-care ultrasound (PoCUS) performed by clinicians providing direct care to the patients is considered an invaluable clinical tool to facilitate diagnosis-making, to rule out potentially fatal conditions, and to provide guidance to life-saving procedures [6]. Among the different applications of PoCUS, focused cardiac ultrasound (FoCUS) is gaining popularity in emergency care settings. It is considered as one of the core emergency ultrasound applications by the American College of Emergency Physicians and the International Federation for Emergency Medicine [7, 8]. Recently, FoCUS has been integrated into scanning protocols together with focused scans in other regions, e.g., lung, abdomen, and lower limb deep vein system to manage patients in clinically undifferentiated hypotensive state [9–11]. In the following sessions, the SIMPLE approach, the role of FoCUS in the management of shock, and the current evidence for this application will be discussed.
Essentials of FoCUS and SIMPLE approach
The name “focused cardiac ultrasound” (FoCUS) is interchangeable with “focused echocardiography,” “emergency echocardiography,” “bedside limited echocardiography,” “point-of-care cardiac ultrasound,” and “goal-directed echocardiography” [12]. Lately, the term “focused cardiac ultrasound” has been recognized as a more appropriate term to take into account the nature of point-of-care application of ultrasound assessment of cardiac anatomy and physiology, distinct from the formal echocardiographic study done by cardiologists, according to the first international evidence-based recommendations issued by World Interactive Network Focused on Critical UltraSound (WINFOCUS) [13]. FoCUS was first introduced into emergency communities in the 1990s [14, 15]. With the wider availability and miniaturization of ultrasound machines, FoCUS has quickly become standard practice in acute care settings across the globe. In contrast to the conventional comprehensive echocardiography performed in the cardiac laboratory by cardiologists, FoCUS is performed by emergency physicians or intensivists at the bedside. It is essentially a limited evaluation of cardiac function, pericardial space, and intravascular volume in order to answer clinical questions vital to patient management. Contrary to what some may believe, the requirement for the FoCUS is not high. A portable or even pocket-sized handheld ultrasound machine can provide adequate image quality for assessment of left ventricular function, detection of pericardial effusion, and measurement of abdominal aorta size [16–18]. Pocket-sized machines are advantageous in unfavorable environments where full-sized machines will be impractical, e.g., pre-hospital assessment in an ambulance or helicopter [19].
FoCUS makes use of the same five orthodox views as in transthoracic echocardiographic study (TTE), (Fig. 1) to assess cardiac function, namely the left parasternal long and short axis views, apical four-chamber view, apical two-chamber view, and subxyphoid four-chamber view. Besides, subcostal visualization of the inferior vena cava (IVC) is frequently integrated into FoCUS to assess volume status and fluid responsiveness in hypotensive patients (Fig. 2) [9, 10]. 2D imaging and M-mode are employed for assessment in FoCUS. Doppler study is reserved for more sophisticated measurements in the cardiac laboratory, such as in assessing valvular dysfunction, calculating stroke volume, and mitral inflow velocity. These measurements would take longer time to achieve and may technically difficult during the initial phase of resuscitation when adequate visualization of the heart cannot be easily obtained. According to the international evidence-based recommendations for FoCUS, Doppler assessment of valvular dysfunction is considered beyond the scope of FoCUS and reserved for evaluation by standard comprehensive echocardiography [13]. Thus, this review will mainly focus on the application of 2D imaging and M-mode study to rapidly assess patients in shock.
Fig. 1.
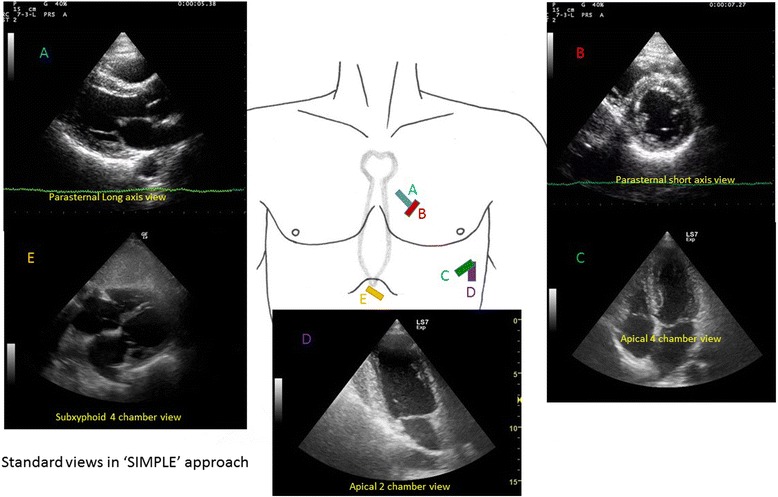
Five standard views used in focus echocardiography. They include parasternal long axis (a), parasternal short axis (b), apical four-chamber (c), apical two-chamber (d), and subxyphoid four-chamber views (e)
Fig. 2.
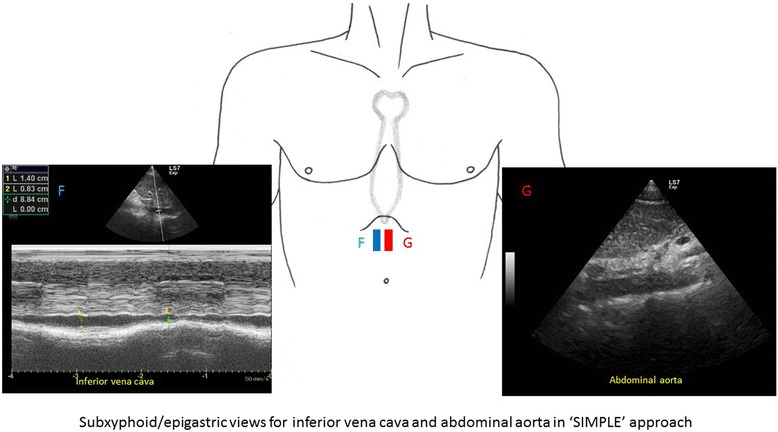
Subxyphoid/epigastric views for inferior vena cava (F) and abdominal aorta assessment (G)
In the assessment of hypotensive patients, several key sonographic findings should be evaluated. They include the chamber sizes, in particular the left ventricle (LV) and the right ventricle (RV), the interventricular septum (IVS), the IVC, the presence of intramural mass (commonly blood clots and myxoma), myocardial thickness and motion during systole, the presence of pericardial effusion or pleural effusion, LV systolic function and the abdominal aorta in the epigastrium. All of these can be summarized into a “SIMPLE” approach (Table 1). It will give emergency physicians and intensivists a useful checklist in the evaluation of hypotensive patients.
Table 1.
SIMPLE approach for evaluation of key elements during focused cardiac ultrasound sound (FoCUS) in shock patients
| SIMPLE approach in focused cardiac ultrasound | |
|---|---|
| S | Chamber size and shape, particularly LV and RV size |
| I |
IVC size and collapsibility IVS movement Intimal flaps inside the aorta, suggestive of aortic dissection |
| M |
Mass in the heart chambers (commonly intramural clots and atrial myxoma) Myocardium (motion and thickness) |
| P |
Pericardial effusion Pleural effusion |
| L | Left ventricular systolic function |
| E | Abdominal aorta in the epigastrium |
In addition to the five orthodox TTE views, the subcostal region or epigastrium is included in this SIMPLE scanning protocol to assess the size of IVC and abdominal aorta which may be involved in aortic dissection and aneurysmal rupture (Fig. 2). In this approach, a single ultrasound probe is used to look for the causes for hypotension and guide treatment by means of a focused point-of-care ultrasound study. Concerning the sequence of examination, it would be a good habit to start at the parasternal views then move to the apical view and, finally, the subxyphoid/epigastric regions to assess the IVC and the abdominal aorta. However, in some patients with emphysematous lungs, hyperinflation of the chest and morbid obesity, and on mechanical ventilation, only one to two views can be obtained for evaluation. Cardiac function assessment, although limited, may still be possible in these situations through the remaining one to two views. If FoCUS reveals features of hypovolemia (as will be discussed later), a focused assessment with sonography for trauma (FAST) protocol (i.e., SIMPLE + FAST approach) is warranted to look for intra-abdominal bleeding and hemothorax. Although limited when compared to comprehensive echocardiography carried out in the cardiac laboratory, this approach provides valuable information concerning the pathology, heart function, and physiology to differentiate between different types of shock and guide subsequent management.
Chamber sizes
The size of the heart chambers reflects the preload status (i.e., the intravascular volume) and heart function based on the volume-pressure relationship of a compliant heart chamber, in the absence of pre-existing or concurrent diseases such as cardiomyopathy or massive myocardial infarction. LV end-diastole diameter (LVEDD) and LV end-diastole area (LVEDA) (Fig. 3) can be used to assess the circulatory volume status [20]. A LVEDA of less than 10 cm2 or a LVEDA index (LVEDA/body surface area) of less than 5.5 cm2/m2 indicates significant hypovolemia [21]. Obliteration of the LV cavity would be seen in severe hypovolemia [22]. In contrast, fluid overload can cause dilatation of the left ventricle. An LVEDA of more than 20 cm2 suggests volume overload [21]. However, in the case of severe RV dysfunction, LV can also be small due to underloading. Concentric LV hypertrophy and constrictive pericarditis may also lead to small LVEDA so caution should be taken for interpretation in these conditions.
Fig. 3.
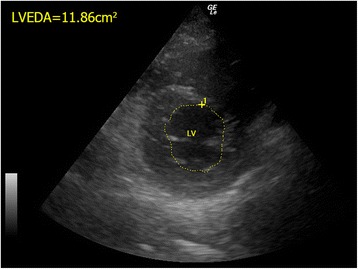
The normal LVEDA measurement. The LVEDA is measured at the level of mid-papillary level of left parasternal short axis view in a normal human being. (LVEDA left ventricular end diastolic area, LV left ventricle)
The size of the RV can give clues to the right heart function. Normally, it should be smaller than the LV and the apex should be formed by LV, not RV (Fig. 1). It is easily visualized in the apical four-chamber view as a triangular-shaped structure. The normal basal diameter of RV should be less than 4 cm [23]. If it is enlarged acutely in the appropriate clinical setting, the diagnosis of acute right heart failure due to massive pulmonary embolism should be suspected. The end-diastole area ratio of RV/LV should be less than 0.6 in the normal heart. A ratio higher than 0.66 would suggest cor pulmonale [24]. When this happens together with a normal RV wall thickness (<5 mm in parasternal long views), then it is very likely that there is acute right heart failure resulting from massive pulmonary embolism.
IVS movement
Normally, LV appears as a circular or donut-shaped structure (Fig. 1), and the IVS moves towards the center of LV during systole from the parasternal short axis view. When there is acute pulmonary embolism, high right ventricular pressure will cause more forceful and prolonged contracture of RV [24]. The IVS would then be pushed towards the left side, leading to flattening of the IVS or a D-shaped appearance of the LV on parasternal short axis view during end-systole or early-diastole (Fig. 4). In contrast, during systole, the LV contracts and the pressure in LV will become high again, pushing the IVS to the right side. This refers to “paradoxical movement” of the IVS.
Fig. 4.
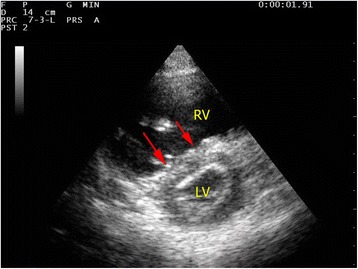
Acute cor pulmonale due to massive pulmonary embolism. A parasternal short axis view shows a dilated RV and D-shaped LV on parasternal view in a patient with massive pulmonary embolism. The flattened IVS is highlighted by red arrows. (RV right ventricle; LV left ventricle)
IVC size and collapsibility
Traditionally, the central venous pressure (CVP) has been used for fluid status assessment and monitoring. Nonetheless, it is not only invasive but also proven to correlate poorly with the blood volume status in a systematic review [25]. Recent studies suggest the use of echocardiography to assess fluid status and fluid responsiveness by measuring IVC size and its collapsibility [26–30]. The IVC can be seen at the subxyphoid area, slightly off midline to the right of the abdominal aorta on transverse view. IVC size should be measured in longitudinal view around 2 cm caudal to the point where the hepatic vein joins the IVC to the right atrium (RA) [31]. One should bear in mind that incorrect measurement will occur if the longitudinal view of IVC is off axis. M-mode tracing of the size of the IVC throughout the respiratory cycle can be obtained at this point (Fig. 5). In patients with spontaneous breathing effort, the IVC collapses on inspiration but distends on expiration due to change in intrathoracic pressure. The reverse occurs in patients on mechanical ventilation.
Fig. 5.
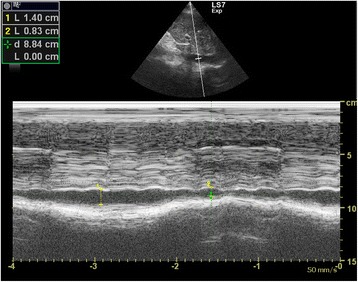
Normal M-mode tracing of the inferior vena cava throughout the respiratory cycle. Variation of the inferior vena cava diameter throughout the respiratory cycle is shown
IVC size can be used as a surrogate measurement of preload and volume status and therefore right atrial pressure (RAP). IVC diameter can be used to estimate RA pressure. The American Society of Echocardiography suggested the cutoff value of 2.1 cm [32]. IVC diameter <2.1 cm that collapses >50 % with inspiration would correlate with RA pressure of 3 mmHg (range, 0–5 mm Hg) while an IVC diameter >2.1 cm that collapses <50 % with inspiration suggests high RAP of 15 mm Hg (range, 10–20 mmHg). In patients with hypovolemic shock, the IVC diameter will be expected to be <2.1 cm and collapse >50 % with inspiration. In a recent meta-analysis of data from five studies on the sonographic measurement of the IVC in assessing the fluid status in the emergency department (ED), it was evidenced that the maximum IVC diameter is lower (6.3 mm 95 % CI 6–6.5 mm) in patients with hypovolemia than euvolemia [28]. Resuscitation of hypotensive patients usually involves fluid challenge. IVC diameter may give us some clues. The IVC distensibility index where maximum IVC diameter minus minimal IVC diameter divided by minimal IVC diameter times 100 % was found to be useful in predicting fluid responsiveness using the cutoff of 18 % in mechanically ventilated patients [29]. However, for patients with spontaneous breathing, the value of IVC size was less distinguished in predicting fluid responsiveness. With the cutoff of 40 %, the IVC collapsibility index that is maximum IVC diameter minus minimum IVC diameter divided by maximum IVC diameter times 100 % would only give a sensitivity of 70 %, specificity of 80 %, positive predictive value of 72 %, and negative predictive value of 83 % [30]. In trauma patients with hemorrhage, IVC measurement in addition to FAST is also helpful for managing trauma patients with hypovolemia to guide fluid therapy and shorten the time to operation theater [33, 34].
Intimal flap in aortic dissection
Aortic dissection is a potentially fatal but challenging vascular emergency. The cardinal feature of this disorder is a tear of the intimal layer of the aorta causing blood to dissect between layers of the aortic wall and propagate along the vessel. Hypotension was found to present in 16.4 % of patients with aortic dissection [35]. However, clinical features and chest X-ray findings are seldom confirmatory. With the availability of FoCUS, we can rule in aortic dissection and detect the associated complications, e.g., pericardial effusion, cardiac tamponade, pleural effusion, myocardial ischemia, and aortic regurgitation. The proximal part of the ascending aorta can be assessed by FoCUS from the parasternal long axis view. The abdominal aorta (as discussed later) should be assessed in suspected cases of aortic dissection. The pathognomonic sonographic feature of aortic dissection is the presence of intimal flap which appears as an echogenic thin linear structure separating the true and false lumens inside the aorta (Fig. 6). Dilatation of the aortic root (>4 cm), aortic regurgitation, and presence of pericardial effusion are auxiliary findings. The sensitivity and specificity of TTE for type A aortic dissection are 78–90 and 87–96 %, respectively [36, 37]. Positive findings can speed up management and confirm life-threatening complications. Since only the proximal part of the ascending aorta can be seen in TTE, aortic dissection cannot be ruled out completely and other modality of imaging should be considered in patients with high clinical suspicion.
Fig. 6.
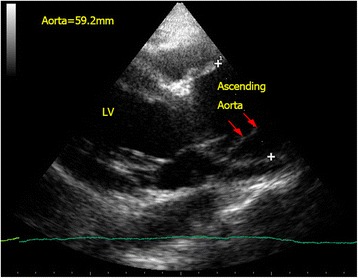
Aortic dissection. Intimal flap (red arrow) is seen in the dilated proximal ascending aorta (5.9 cm) in a confirmed case of type A aortic dissection. (LV left ventricle)
Mass in cardiac chambers: thrombus/myxoma
Intra-cardiac masses are not commonly seen on sonographic examination. But when present, in the appropriate clinical setting, they help establish the diagnosis of obstructive shock. The presence of intramural thrombus in right-sided cardiac chambers can confirm the clinical suspicion of pulmonary embolism and guide subsequent treatment [38]. Intracardiac thrombi appear as echogenic masses (Fig. 7) in the right atrium, right ventricle, pulmonary arteries, and IVC. The thrombi may be attached to the atrial or ventricular wall or be freely mobile [39]. LV thrombi resulting from causes such as atrial fibrillation, dilated left atrium (LA), and myocardial infarction may cause obstruction if large enough to occlude the left ventricular outflow tract (LVOT) and mitral valve. Another intracardiac mass that can cause obstructive shock is the atrial myxoma. It is the commonest primary cardiac tumor and most commonly involves the left atrium (75 %) [40]. It is often attached to the atrial wall and protrudes between the atrium and ventricle causing obstruction throughout the cardiac cycle, like a pinball machine. Occasionally, metastatic tumors may also cause obstructive shock in a similar manner as atrial myxoma [41].
Fig. 7.
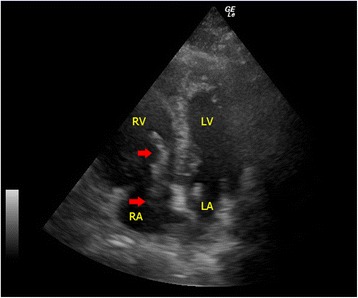
Pulmonary embolism. In this apical four-chamber view, echogenic blood clots (red arrows) in the right atrium protruding into the right ventricle through the tricuspid valve during diastole are seen in a patient with confirmed massive pulmonary embolism(RA right atrium, RV right ventricle, LA left atrium, LV left ventricle)
Myocardium
During systole, different parts of the LV thicken in a coordinated fashion to act as a pump to eject blood out of the heart. According to the European society of Cardiology and American Society of Echocardiography, the LV can be divided into 17 segments and each individual segment can then be graded as normal/hyperkinetic, hypokinetic (reduced thickening), akinetic (absent thickening), or dyskinetic (abnormal thinning and stretching especially in aneurysm) according to their motions during systole [23, 42]. This can give clue to myocardial ischemia/infarct and the culprit coronary vessel involved when the areas of abnormal regional wall motion correspond to the territory supplied by the culprit vessel. With compatible sonographic findings and clinical picture, primary percutaneous intervention will be warranted when myocardial ischemia/infarct is believed to be the cause for cardiogenic shock.
Abnormal thickening of the myocardium (LV posterior wall and interventricular septum thickness >1 cm at end-diastole; RV free wall >5 mm) is suggestive of chronic heart conditions resulting from pressure overload (e.g., hypertensive cardiomyopathy, hypertrophic cardiomyopathy, pulmonary hypertension, and aortic stenosis). Together with gross dilatation of ventricle and atrium, detection of myocardial thickening is considered by the latest international consensus to be an essential part of FoCUS [13]. It can help avoiding misdiagnosing pre-existing heart conditions (e.g., chronic cor pulmonale) as an acute one (e.g., acute massive pulmonary embolism) and avoiding inappropriate treatments (e.g., intravenous fibrinolytic).
Pericardial effusion vs pleural effusion
The pericardial sac is a potential space for fluid to collect due to both systemic illness (e.g., connective tissue disease and uremia) and local pathology (e.g., myocardial rupture, aortic dissection, and metastasis). Although difficult to detect by physical exam or chest X-ray, pericardial effusion is easily picked up by FoCUS. Usually, pericardial effusion appears as an anechoic rim surrounding the heart, best seen in the parasternal long axis view or subxyphoid four-chamber view. However, if the effusion is caused by inflammatory condition or hemorrhage (i.e., hemopericardium), there may be echogenicity within the pericardial sac. The pericardium appears as a densely echogenic film-like reflection posterior to the anechoic pericardial effusion (Fig. 8a, b). Sometimes pleural effusion can also be detected by echocardiography, and novice sonographers may find it confusing. Pericardial effusion can be differentiated from pleural effusion as pericardial effusion is located anterior to the descending aorta and does not extend beyond the atrioventricular groove (Fig. 9). Sometimes, pericardial or epicardial fat can also be mistaken as pericardial effusion. Epicardial fat usually appears as an echogenic structure lying within the pericardial sac just anterior to the heart on the parasternal long axis view [43]. The size of pericardial effusion should be quantified according to its maximum thickness measured during diastole (small <1 cm not circumferential, moderate <1 cm circumferential around the heart, large 1–2 cm circumferential, very large >2 cm with/without evidence of cardiac tamponade) [44]. Acute accumulation of pericardial effusion can lead to impaired right heart filling and, in turn, cardiac tamponade that will be discussed in the next session.
Fig. 8.
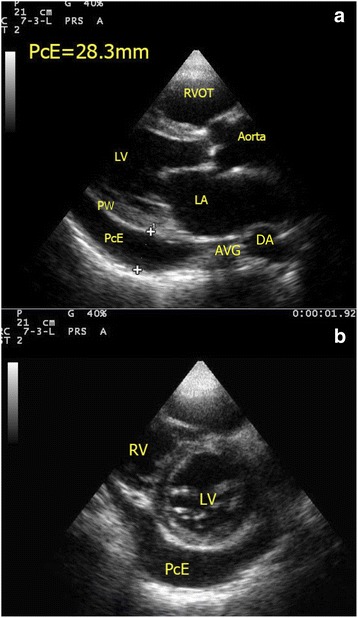
a, b Pericardial effusion (PcE). A large amount of pericardial effusion (PcE) is seen in both parasternal long axis and short axis view. The maximum size of the pericardial effusion measures 2.83 cm. Note the relationship between the pericardial effusion and the descending aorta (DA). (RV right ventricle, LV left ventricle, PW posterior wall of LV, PcE pericardial effusion, LA left atrium, RVOT right ventricular outflow tract, DA descending aorta, AVG atrioventricular groove)
Fig. 9.
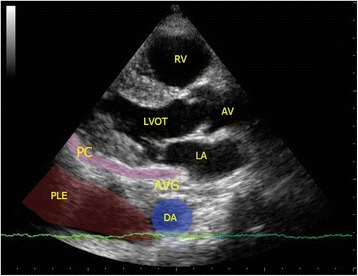
Pleural effusion (PLE). The parasternal long axis view shows anechoic pleural effusion (PLE) accumulated posterior to the descending aorta (DA). Pericardium (PC) is represented by the pink strip here. Also pleural effusion, if large amount, can extend beyond the atrioventricular groove in contrast with pericardial effusion which terminates at the atrioventricular groove. (AV aortic valve, LVOT left ventricular outflow tract, PC pericardium, PLE pleural effusion, RA right atrium, RV right ventricle, DA descending aorta, AVG atrioventricular groove)
LV systolic function
Echocardiography or cardiac ultrasound can give an accurate assessment of global function of the left ventricle and guide subsequent treatment (e.g., inotropic support versus fluid therapy). There are several options to assess the LV systolic function sonographically, including fractional shortening (FS) and LV ejection fraction (LVEF).
In M-mode, FS of the left ventricle can be assessed by placing a cursor just near the tip of the mitral valve leaflets in parasternal long axis view. The M-mode tracing will show the change in LV diameter during the cardiac cycle and FS can be calculated by the following formula:
The normal value should be 25–45 % for adults [42]. If the value falls below <15 %, severe LV systolic dysfunction is present. This measurement is very simple and easy. However, the measurement must be done perpendicular to the axis of the left ventricle, and the ventricle should not be foreshortened. There is also an assumption of no severe dysfunction in other parts of the left ventricle.
In B-mode, the LVEF can be measured by the modified Simpson biplane method. Most modern ultrasound machines have the calculation package pre-installed. The endocardial margins of the LV are traced in systole and diastole from two different views (i.e., two individual planes perpendicular to each other) to calculate the volume change between systole and diastole. The normal LVEF should be >55 %, and <30 % indicates severe left ventricular systolic dysfunction [42]. This is not a simple method compared with the FS, and the endocardial margins have to be traced correctly or under/overestimation of the LVEF may result. In emergency settings, suboptimal images of the LV and inadequate cardiac views would render this method less practical.
Assessment of LVEF by eyeballing appears the most feasible yet reliable method for estimating the LV systolic function. It can be done through assessing the movement and thickening of the LV myocardium, the change in size and shape of the LV chamber as well as the mitral valve anterior leaflet excursion in the cardiac cycle. It was found that the accuracy of eyeballing estimation correlated well with other quantitative methods including Simpson biplane ejection fraction, fractional shortening, wall motion score index, and aortic valve (AV) plane displacement [45, 46]. This advantage is not confined only to the experienced cardiologists. With focused training, the estimation of LV ejection fraction by emergency physicians had a strong agreement with cardiologists [47–49]. Even inexperienced emergency medicine trainees could achieve good agreement on the visual estimation of LV ejection fraction with cardiologists after web-based learning and proctored practical training (K = 0.79, 95 % CI 0.773 to 0.842) [49]. Thus, visual estimation of the LV ejection fraction should form an important part of left heart systolic function assessment in FoCUS, in particular when quantitative measurements are not possible due to poor echogenicity of the heart and limited cardiac views in some patients.
Abdominal aortic at the epigastrium
The proximal part of abdominal aorta can be easily visualized by ultrasound. It should be integrated into the scanning protocol of FoCUS in addition to the IVC measurement. It lies along the mid-line of the abdomen, on the left side of the IVC, and anterior to the bony vertebra. The normal size of the abdominal aorta should be less than 3 cm. Abdominal aortic aneurysm (AAA) is diagnosed when the diameter is >3 cm. AAA can rupture and cause profound hypotension due to hypovolemia. Clinical presentation may be subtle, and reliance on physical findings alone may miss this potentially fatal condition as the sensitivity of abdominal palpation is only 68 % [42, 50]. PoCUS has outstanding sensitivity and specificity for AAA approaching 100 % and has been proved to shorten the time to emergency operation [51, 52]. Other arterial catastrophes including rupture of splenic artery aneurysm can also be detected in a similar way to AAA [53]. Echogenic intimal flap seen inside the aortic lumen can confirm the diagnosis of aortic dissection (Fig. 10a, b). This may improve the sensitivity of FoCUS in diagnosing aortic dissection, especially in cases involving the descending aorta.
Fig. 10.
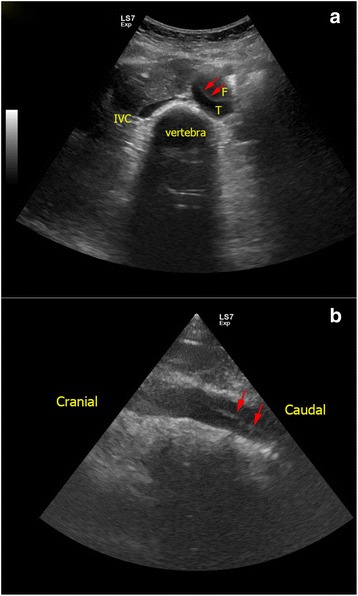
a, b Aortic dissection of abdominal aorta. In this patient with extensive Stanford type A aortic dissection, intimal flap (red arrows) is seen inside the lumen of abdominal aorta as an echogenic film separating the false lumen (F) and true lumen (T). (F false lumen, T true lumen, IVC inferior vena cava)
Evaluation of undifferentiated shock by SIMPLE approach
Hypovolemic shock
In patients with hypovolemia, the left ventricle becomes small with a smaller LVEDA (<10 cm2). The lumen of the LV may even be obliterated and the ventricular walls are seen to be “kissing” (Fig. 11a, b) [22]. The IVC collapses, and the size becomes less than 2 cm with >50 % collapsibility (Fig. 12). Hyperdynamic LV with normal or higher than normal ejection fraction and normal myocardial thickening is found. Depending on the source of bleeding, hemothorax may be an incidental finding in FoCUS but it should not be misinterpreted as pericardial effusion. The epigastric area should be screened for the presence of an aortic aneurysm. If an aortic aneurysm is found in a hypotensive patient, aneurysmal rupture should be suspected and urgent surgical consultation is warranted. FAST scan should also be done when no obvious sources of bleeding can be identified in the context of hypovolemic shock. Fluid responsiveness can be predicted by using the IVC collapsibility index in ventilated patients to guide subsequent fluid therapy.
Fig. 11.
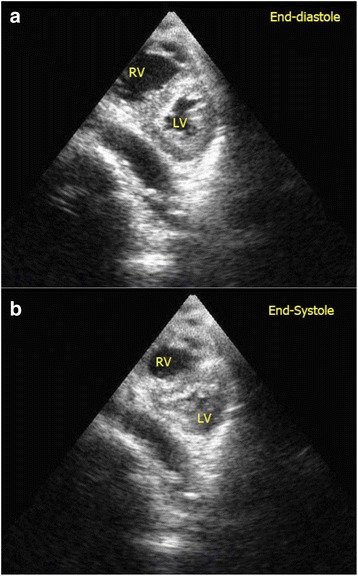
a, b Severe hypovolemic shock. Kissing walls of left ventricle on parasternal short axis view is shown. The left ventricle is obliterated during systole. This patient suffered from severe hypovolemia due to gastrointestinal bleeding. (RV right ventricle, LV left ventricle)
Fig. 12.
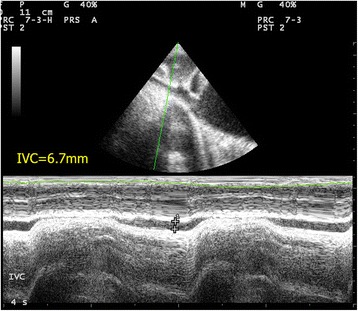
Collapsed IVC. IVC thickness is markedly reduced (thickness = 6.7 mm) with complete collapse on inspiration in a patient with hypovolemic shock
Cardiogenic shock
Echocardiography or cardiac ultrasound definitely has a role in managing cardiogenic shock due to LV dysfunction and valvular dysfunction. LV would be dilated, and fractional shortening would be impaired (Fig. 13). Dilated IVC >2.1 cm with the absence of respiratory variability is expected. Regional wall motion abnormality may be seen if the underlying cause for cardiogenic shock is myocardial ischemia. The whole myocardium would be hypokinetic in the case of global systolic dysfunction (e.g., due to myocarditis). As mentioned before, LV systolic function can be assessed by quantitative measurements including FS and LVEF by using the modified Simpson biplane method. However, all these measurements require good visualization of the LV and clear delineation of the endocardium. Errors commonly occur when the optimal image of the LV cannot be obtained in emergency settings. Thus, visual estimation, so called eyeballing, would be more practical in these situations. By obtaining valuable information on pump function, inotropic support and judicious fluid administration is indicated. Emergency transferal of the patients to cardiac catheterization facility for revascularization can also be facilitated in myocardial infarction.
Fig. 13.
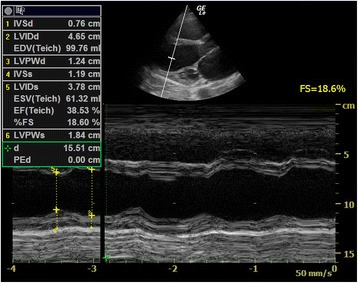
Poor LV systolic function. This parasternal long axis view shows a dilated LV with poor fractional shortening (FS = 18.6 %) in a patient with dilated cardiomyopathy and hypotension (FS = fractional shortening)
Obstructive shock
Cardiac tamponade
One of the major causes for obstructive shock is cardiac tamponade. The presence of pericardial effusion and hypotension raises the suspicion of cardiac tamponade. Large amounts of effusion would cause cardiac tamponade, but even small effusions, if accumulated rapidly, can cause cardiac tamponade due to the tough, non-distensible nature of the pericardial sac. Although cardiac tamponade is essentially a clinical diagnosis, FoCUS can help to confirm the presence of pericardial effusion, provide useful real-time hemodynamic information and tamponade physiology, and guide therapeutic pericardiocentesis. Sonographic features of cardiac tamponade include RA collapse, RV diastolic collapse, distended IVC, and respiratory variation of the mitral inflow velocity. The latter is essentially the sonographic version of pulsus paradoxicus. Pulsed wave Doppler is required to detect the variation so it is out of the scope of this SIMPLE approach (Table 2). RA collapse can be easily recognized when the RA inverts during ventricular end-diastole when the pressure inside the atrium becomes lowest (Fig. 14a). RV diastolic collapse is recognized as part of the RV free wall not expanding during early diastole (Fig. 14b). RA collapse is a more sensitive but non-specific sonographic sign of cardiac tamponade while diastolic RV collapse is considered to be more specific. Plethoric IVC without any variation during respiration is an additional sign to look for in cardiac tamponade. When the diagnosis of cardiac tamponade is established, FoCUS-guided pericardiocentesis can then be performed. Ultrasound-guided pericardiocentesis is now considered to be the standard of care because it carries higher successful rate and fewer complications than the blind approach [54, 55]. The apex was identified as the optimal location for pericardiocentesis in 1127 consecutive patients from the Mayo Clinic over 21 years [56].
Table 2.
Summary of typical findings in different types/causes of shock by SIMPLE approach
| Type of shock | Hypovolemic | Cardiogenic | Septic | Distributive | Pulmonary embolism | Cardiac Tamponade | Aortic Dissection | |
|---|---|---|---|---|---|---|---|---|
| S | Chamber size | Small LV | Dilated LV | Early: small LVESA Late: normal/dilated |
Near normal LVEDA but small LVESA | Dilated RV, small/normal LV | Diastolic collapse of RA and RV; normal LV | Usually normal |
| I | IVC thickness | Collapsed | Distended <50 % respiratory collapse | Early: collapsed Late: distended |
Collapsed | Distended and loss of respiratory collapse | Distended and loss of respiratory collapse | Normal when no cardiac tamponade |
| IVS movement | Normal | Reduced | Early: normal Late: reduced |
Normal | Paradoxical IVS and D-shaped LV | Normal | Normal | |
| Intimal flap | Absent | Absent | Absent | Absent | Absent | Absent | Present | |
| M | Myocardial thickening/motion | Hyperdynamic | Hypokinetic | Early: hyperdynamic Late: hypokinetic |
Hyperdynamic or normal | McConell’s sign, LV hyperdynamic | Diastolic collapse of RA and RV | Normal if coronary ostia not involved |
| Masses in heart | Absent | Intramural thrombi if AF/AMI | Absent | Absent | Thrombi in RA/RV and IVC | Absent | Absent | |
| P | Pericardial effusion | Absent | Small amount if inflammatory cause | Absent | Absent | Absent | Moderate to large but can be small if acutely collected | Present if retrograde dissection and echogenic |
| Pleural effusion | Absent | Present | Present if pneumonia | Absent | Usually absent | Absent | Present if hemothorax | |
| L | LV systolic function | Hyperdynamic | Poor | Early: normal or hyperdynamic Late: impaired |
Normal or hyperdynamic | Normal or hyperdynamic | Normal | Normal |
| E | Abdominal aorta in epigastrium | Aneurysmal if due to AAA rupture | Normal | Normal | Normal | Normal | Normal | Intimal flap seen |
AF atrial fibrillation, AMI acute myocardial infarct, LV left ventricle, LVEDA left ventricular end-diastolic area, LVESA left ventricular end-systolic area, RA right atrium, RV right ventricle
Fig. 14.
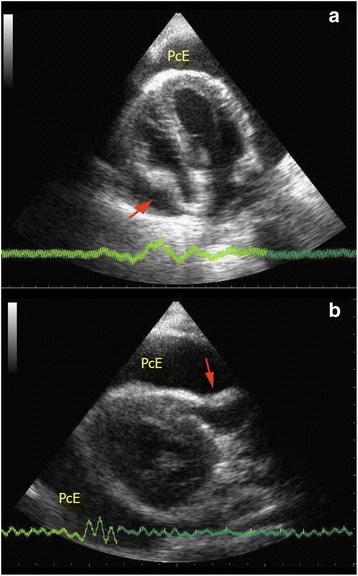
a, b Cardiac tamponade. These two images show collapsed RA and RV (red arrows) on apical four-chamber view and parasternal long axis view in a patient with cardiac tamponade (PcE = pericardial effusion)
Massive pulmonary embolism
Massive pulmonary embolism causes acute RV dysfunction. RV is usually dilated with basal diameter >4 cm and RV/LV ratio >0.6. The normal triangular-shaped RV is distorted, and the apex is no longer dominated by the LV on the apical four-chamber view. The IVS shows paradoxical movement, and D-shaped LV chamber would be appreciated in the parasternal short axis view (Fig. 4). The IVC is distended with minimal or absent respiratory variation (Fig. 15). Free flowing echogenic thrombus may occasionally be seen in the right heart and IVC (Fig. 7). McConnell’s sign which is defined as mid-RV free wall akinesia with sparing of the apex may occasionally be seen [57]. It is thought to be a specific but not very sensitive sign for acute pulmonary embolism (sensitivity 77 %; specificity 96 %). This specific sign is believed to be caused by tethering of the RV to the hyperdynamic LV apex [57, 58]. LV becomes hyperdynamic as the left heart is trying hard to compensate for the hypotension. The American College of Chest Physicians suggests that fibrinolysis should be warranted in patients with hypotension due to massive pulmonary embolism [59]. When severe right heart dysfunction is confirmed by FoCUS with hypoxia, hypotension, and tachycardia, the diagnosis of massive pulmonary embolism should rank top on the list of differentials. Intravenous fibrinolytic therapy should be prudently considered if there is no contraindication to reverse acute right heart dysfunction due to pulmonary embolism and surgical embolectomy may be needed in patients with contraindication to systemic fibrinolysis.
Fig. 15.
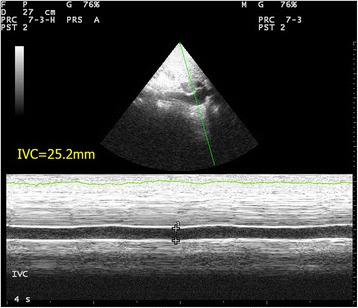
Distended IVC. This is the M-mode tracing of IVC in a patient with massive PE. The IVC is plethoric of a diameter >2.1 cm with only minimal respiratory variation (IVC = inferior vena cava)
Aortic dissection
Aortic dissection can be picked up by FoCUS when the intimal flap is in the aorta (Fig. 6). The complications of aortic dissection can also be detected. Retrograde dissection into the pericardial sac can cause pericardial effusion and even cardiac tamponade. Echogenic pericardial effusion and even clots are occasionally seen (Fig. 16). The IVC becomes plethoric when cardiac tamponade is present. Regional wall motion abnormality may also be detected in the case of acute myocardial ischemia secondary to ostial occlusion by the intimal flap, usually involving the right coronary artery [60]. It is often rewarding to scan the abdominal aorta in patients suspicious of distal aortic dissection as sometimes the intimal flap which cannot be seen in the ascending aorta may be seen here and the diagnosis is obvious (Fig. 10a, b).
Fig. 16.
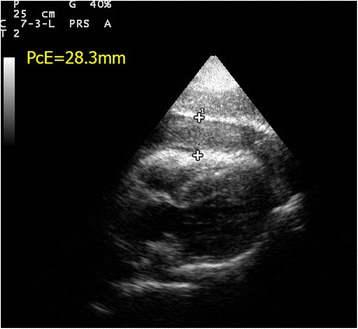
Hemopericardium and cardiac tamponade. This subxyphoid four-chamber view shows echogenic clots and hemopericardium in a patient with cardiac tamponade due to aortic dissection (PcE pericardial effusion; thickness = 28.3 mm)
Septic shock
Septic shock represents a distinctive spectrum of hemodynamic instability. In the early stage, the afterload is reduced and left ventricular dysfunction, although present, is masked by the severely reduced afterload due to sepsis [61, 62]. Thus, FoCUS will find a normal LVEDA but small left ventricular end-systolic area (LVESA) and a hyperdynamic LV. There is a substantial decrease in the size of the LV from diastole to systole in contrast to hypovolemia where the LV size is small throughout the cardiac cycle. The IVC would collapse in this stage with >50 % inspiratory collapse. After the initial phase, myocardial depression occurs in around 60 % septic patients [63]. Once the afterload is restored by vasopressors and fluid therapy, the LV myocardial dysfunction is unmasked. LV would be normal or dilated with myocardial hypocontractility [61–63]. At this stage, the IVC is distended and the respiratory collapsibility is lost similar to the profile in cardiogenic shock. Recognizing these sonographic findings can help clinicians tailoring appropriate treatments to different stages of septic shock.
SIMPLE approach versus other protocols
Since 2001, different protocols for shock assessment have been described in the literature. Table 3 summarizes and compares the current major protocols for undifferentiated shock and cardiac arrest. There is a growing trend towards integrating different aspects of point-of-care ultrasound including focused cardiac ultrasound, IVC and aorta assessment, and lung scan into different protocols [9, 70, 75–77]. The goal is to find a systematic and practical way to classify the challenging but non-specific clinical syndrome of circulatory failure into four more specific and manageable types of shock.
Table 3.
Summary of current major protocols of point-of-care ultrasound for undifferentiated shock/cardiac arrest
| Protocols | Year of publication | Cardiac views | IVC size | Abdominal aorta | Lung scan | Remarks |
|---|---|---|---|---|---|---|
| UHP [11] | 2001 | SXP+/−PLX, PSX | No | Yes | No | Simplified version of extended FAST |
| Trinity [64] | 2002 | PLX, PSX | No | Yes | Pleural effusion only | Similar to extended FAST |
| FATE [65] | 2004 | PLX, PSX, AP4, SXP | No | No | Pleural effusion only | Chronic pathologies included |
| BLEEP [66] | 2004 | SXP, PSX | Yes | No | No | Pediatric patients only |
| CAUSE [67] | 2007 | 4 views | Yes | Yes | Yes | Cardiac arrest |
| FEER [68] | 2007 | SXP, PLX, PSX, AP4 | No | No | No | Integrated into ACLS protocol for cardiac arrest |
| BEAT [69] | 2008 | PLX, PSX, AP4, SXP | Yes | No | No | Surgical patients; SV and CI included |
| ACES [10] | 2008 | SXP, PLX, AP4 | Yes | Yes | Pleural effusion only | |
| RUSH-HIMAP [70] | 2009 | PLX, AP4 | Yes | Yes | Yes | |
| RUSH-pump, pipe, tank [9] | 2010 | PLX, PSX, SXP, AP4 | Yes | Yes | Yes | Physiological model of pump, pipe, tank |
| FEEL [71] | 2010 | SXP, PLX. AP4 (any one of them) | No | No | Pleural effusion only | Cardiac arrest and peri-arrest state |
| EGLS [72] | 2011 | PLX, PSX, AP4, SXP | Yes | No | Yes | Lung scan first approach |
| FREE [73] | 2011 | PLX, PSX, AP4, SXP | Yes | No | No | Trauma patients |
| FALLS [74] | 2012 | Not specifically mentioned | No | No | Yes | Mainly lung scan |
| FAST and RELIABLE [75] | 2012 | PLX, PSX, AP4, SXP | Yes | Yes | Yes | Ectopic pregnancy included |
| Volpicelli et al. [76] | 2013 | PLS, SXP, AP4 | Yes | Yes | Yes | Similar to RUSH [9] |
| Shokoohi et al. [77] | 2015 | SXP, PLX, PSX, AP4 | Yes | Yes | Yes | FAST included |
| SIMPLE | 2016 | PLX, PSX, AP4, AP2, SXP | Yes | Yes | No | Easy-to-remember checklist of sonographic findings; intracardiac mass and intimal flap included; can be combined with FAST |
PSX parasternal short axis view, PLX parasternal long axis view, SXP subxyphoid view, AP4 apical four-chamber view, AP2 apical two-chamber view, IVC inferior vena cava, ACLS advanced cardiac life support, ICU intensive care unit, FAST focused assessment with sonography for trauma, SV stroke volume, CI cardiac index
In contrast to existing protocols like rapid ultrasound for shock and hypotension (RUSH) [9], abdominal and cardiac evaluation with sonography in shock (ACES) [10], undifferentiated hypotension patient (UHP) [11], Trinity [64], or focused assessed transthoracic echocardiography (FATE) [65], every single letter in the SIMPLE approach represents a specific assessment in cardiac ultrasound. This simple mnemonic provides clinicians with a simple and easy-to-remember, yet valuable checklist of sonographic findings to look for when managing patients in shock. Unlike the RUSH protocol, physiology is not emphasized in the SIMPLE approach but systematic interpretation of sonographic findings can help the clinicians narrow down the differential diagnosis of shock and guide initial therapy (e.g., small and kissing LV with flat IVC already warrants fluid resuscitation and hypovolemia is suspected, while dilated and hypokinetic LV would suggest cardiogenic shock and inotropic support is needed). It can also help avoiding complications associated with indiscriminate use of fluid therapy and inotropes.
To my knowledge, this is the first protocol to include two specific findings explicitly: intramural mass and intimate flap so as to improve the diagnostic power of two challenging and lethal conditions, namely massive pulmonary embolism and aortic dissection. Although abdominal assessment is not routinely included in the SIMPLE approach, combination with FAST to look for the source of intra-abdominal bleeding is indicated when FoCUS reveals features of hypovolemia. As most emergency physicians and intensivists have been using FAST scan routinely in trauma assessment, a combination of SIMPLE with FAST (SIMPLE + FAST) would easily be incorporated into their daily practices. SIMPLE + FAST suggests cardiac assessment first before abdominal assessment in order to detect obstructive and cardiogenic shock, in contrast to the FAST + RELIABLE protocol suggested by Liteplo et al. [75]. This allows early specific treatment such as pericardiocentesis and inotropes to correct the circulatory failure and prevent indiscriminative fluid challenge which is detrimental in cardiogenic shock.
Current evidence of FoCUS for evaluation of shock
Among the literature, there is growing evidence demonstrating that FoCUS could improve the diagnostic accuracy and change the clinical management. Although the results of this evidence may not necessarily prove that FoCUS can lead to better patient survival and shorten the hospital stay, it can logically be assumed that with more accurate diagnostic capability for various types of shock, implementation of FoCUS could lead to a better clinical outcome in patients with circulatory failure.
FoCUS is helpful in confirming the correct diagnoses and detecting the etiology of shock. In a randomized trial in 184 patients by Jones et al. in the emergency department, early goal-directed ultrasound at 0 min was found to correctly diagnose the etiology of shock in 80 % of patients compared 50 % of patients in the group only received standard care at the initial 15 min of presentation in the emergency department [78]. This trial can be concluded into two important points. Firstly, it was the first study to prove that early focused ultrasound can allow the emergency physicians to narrow the differential diagnoses of shock. Secondly, it proved that early focused ultrasound at the initial presentation is feasible and can be combined with standard care interventions, e.g., venous access establishment, electrocardiography, blood sample analysis, and chest radiography.
Subsequent trials on protocol-driven ultrasound for diagnosis of shock further confirmed the role of FoCUS to diagnose and differentiate different types of shock in the emergency department. Volpicelli et al. did a prospective study on 108 ED patients in undifferentiated shock by comparing the sonographic diagnosis with the final clinical diagnosis [76]. The ultrasound assessment in this study included FoCUS and IVC assessment, lung scan, abdominal scan for free fluid, and leg scan for deep vein thrombosis. They found a very good concordance between the ultrasound diagnosis and the final clinical diagnosis (k = 0.710). Ghane et al. also found similar finding in a study in 52 ED patients by using RUSH protocol (k = 0.7) [79]. It was also found that ultrasound achieved 100 % sensitivity for hypovolemic and obstructive shock, 91.7 % sensitivity for cardiogenic shock, and 94.6–100 % specificity for all types of shock. However, in distributive and mixed type of shock, the sensitivity was found to be lower only 70–75 %. The same group also found similar results in another study on 77 patients [80]. The common limitation of the above three studies is that ultrasound assessments were done by either radiologist or emergency physicians experienced in PoCUS, and so the results may not be generalizable to other inexperienced clinicians from other specialties.
Apart from correct diagnosis and differentiation of shock, the other major role of FocUS for shock is to tailor the treatment according to the underlying etiology and improve the clinical outcome of patients. In an observational study conducted on 220 patients in intensive care unit, use of FoCUS by hand-held ultrasound device was found to be associated with significantly lower fluid prescription (49 vs 66 mL/kg, p = 0.01) and more dobutamine use (22 vs 12 %, p = 0.01) than the historical control group which was managed in a standard fashion [81]. More importantly, this study found that FoCUS group had better 28-day survival (66 vs 56 %, p = 0.04) and a reduction in acute kidney injury (20 vs 39 %). These findings are supportive of using FoCUS to guide the resuscitation of hypotensive patients. The limitations of this study include no randomization, use of historical control, and a significant number of patients (14 %) with significant valvular pathologies. Another recent study performed in ED also confirmed the impact of FoCUS findings on management plan (in 24.6 % of patients), including the use of intravenous fluid, vasoactive agents, or blood products. This study also found an excellent concordance of protocol-driven ultrasound diagnostic protocol in undifferentiated hypotension with the final diagnosis (k = 0.80). Moreover, ultrasound was also found to influence the diagnostic imaging, consultation, and patient disposition in this study. Again, the limitations are the lack of randomization and use of single ultrasound operator.
Conclusions
Managing patients in profound shock poses a very great challenge to clinicians. Correct diagnosis and timely specific treatment to restore the otherwise jeopardized circulation are vital to the survival of hypotensive patients. Throughout the past 10 years, FoCUS has emerged as one of the important allies of emergency physicians and intensivists to provide crucial answers to challenging clinical conditions. In properly trained hands, FoCUS can provide real-time valuable information on the pathology and physiology of circulation to differentiate between different types of shocks. Through the suggested SIMPLE approach, different types of shocks can be characterized according to 2D ultrasound findings and simple measurements (Table 2). This approach is not only simple and practical but also provides an easy-to-remember checklist of ultrasound findings for clinicians to focus on when managing patients with undifferentiated shock. Integrating SIMPLE approach with FAST scan (i.e., SIMPLE + FAST) can be feasible and particularly helpful in identifying intraperitoneal bleeding and initiating fluid resuscitation in hypovolemic shock. Current evidence supports the role of FoCUS in undifferentiated shock to improve the diagnostic accuracy, narrow the possible differential diagnoses, and guide specific management. More high-quality clinical trials are warranted to further look into the impact of FoCUS on the clinical outcomes, patient survival, and financial implication in future.
Abbreviations
AAA, abdominal aortic aneurysm; ACES, abdominal and cardiac evaluation with sonography in shock [10]; ACLS, advanced cardiac life support; AF, atrial fibrillation; AMI, acute myocardial infarction; AP2, apical two-chamber view; AP4, apical four-chamber view; AV, aortic valve; AVG, atrioventricular groove; BEAT, bedside echocardiographic assessment in trauma/critical care [69]; BLEEP, bedside limited echocardiography by emergency physician [66]; CAUSE, cardiac arrest ultrasound exam [67]; CI, cardiac index; CVP, central venous pressure; DA, descending aorta; ED, emergency department; EGLS, echo-guided life support [72]; FALLS, fluid administration limited by lung sonography [74]; FAST, focused assessment with sonography for trauma; FATE, focused assessed transthoracic echocardiography [12]; FEEL, focused echocardiographic evaluation in life support and peri-resuscitation of emergency patients [71]; FEER, focused echocardiographic evaluation in resuscitation [73]; FoCUS, focused cardiac ultrasound; FS, fractional shortening; ICU, intensive care unit; IVC, inferior vena cava; IVS, interventricular septum; LA, left atrium; LV, left ventricle; LVEDA, left ventricle end-diastole area; LVEDD, left ventricle end-diastole diameter; LVEF, left ventricular ejection fraction; LVESA, left ventricular end-systolic area; LVOT, left ventricular outflow tract; PC, pericardium; PcE, pericardial effusion; PLE, pleural effusion; PLX, parasternal long axis view; PoCUS, point-of-care ultrasound; PSX, parasternal short axis view; PW, posterior wall of left ventricle; RA, right atrium; RAP, right atrial pressure; RUSH, rapid ultrasound for shock and hypotension [9]; RUSH-HIMAP, rapid ultrasound for shock and hypotension-heart, inferior vena cava, Morrison pouch with FAST exam view and hemothorax windows, aorta, and pneumothorax [70]; RV, right ventricle; RVOT, right ventricular outflow tract; SV, stroke volume; SXP, subxyphoid view; TTE, transthoracic echocardiography; UHP, undifferentiated hypotension patient [11]; WINFOUCS, World Interactive Network Focused on Critical UltraSound
Acknowledgements
Not applicable.
Funding
The author received no funding in writing up this article.
Availability of data and materials
No datasets are used in this article.
The conclusion of this article is drawn from the author’s observation and the available evidence from the literature included already in the reference list.
Authors’ contributions
There is only one author who drafted the manuscript, read, and approved the final manuscript.
Competing interests
The author declares that he has no competing interests in writing up this article.
Consent for publication
Not applicable.
Ethics approval and consent to participate
Not applicable.
The manuscript reports no data collected from humans or animals.
References
- 1.Vincent JL, De Backer D. Circulatory shock. N Engl J Med. 2013;369:1726–34. doi: 10.1056/NEJMra1208943. [DOI] [PubMed] [Google Scholar]
- 2.Jones AE, Kline JE: S. In: Rosen’s emergency medicine: concepts and clinical practice. Volume 1. 8. Marx JA, Hockberger RS, Walls RM, editors. Philadelphia: Saunders; 2014. pp. 67–71. [Google Scholar]
- 3.Singer M, Deutschman CS, Seymour C, et al. The Third International Consensus definitions for sepsis and septic shock (sepsis-3) JAMA. 2016;315(8):801–810. doi: 10.1001/jama.2016.0287. [DOI] [PMC free article] [PubMed] [Google Scholar]
- 4.Jones AE, Aborn LS, Kline JA. Severity of emergency department hypotension predicts adverse hospital outcome. Shock. 2004;22(5):410–4. doi: 10.1097/01.shk.0000142186.95718.82. [DOI] [PubMed] [Google Scholar]
- 5.Holler JG, Bech CN, Henriksen DP, Mikkelsen S, Pedersen C, Lassen AT. Nontraumatic hypotension and shock in the emergency department and the prehospital setting, prevalence, etiology, and mortality: a systematic review. Calvert J, ed. PLoS One. 2015;10(3):e0119331. doi: 10.1371/journal.pone.0119331. [DOI] [PMC free article] [PubMed] [Google Scholar]
- 6.Moore CL, Copel JA. Point-of-care ultrasonography. N Engl J Med. 2011;364:749–57. doi: 10.1056/NEJMra0909487. [DOI] [PubMed] [Google Scholar]
- 7.American College of Emergency Physicians ACEP emergency ultrasound guidelines—2008. Ann Emerg Med. 2009;53:550–570. doi: 10.1016/j.annemergmed.2008.12.013. [DOI] [PubMed] [Google Scholar]
- 8.International Federation for Emergency Medicine. Point-of-care ultrasound curriculum guidelines. http://www.ifem.cc/wp-content/uploads/2016/03/IFEM-Point-of-Care-Ultrasound-Curriculum-Guidelines-2014-2.pdf. Accessed on 7 Mar 2016. [DOI] [PubMed]
- 9.Perera P, Mailhot T, Diley D, The MD, RUSH Exam: rapid ultrasound in shock in the evaluation of the critically ill. Emerg Med Clin N Am. 2010;28:29–56. doi: 10.1016/j.emc.2009.09.010. [DOI] [PubMed] [Google Scholar]
- 10.Atkinson PRT, McAulety DJ, Kendall RJ, Abeyakoon O, Reid CG, Connolly J, Lewis D. Abdominal and Cardiac Evaluation with Sonography in Shock (ACES): an approach by emergency physicians for the use of ultrasound in patients with undifferentiated hypotension. Emerg Med J. 2009;26(2):87–91. doi: 10.1136/emj.2007.056242. [DOI] [PubMed] [Google Scholar]
- 11.Rose JS, Bair AE, Mandavia D, The KDJ, UHP Ultrasound protocol: a novel ultrasound approach to the empiric evaluation of the undifferentiated hypotensive patient. Am J Emerg Med. 2001;19:299–302. doi: 10.1053/ajem.2001.24481. [DOI] [PubMed] [Google Scholar]
- 12.Manasia AR, Nagaraj HM, Kodali RB, Croft LB, Oropello JM, Kohi-Seth R, et al. Feasibility and potential clinical utility of goal-directed transthoracic echocardiography performed by noncardiologist intensivists using a small hand-carried device (SonoHeart) in critically ill patients. J Cardiothorac Vasc Anesth. 2005;19(2):155–9. doi: 10.1053/j.jvca.2005.01.023. [DOI] [PubMed] [Google Scholar]
- 13.Via G, Hussain A, Wells M, Reardon R, ElBarbary M, et al. International evidence-based recommendations for focused cardiac ultrasound. J Am Soc Echocardiogr. 2014;27(7):683. doi: 10.1016/j.echo.2014.05.001. [DOI] [PubMed] [Google Scholar]
- 14.Oh JK, Meloy TD, Seward JB. Echocardiography in the emergency room: is it feasible, beneficial, and cost-effective? Echocardiography. 1995;12:163–170. doi: 10.1111/j.1540-8175.1995.tb00536.x. [DOI] [PubMed] [Google Scholar]
- 15.Plummer D. Principles of emergency ultrasound and echocardiography. Ann Emerg Med. 1989;18:1291–1297. doi: 10.1016/S0196-0644(89)80262-8. [DOI] [PubMed] [Google Scholar]
- 16.Frederiksen CA, Juhl-olsen P, Larsen UT, Nielsen DG, Eika B, Sloth E. New pocket echocardiography device is interchangeable with high-end portable system when performed by experienced examiners. Acta Anaesthesiol Scand. 2010;54:1217–1223. doi: 10.1111/j.1399-6576.2010.02320.x. [DOI] [PubMed] [Google Scholar]
- 17.Andersen GN, Haugen BO, Graven T, Salvesen Ø, Mjølstad OC, Dalen H. Feasibility and reliability of point-of-care pocket-sized echocardiography. Eur J Echocardiogr. 2011;12(9):665–670. doi: 10.1093/ejechocard/jer108. [DOI] [PMC free article] [PubMed] [Google Scholar]
- 18.Mjølstad OC, Andersen GN, Dalen H, et al. Feasibility and reliability of point-of-care pocket-size echocardiography performed by medical residents. Eur Heart J Cardiovasc Imaging. 2013;14(12):1195–1202. doi: 10.1093/ehjci/jet062. [DOI] [PMC free article] [PubMed] [Google Scholar]
- 19.Darocha T, Gatazkowski R, Sobczyk D, Zyla Z, Drwila R. Point-of-care ultrasonography during rescue operations on board a Polish Medical Air Rescue helicopter. J Ultrason. 2014;14:414–420. doi: 10.15557/JoU.2014.0043. [DOI] [PMC free article] [PubMed] [Google Scholar]
- 20.Cheung AT, Savino JS, Weiss SJ, Aukburg SJ, Berlin JA. Echocardiographic and hemodynamic indexes of left ventricular preload in patients with normal and abnormal ventricular function. Anesthesiology. 1994;81:376–387. doi: 10.1097/00000542-199408000-00016. [DOI] [PubMed] [Google Scholar]
- 21.Vermeiren G, Malbrain M, Walpot J. Cardiac ultrasonography in the critical care setting: a practical approach to assess cardiac function and preload for the “non-cardiologist”. Anaesthesiol Intensive Ther. 2015;47:s89–s104. doi: 10.5603/AIT.a2015.0074. [DOI] [PubMed] [Google Scholar]
- 22.Leung JM, Levine EH. Left ventricular end-systolic cavity obliteration as an estimate of intraoperative hypovolemia. Anesthesiology. 1994;81:1102–1109. doi: 10.1097/00000542-199411000-00003. [DOI] [PubMed] [Google Scholar]
- 23.Lang RM, Bierig M, Devereux RB, Flachskampf FA, Foster E, Pellikka PA, Picard MH, American Society of Echocardiography’s Nomenclature and Standards Committee, Task Force on Chamber Quantification, American College of Cardiology Echocardiography Committee, American Heart Association, European Association of Echocardiography, European Society of Cardiology et al. Recommendations for chamber quantification. Eur J Echocardiogr. 2006;7(2):79–108. doi: 10.1016/j.euje.2005.12.014. [DOI] [PubMed] [Google Scholar]
- 24.Jardin F, Dubourg O, Bourdarias JP. Echocardiographic pattern of acute cor pulmonale. Chest. 1997;111(1):209–217. doi: 10.1378/chest.111.1.209. [DOI] [PubMed] [Google Scholar]
- 25.Marik PE, Baram M, Vahid B. Does the central venous pressure predict fluid responsiveness? A systematic review of the literature and the tale of seven mares. Chest. 2008;134:172–178. doi: 10.1378/chest.07-2331. [DOI] [PubMed] [Google Scholar]
- 26.Feissel M, Michard F, Faller JP, Teboul JL. The respiratory variation in inferior vena cava diameter as a guide to fluid therapy. Intensive Care Med. 2004;30(9):1834–7. doi: 10.1007/s00134-004-2233-5. [DOI] [PubMed] [Google Scholar]
- 27.Yanagawa Y, Sakamoto T, Okada Y. Hypovolemic shock evaluated by sonographic measurement of the inferior vena cava during resuscitation in trauma patients. J Trauma. 2007;63:1245–1248. doi: 10.1097/TA.0b013e318068d72b. [DOI] [PubMed] [Google Scholar]
- 28.Dipti A, Soucy Z, Surana A, Chandra S. Role of inferior vena cava diameter in assessment of volume status: a meta-analysis. Am J Emerg Med. 2012;30:1414–1419. doi: 10.1016/j.ajem.2011.10.017. [DOI] [PubMed] [Google Scholar]
- 29.Barbier C, Loubieres Y, Schmit C, Hayon J, Ric^ome JL, et al. Respiratory changes in inferior vena cava diameter are helpful in predicting fluid responsiveness in ventilated septic patients. Intensive Care Med. 2004;30:1740–1746. doi: 10.1007/s00134-004-2259-8. [DOI] [PubMed] [Google Scholar]
- 30.Muller L, Bobbia X, Toumi M, Louart G, Molinari N, et al. Respiratory variations of inferior vena cava diameter to predict fluid responsiveness in spontaneously breathing patients with acute circulatory failure: need for a cautious use. Crit Care. 2012;16(5):R188. doi: 10.1186/cc11672. [DOI] [PMC free article] [PubMed] [Google Scholar]
- 31.Wallace DJ, Allison M, Stone MB. Inferior vena cava percentage collapse during respiration is affected by the sampling location: an ultrasound study in healthy volunteers. Acad Emerg Med. 2010;17:96–99. doi: 10.1111/j.1553-2712.2009.00627.x. [DOI] [PubMed] [Google Scholar]
- 32.Rudski LG, Lai WW, Afilalo J, Hua L, Hanschumacher MD, et al. Guidelines for the echocardiographic assessment of the right heart in adults: a report from the American Society of Echocardiography endorsed by the European Association of Echocardiography, a registered branch of the European Society of Cardiology, and the Canadian Society of Echocardiography. J Am Soc Echocardiogr. 2010;23:685. doi: 10.1016/j.echo.2010.05.010. [DOI] [PubMed] [Google Scholar]
- 33.Ferrada P, Vanguri P, Anand RJ, Whelan J, Duane T, et al. A, B, C, D, echo: limited transthoracic echocardiogram is a useful tool to guide therapy for hypotension in the trauma bay—a pilot study. J Trauma Acute Care Surg. 2013;74(1):220–3. doi: 10.1097/TA.0b013e318278918a. [DOI] [PubMed] [Google Scholar]
- 34.Ferrada P, Evans D, Wolfe L, Anand RJ, Vanguri P, et al. Findings of a randomized controlled trial using limited transthoracic echocardiogram (LTTE) as a hemodynamic monitoring tool in the trauma bay. J Trauma Acute Care Surg. 2014;76(1):31–7. doi: 10.1097/TA.0b013e3182a74ad9. [DOI] [PubMed] [Google Scholar]
- 35.Hagan PG, Nienaber CA, Isselbacher EM, Bruckman D, Karavite DJ, Russman PL, et al. International Registry of Acute Aortic Dissection (IRAD): new insights from an old disease. JAMA. 2000;283:897–903. doi: 10.1001/jama.283.7.897. [DOI] [PubMed] [Google Scholar]
- 36.Nienaber CA, von Kodolitsch Y, Nicolas V, Siglow V, Piepho A, Jaup T, et al. The diagnosis of thoracic aortic dissection by noninvasive imaging procedures. N Engl J Med. 1993;328:1–9. doi: 10.1056/NEJM199301073280101. [DOI] [PubMed] [Google Scholar]
- 37.Evangelista A, Flachskamp FA, Erbel R, Antonini-Canterin F, Vlachopoulos C, Rocchi G, et al. Echocardiography in aortic diseases: EAE recommendations for clinical practice. Eur J Echocardiogr. 2010;11:645–58. doi: 10.1093/ejechocard/jeq056. [DOI] [PubMed] [Google Scholar]
- 38.Brodmanna M, Starka G, Pabsta E, Luegerb A, Pilger E. Pulmonary embolism and intracardiac thrombi—individual therapeutic procedures. Vascular Med. 2000;5:27–31. doi: 10.1177/1358836X0000500105. [DOI] [PubMed] [Google Scholar]
- 39.Cohen R, Loarte P, Navarro V, Mirrer B. Echocardiographic findings in pulmonary embolism: an important guide for the management of the patient. World J Cardiovas Diseases. 2012;2:161–164. doi: 10.4236/wjcd.2012.23027. [DOI] [Google Scholar]
- 40.Reynen K. Cardiac myxoma. N Engl J Med. 1995;333(24):1610–7. doi: 10.1056/NEJM199512143332407. [DOI] [PubMed] [Google Scholar]
- 41.Wilson SP, Suszanski J, Goyal N. Prompt diagnosis of an unusual cause of obstructive shock using point-of-care ultrasound. J Emerg Med. 2015;49(5):e151–e152. doi: 10.1016/j.jemermed.2015.06.033. [DOI] [PubMed] [Google Scholar]
- 42.Lang RM, Badano LP, Mor-Avi V, Afilalo J, Armstrong A, Ernade L, et al. Recommendations for cardiac chamber quantification by echocardiography in adults: an update from the American Society of Echocardiography and the European Association of Cardiovascular Imaging. J Am Soc Echocardiogr. 2015;28:1–39. doi: 10.1016/j.echo.2014.10.003. [DOI] [PubMed] [Google Scholar]
- 43.Perera P, Lobo V, Williams SR, Gharahbaghian L. Cardiac echocardiography. Crit Care Clin. 2014;30:47–92. doi: 10.1016/j.ccc.2013.08.003. [DOI] [PubMed] [Google Scholar]
- 44.Kendall JL, Bahner DP, Blavias M, Budhram G, Dean AJ, Fox CJ et. Al. American College of Physician Policy Statement: Emergency Ultrasound Imaging Criteria Compendium 2014. http://www.acep.org/workarea/downloadasset.aspx?id=32886 Accessed on March 29, 2016.
- 45.Gudmundsson P, Rydberg E, Winter R, Wilenheimer R. Visually estimated left ventricular ejection fraction by echocardiography is closely correlated with formal quantitative methods. Int J Cardiol. 2005;101:209–212. doi: 10.1016/j.ijcard.2004.03.027. [DOI] [PubMed] [Google Scholar]
- 46.Shaghgaldi K, Gudmundsson P, Manouras A, Brodin LA, Winter R. Visually estimated ejection fraction by two dimensional and triplane echocardiography is closely correlated with quantitative ejection fraction by real-time three dimensional echocardiography. Cardiovascular Ultrasound. 2009;7:41. doi: 10.1186/1476-7120-7-41. [DOI] [PMC free article] [PubMed] [Google Scholar]
- 47.Unluer EE, Karagoz A, Akoglu H, Bayata S. Visual estimation of bedside echographic ejection fraction by emergency physicians. West J Emerg Med. 2014;15(2):221–226. doi: 10.5811/westjem.2013.9.16185. [DOI] [PMC free article] [PubMed] [Google Scholar]
- 48.Randazzo MR, Snoey ER, Levitt A, Binder K. Accuracy of emergency physician assessment of left ventricular ejection fraction and central venous pressure using echocardiography. Acad Emerg Med. 2003;10(9):973–977. doi: 10.1111/j.1553-2712.2003.tb00654.x. [DOI] [PubMed] [Google Scholar]
- 49.Bustam A, Noor Azhar M, Singh Veriah R, Arumugam K, Loch A. Performance of emergency physicians in point-of-care echocardiography following limited training. Emerg Med J. 2014;31:369–373. doi: 10.1136/emermed-2012-201789. [DOI] [PubMed] [Google Scholar]
- 50.Fink HA, Lederle FA, Roth CS, Bowles CA, Nelson DB, Haas MA. The accuracy of physical examination to detect abdominal aortic aneurysm. Arch Intern Med. 2000;160(6):833–6. doi: 10.1001/archinte.160.6.833. [DOI] [PubMed] [Google Scholar]
- 51.Tayal VS, Graf CD, Gibbs MA. Prospective study of accuracy and outcome of emergency ultrasound for abdominal aortic aneurysm over two years. Acad Emerg Med. 2003;10:867–71. doi: 10.1111/j.1553-2712.2003.tb00630.x. [DOI] [PubMed] [Google Scholar]
- 52.Plummer D, Clinton J, Matthew B. Emergency department ultrasound improves time to diagnosis and survival in ruptured abdominal aortic aneurysm. Acad Emerg Med. 1998;5:417. [Google Scholar]
- 53.Lo WL, Mok KL. Ruptured splenic artery aneurysm detected by emergency ultrasound—a case report. Crit Ultrasound J. 2015;7:9. doi: 10.1186/s13089-015-0026-4. [DOI] [PMC free article] [PubMed] [Google Scholar]
- 54.Callahan JA, Seward JB, Nishimura RA, Miller FA, Jr, Reeder GS, Shub C, et al. Two-dimensional echocardiographically guided pericardiocentesis: experience in 117 consecutive patients. Am J Curdiol. 1985;55:476–479. doi: 10.1016/0002-9149(85)90397-2. [DOI] [PubMed] [Google Scholar]
- 55.Kopecky SL, Callahan JA, Tajik AJ, Seward JB. Percutaneous pericardial catheter drainage: report of 42 consecutive cases. Am J Curdiol. 1986;58:633–635. doi: 10.1016/0002-9149(86)90290-0. [DOI] [PubMed] [Google Scholar]
- 56.Tsang T, Enriquez-Sarano M, Freeman WK. Consecutive 1127 therapeutic echocardiographically guided pericardiocenteses: clinical profile, practice patterns and outcomes spanning 21 years. Mayo Clin Proc. 2002;77:429–36. doi: 10.1016/S0025-6196(11)62211-8. [DOI] [PubMed] [Google Scholar]
- 57.McConnell MV, Solomon SD, Rayan ME, Come PC, Goldhaber SZ, Lee RT. Regional right ventricular dysfunction detected by echocardiography in acute pulmonary embolism. Am J Cardiol. 1996;78:469–473. doi: 10.1016/S0002-9149(96)00339-6. [DOI] [PubMed] [Google Scholar]
- 58.López-Candales A, Edelman K, Candales MD. Right ventricular apical contractility in acute pulmonary embolism: the McConnell sign revisited. Echocardiography. 2010;27:614–20. doi: 10.1111/j.1540-8175.2009.01103.x. [DOI] [PubMed] [Google Scholar]
- 59.Guyatt GH, Akl EA, Crowther M, Gutterman DD, Schunemann HJ, American College of Chest Physicians Antithrombotic Therapy and Prevention of Thrombosis Panel Executive Summary: antithrombotic therapy and prevention of thrombosis, 9th ed: American College of Chest Physicians evidence-based clinical practice guidelines. Chest. 2012;141(2 Suppl):7S–47S. doi: 10.1378/chest.1412S3. [DOI] [PMC free article] [PubMed] [Google Scholar]
- 60.Spittell PC, Spittell JA, Jr, Joyce JW, Tajik AJ, Edwards WD, Schaff HV, et al. Clinical features and differential diagnosis of aortic dissection: experience with 236 cases (1980 through 1990) Mayo Clin Proc. 1993;68:642–51. doi: 10.1016/S0025-6196(12)60599-0. [DOI] [PubMed] [Google Scholar]
- 61.Repessé X, Charron C, Vieillard-Baroncorresponding A. Evaluation of left ventricular systolic function revisited in septic shock. Crit Care. 2013;17(4):164. doi: 10.1186/cc12755. [DOI] [PMC free article] [PubMed] [Google Scholar]
- 62.Via G, Price S, Storti E. Echocardiography in the sepsis syndromes. Crit Ultrasound J. 2011;3(2):71–85. doi: 10.1007/s13089-011-0069-0. [DOI] [Google Scholar]
- 63.Vieillard-Baron CV, Charron C, et al. The actual incidence of global left ventricular hypokinesia in adult septic shock. Crit Care Med. 2008;36:1701–1706. doi: 10.1097/CCM.0b013e318174db05. [DOI] [PubMed] [Google Scholar]
- 64.Bahner DP. Trinity: a hypotensive ultrasound protocol. JDMS. 2002;18:193–198. [Google Scholar]
- 65.Jensen MB, Sloth E, Larsen KM, Schmidt MB. Transthoracic echocardiography for cardiopulmonary monitoring in intensive care. Eur J Anaesthsiol. 2004;21:700–7. doi: 10.1097/00003643-200409000-00006. [DOI] [PubMed] [Google Scholar]
- 66.Pershad J, Myers S, Plouman C, Rosson C, Elam K, et al. Bedside limited echocardiography by the emergency physician is accurate during evaluation of the critically ill patient. Pediatrics. 2004;114:e667–671. doi: 10.1542/peds.2004-0881. [DOI] [PubMed] [Google Scholar]
- 67.Hernandez C, Shuler K, Hannan H, Sonyika C, Likourezos A, et al. C.A.U.S.E.: cardiac arrest ultra-sound exam—a better approach to managing patients in primary non-arrhythmogenic cardiac arrest. Resuscitation. 2008;76(2):198–206. doi: 10.1016/j.resuscitation.2007.06.033. [DOI] [PubMed] [Google Scholar]
- 68.Breitkreutz R, Walcher F, Seeger FH. Focused echocardiographic evaluation in resuscitation management: concept of an advanced life support-conformed algorithm. Crit Care Med. 2007;35(5 Suppl):S150–61. doi: 10.1097/01.CCM.0000260626.23848.FC. [DOI] [PubMed] [Google Scholar]
- 69.Gunst M, Ghaemmaghami V, Sperry J, Robinson M, O’Keeffe T, et al. Accuracy of cardiac function and volume status estimates using the bedside echocardiographic assessment in trauma/critical care. J Trauma. 2008;65(3):509–16. doi: 10.1097/TA.0b013e3181825bc5. [DOI] [PubMed] [Google Scholar]
- 70.Weingart SD, Duque D, and Nelson B. Rapid ultrasound for shock and hypotension (RUSH-HIMAPP), 2009, http://emcrit.org/rush-exam/original-rush-article/.
- 71.Breitkreutz R, Price S, Steiger HV, Seeger FH, Ilper H, et al. Focused echocardiographic evaluation in life support and peri-resuscitation of emergency patients: a prospective trial. Resuscitation. 2010;81(11):1527–33. doi: 10.1016/j.resuscitation.2010.07.013. [DOI] [PubMed] [Google Scholar]
- 72.Lanctot JF, Valois M, Beaulieu Y. EGLS: echo-guided life support. Crit Ultrasound J. 2011;3:123–129. doi: 10.1007/s13089-011-0083-2. [DOI] [Google Scholar]
- 73.Ferrada P, Murthi S, Anand RJ, Bochicchio GV, Scalea T. Transthoracic focused rapid echocardiographic examination: real-time evaluation of fluid status in critically ill trauma patients. J Trauma. 2011;70(1):56–62. doi: 10.1097/TA.0b013e318207e6ee. [DOI] [PubMed] [Google Scholar]
- 74.Lichtenstein D. FALLS-protocol: lung ultrasound in hemodynamic assessment of shock. Heart Lung and Vessels. 2013;5(3):142–147. [PMC free article] [PubMed] [Google Scholar]
- 75.Liteplo A, Noble V, Atkinson P. My patient has no blood pressure: point-of-care ultrasound in the hypotensive patient—FAST and RELIABLE. Ultrasound. 2012;20:64–68. doi: 10.1258/ult.2011.011044. [DOI] [Google Scholar]
- 76.Volpicelli G, Lamorte A, Tullio M, Cardinale L, Giraudo M, et al. Point-of-care multiorgan ultrasonography for the evaluation of undifferentiated hypotension in the emergency department. Intensive Care Med. 2013;39(7):1290–8. doi: 10.1007/s00134-013-2919-7. [DOI] [PubMed] [Google Scholar]
- 77.Shokoohi H, Boniface KS, Pourmand A, Liu YT, Davison DL, et al. Bedside ultrasound reduces diagnostic uncertainty and guides resuscitation in patients with undifferentiated hypotension. Crit Care Med. 2015;43(12):2562–9. doi: 10.1097/CCM.0000000000001285. [DOI] [PubMed] [Google Scholar]
- 78.Jones AE, Tayal Suilivan DM, Kline JA. Randomized controlled trial of immediate versus goal directed ultrasound to identify the cause of nontraumatic hypotension in emergency department patients. Crit Care Med. 2004;32:1703–8. doi: 10.1097/01.CCM.0000133017.34137.82. [DOI] [PubMed] [Google Scholar]
- 79.Ghane MR, Gharib M, Ebrahimi A, Saeedi M, Akbari-Kamrani M, et al. Accuracy of early rapid ultrasound in shock (RUSH) examination performed by emergency physician for diagnosis of shock etiology in critically ill patients. J Emerg Trauma Shock. 2015;8(1):5–10. doi: 10.4103/0974-2700.145406. [DOI] [PMC free article] [PubMed] [Google Scholar]
- 80.Ghane MR, Gharib MH, Ebrahimi A, Samimi K, Rezaee M, et al. Accuracy of rapid ultrasound in shock (rush) exam for diagnosis of shock in critically ill patients. Trauma Monthly. 2015;20(1):e20095. doi: 10.5812/traumamon.20095. [DOI] [PMC free article] [PubMed] [Google Scholar]
- 81.Kanji HD, McCallum J, Sirounis D, MacRedmond R, Moss R, et al. Limited echocardiography-guided therapy in subacute shock is associated with changes in management and improved outcome. J Crit Care. 2014;29(5):700–5. doi: 10.1016/j.jcrc.2014.04.008. [DOI] [PubMed] [Google Scholar]
Associated Data
This section collects any data citations, data availability statements, or supplementary materials included in this article.
Data Availability Statement
No datasets are used in this article.
The conclusion of this article is drawn from the author’s observation and the available evidence from the literature included already in the reference list.


