Significance
The canonical method of inactivating DNA-binding repressors is through the competitive binding of an antirepressor to the operator-binding site of the repressor. Here, structural and functional studies of a homotetrameric repressor (Rep 92–198) and a hetero-octameric complex between the repressor and its antirepressor (Ant) from the temperate Salmonella phage SPC32H revealed a noncanonical mechanism of repressor-operator disassembly. Notably, Ant does not compete for the DNA-binding region of Rep. Instead, the tetrameric Ant binds to the N-terminal and C-terminal domains of two asymmetric Rep dimers, causing the stably bound Rep to detach from the DNA. These studies also suggested that the dimer pairs of the N-terminal DNA-binding domains of Rep originate from different dimers of a Rep tetramer.
Keywords: repressor, antirepressor, transcription, Salmonella, bacteriophage
Abstract
DNA-binding repressors are involved in transcriptional repression in many organisms. Disabling a repressor is a crucial step in activating expression of desired genes. Thus, several mechanisms have been identified for the removal of a stably bound repressor (Rep) from the operator. Here, we describe an uncharacterized mechanism of noncanonical DNA binding and induction by a Rep from the temperate Salmonella phage SPC32H; this mechanism was revealed using the crystal structures of homotetrameric Rep (92–198) and a hetero-octameric complex between the Rep and its antirepressor (Ant). The canonical method of inactivating a repressor is through the competitive binding of the antirepressor to the operator-binding site of the repressor; however, these studies revealed several noncanonical features. First, Ant does not compete for the DNA-binding region of Rep. Instead, the tetrameric Ant binds to the C-terminal domains of two asymmetric Rep dimers. Simultaneously, Ant facilitates the binding of the Rep N-terminal domains to Ant, resulting in the release of two Rep dimers from the bound DNA. Second, the dimer pairs of the N-terminal DNA-binding domains originate from different dimers of a Rep tetramer (trans model). This situation is different from that of other canonical Reps, in which two N-terminal DNA-binding domains from the same dimeric unit form a dimer upon DNA binding (cis model). On the basis of these observations, we propose a noncanonical model for the reversible inactivation of a Rep by an Ant.
The binding of a repressor (Rep) to an operator site is a well-known mechanism of negative regulation to inhibit transcriptional initiation (1). To initiate the expression of desired genes, Rep–operator interactions must be disrupted, which can occur by various means, including the binding of small molecule inducers (2, 3). Interactions with these components disrupt the ability of a Rep to bind to the operator by either altering its 3D structure or inducing proteolysis (4). Another method of inactivating a Rep is through the competitive binding of an antirepressor (Ant) to the operator-binding site of a Rep (1). In this case, the Ant commonly mimics the structure of DNA to bind competitively to the Rep (5). DNA mimic proteins have been discovered in prokaryotes, eukaryotes, and viruses (5, 6); these proteins are involved in various DNA regulatory functions, including transcriptional control (7) and DNA packaging (8). Although the structures of DNA-mimic proteins are diverse, they have similar surface-charge distributions that mimic the surface properties of DNA (5). Despite the previous structural and functional studies of Ant, the only known mechanism by which most Ants disable a Rep is through a simple competitive-binding mechanism. Our central motivation in this study was to discover other potential mechanisms by which an Ant could disrupt the high-affinity Rep–DNA interaction.
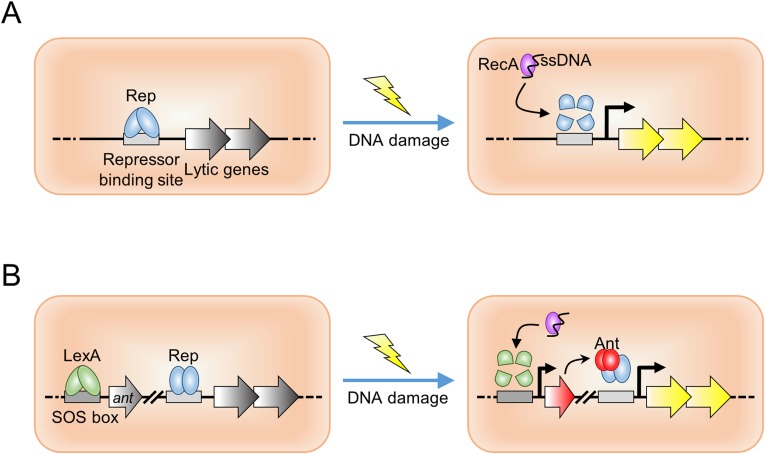
We studied a previously uncharacterized Rep and Ant from temperate bacteriophages (hereafter, “phages”). In the lysogenic pathway of temperate phages, the expression of genes essential for the lytic cycle is tightly repressed by the phage Rep, and host cell lysis is strictly inhibited. Therefore, for the cell to enter the lytic pathway, the Rep must be inactivated for the expression of the genes essential for the lytic cycle. Phages adapt the host SOS response caused by physiological changes in the host cells, UV light irradiation, or DNA damage to inactivate the phage Rep for this lytic switch. To date, two mechanisms for the inactivation of the phage Rep in temperate phages have been described. The CI repressors of lambda phage form dimers to bind operators that control the expression of lambda genes in the lysogenic phage, and derepression allowing entry into the lytic cycle relies on the autoproteolysis of CI repressors (9–11). The second mechanism to control repressor activity uses the Ant. In these lysogenic phages, the host SOS response repressor LexA binds to the Ant promoter. Activation of the host RecA by the SOS response induces the autoproteolysis of the LexA bound to the Ant promoter and thereby derepresses the phage Ant gene. Subsequently, newly synthesized Ant binds and then disassembles the phage Rep, resulting in the production of the proteins essential for the lytic cycle (Fig. S1). Previously, we reported a previously unidentified homolog of Ant from the temperate phage SPC32H, which is a novel Podoviridae phage (11).
Fig. S1.
Schematic of the lytic switch in prophages. (A) A classical cleavable repressor system representative of phage lambda. Upon host DNA damage, phage Rep is autocleaved by an activated host RecA protein, resulting in derepression of phage lytic genes. (B) The Rep/Ant system found in some prophages, such as SPC32H. An activated host RecA protein induces the autoproteolysis of the host LexA protein that represses phage Ant expression. Newly expressed Ant protein sequesters the cognate phage Rep from the operator, leading to phage lytic gene expression.
The crystal structure of the Rep–Ant complex from this temperate Salmonella phage revealed a noncanonical bimodal binding interaction between a tetrameric Ant and two dimeric Reps, a feature that had not been previously described. The Rep C-terminal domains contribute to Ant recruitment, simultaneously facilitating the release of two Rep dimers from the operator sites. Surprisingly, the Rep C-terminal domains also serve as the binding interface between two Rep dimers for the assembly of a Rep tetramer. On the basis of the biochemical and mutational analyses and the octameric and tetrameric structures of the Rep–Ant complex and Rep92–198, respectively, we have proposed a model for how tetrameric Ant disassembles higher-order Rep complexes that are bound to multiple binding sites.
Results and Discussion
Interaction Between Rep and Ant.
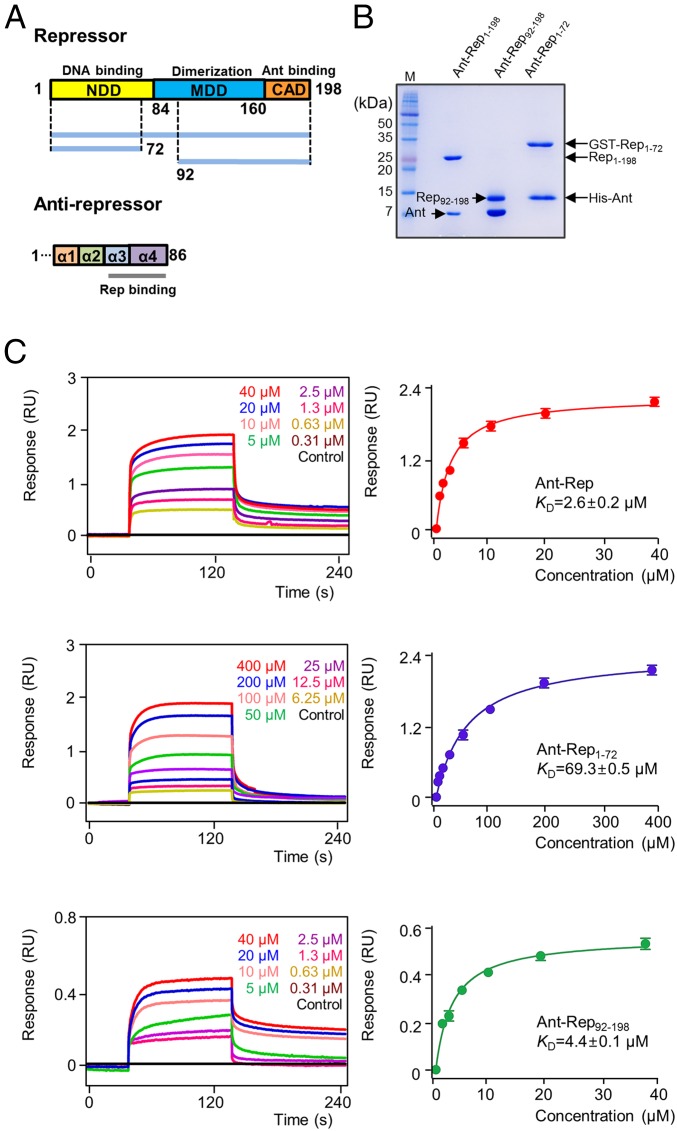
A stable binary complex of Rep and Ant from SPC32H was reconstituted by mixing a wet cell pellet containing overexpressed Rep with a cell pellet that contained overexpressed Ant (Fig. 1 A and B). The Rep and Ant proteins coeluted from an affinity column and comigrated on size-exclusion columns (Fig. 1B). By passage through chelating and GST columns, the Rep–Ant binary complex could be purified without monomeric subunits. To map the binding interactions between Rep and Ant, binding affinities were measured using bio-layer interferometry (BLI). Full-length Rep bound to full-length Ant with a dissociation constant (Kd) = 2.6 μM (Fig. 1C). As shown in Fig. 1C, both Rep1–72 and Rep92–198 bound to Ant (69.3 and 4.4 μM, respectively), suggesting that at least two sites on Rep are involved in Ant binding. When Rep1–72 and Rep92–198 were expressed individually with Ant, the Ant–Rep92–198 complex was stable during its purification (Fig. 1B); however, the Ant–Rep1–72 complex dissociated easily during the purification.
Fig. 1.
Mapping the Rep–Ant binding region. (A) Domain architectures of Rep and Ant. Rep constructs are shown by blue lines, and Rep/Ant binding regions are indicated. (B) SDS/PAGE of Rep1–198–Ant1–86, Rep1–72–Ant1–86, and Rep92–198–Ant1–86 complexes. SDS/PAGE gels were visualized using Coomassie Blue. (C) Representative BLI binding sensorgrams of Ant1–86 with Rep1–198, Rep1–72, and Rep92–198. The experiments were repeated three times. Each concentration of analytes is shown in a different color.
Structure Determination of the Rep–Ant Complex.
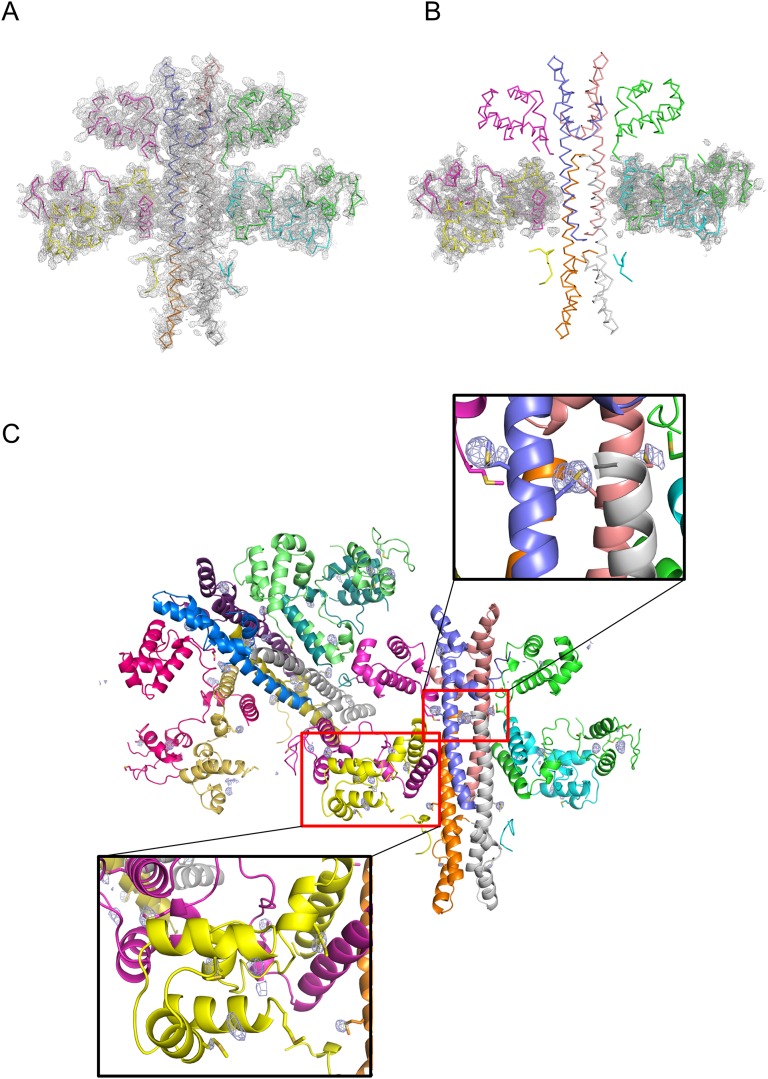
To gain mechanistic insight into how Ant disrupts the interaction between Rep and DNA, we studied the structural organization of the Rep–Ant complex. A crystal structure of the complex was solved at 2.5-Å resolution (Table S1). Almost the entire sequences of both Rep and Ant are ordered, with the exception of the N-terminal flexible loops (10–20 residues) in Ant (Fig. 2) and two flexible loops in Rep that correspond to residues 77–89 and 107–119 connecting helices α6–α7 and α7–α8, respectively (Fig. 2 and Fig. S2). Among the eight expected N-terminal domains (residues 1–83) of Rep in the asymmetric unit, four domains were not visible (Fig. S3), although residues 67–76 could be observed. The fidelity of the sequence assignments for each Rep and Ant in the asymmetric unit was confirmed by calculating anomalous difference maps for selenium using SeMet crystals (Fig. S3 and Table S2).
Table S1.
Data collection and refinement statistics
| Rep–Ant complex | Rep92–198 (native) | ||
| SeMet derivative | Native | ||
| Crystal parameters | |||
| X-ray source | BL26B1 | PAL-7A | PAL-7A |
| X-ray wavelength, Å | 0.97707 | 1.00001 | 0.97935 |
| Space group | P32 | P32 | P1 |
| Unit cell parameters | |||
| a, b, c, Å | 87.6, 87.6, 331.9 | 86.6, 86.6, 337.0 | 61.6, 62.5, 267.9 |
| γ, degrees | 120.00 | 120.00 | 72.7 |
| Absorption (Se) | Peak | ||
| Resolution range, Å | 50–2.80 | 50–2.50 | 50–3.0 |
| Total/unique reflections | 749,684/139,420 | 362,760/96,551 | 246,012/ 150,114 |
| Completeness, % | 99.9 (99.7)* | 99.3 (99.9)† | 98.5 (98.6)‡ |
| Average I/σ, I | 47.2 (4.0)* | 27.4 (2.9)† | 22.8 (4.9)‡ |
| Rmerge§, % | 13.3 (83.9)* | 8.8 (64.6)† | 7.2 (33.2)‡‡ |
| Model refinement statistics | |||
| Resolution range, Å | 36.6–2.5 | 49.1–3.0 | |
| Rwork/Rfree¶, % | 20.1/21.0 | 21.6/27.3 | |
| Number/average B-factor, Å2 | |||
| Protein nonhydrogen atoms | 13,264/64.4 | 25,435/78.5 | |
| Water oxygen atoms | 64/66.2 | 527/41.4 | |
| Rmsd | |||
| Bond lengths, Å | 0.006 | 0.007 | |
| Bond angles, degrees | 0. 980 | 1.254 | |
| Protein-geometry analysis | |||
| Ramachandran favored, % | 94.15 | 90.95 | |
| Ramachandran allowed, % | 5.73 | 6.40 | |
| Ramachandran outliers, % | 0.12 | 2.65 | |
Values in parentheses refer to the highest-resolution shell (2.85–2.80 Å).
Values in parentheses refer to the highest-resolution shell (2.54–2.50 Å).
Values in parentheses refer to the highest-resolution shell (3.05–3.00 Å).
Rmerge = ΣhklΣi | Ii(hkl) – <I(hkl)> |/ΣhklΣi Ii(hkl)i, where I(hkl) is the intensity of reflection hkl, Σhkl is the sum over all reflections, and Σi is the sum over i measurements of reflection hkl.
R = Σhkl | |Fobs| – |Fcalc| |/Σhkl |Fobs|, where Rfree was calculated for a randomly chosen 5% of reflections, which were not used for structure refinement, and Rwork was calculated for the remaining.
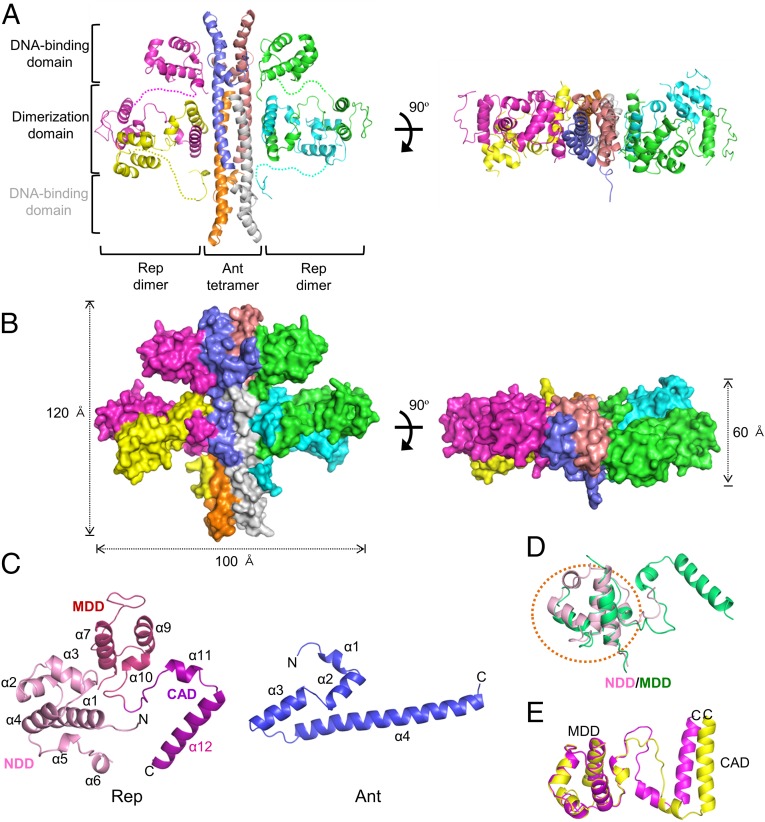
Fig. 2.
Overall structure of the Rep–Ant complex. (A and B) Ribbon (A) and surface (B) diagrams of the Rep–Ant octamer. Each chain is shown in a different color. Ribbon and surface diagrams of the octamer rotated by 90° around the indicated axis in the left figure are drawn on the right. Gray labeling indicates the positions of two invisible DNA-binding domains (yellow and cyan). (C) Monomer structures of Rep and Ant. (D) Superimposition of the NDD (pink) and the MDD (green) from the Rep–Ant complex. (E) Superimposition of two Rep monomers from the Rep–Ant complex. Each chain is colored purple or yellow.
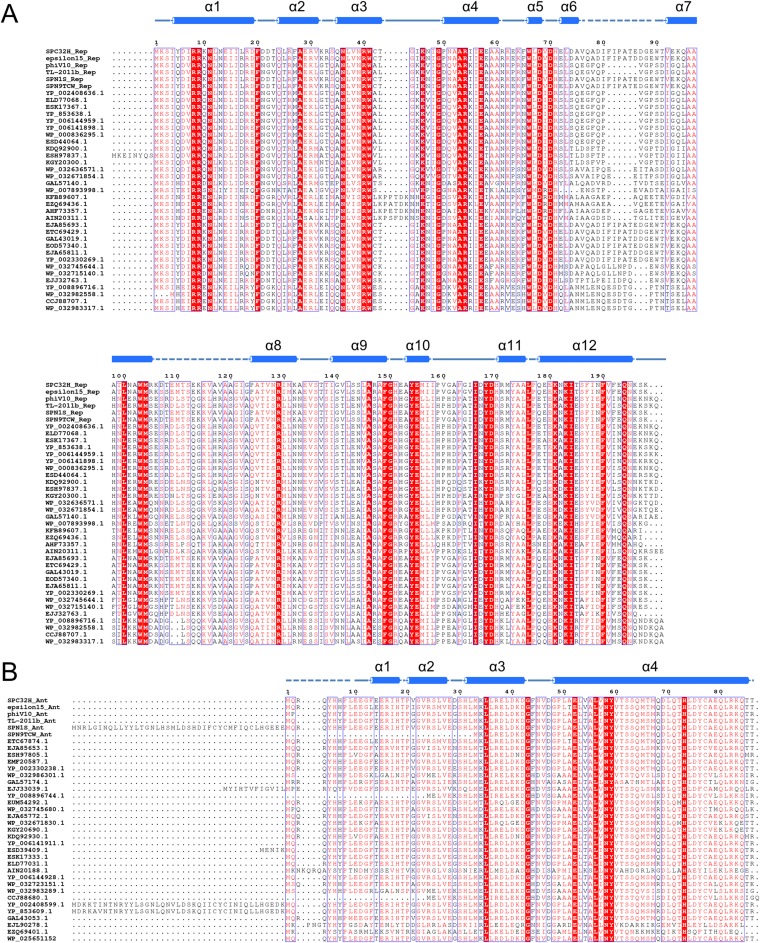
Fig. S2.
Sequence alignments of Rep (A) and Ant (B). Multialignment of S. Typhimurium Rep (UniProtKB accession no. T1S9Z0) against Rep from Salmonella phage epsilon15 (UniProtKB accession no. Q858D7), Escherichia phage phiV10 (UniProtKB accession no. Q286X7), Escherichia phage TL-2011b (UniProtKB accession no. G9L6A6), Salmonella phage SPN1S (UniProtKB accession no. H2D0H9), Salmonella phage SPN9TCW (UniProtKB accession no. M1F232), E. coli O118:H16 str. 2009C-4446 (UniProtKB accession no. A0A028E2H1), E. coli KTE235 (Ensembl Bacteria accession no. ELD77068), E. coli UMEA 3290-1 (Ensembl Bacteria accession no. ESK17367), E. coli MS 196-1 (UniProtKB accession no. D8BV09), E. coli O7:K1 str. CE10 (RefSeq accession no. YP_006144959), E. coli NA114 (RefSeq accession no. YP_006141898), E. coli MS 185-1 (RefSeq accession no. WP_000836295), E. coli 908519 (UniProtKB accession no. V0VMF3), Salmonella enterica subsp. enterica serovar Bareilly str. CFSAN000179 (EMBL-WGS accession no. KDQ92900), S. enterica subsp. enterica serovar Agona str. 632182-2 (Ensembl Bacteria accession no. ESH97837), Citrobacter koseri (UniProtKB accession no. A0A0A5IUU2), Enterobacter sp. MGH 15 (RefSeq accession no. WP_032636571), Enterobacter cloacae (RefSeq accession no. WP_032671854), Escherichia vulneris NBRC 102420 (UniProtKB accession no. A0A090UX00), Pantoea sp. GM01 (UniProtKB accession no. J2L6Z7), Serratia grimesii (UniProtKB accession no. A0A084YWL3), Serratia marcescens BIDMC 80 (Ensembl Bacteria accession no. EZQ69436), Candidatus Sodalis pierantonio str. SOPE (UniProtKB accession no. W0HLH1), Yersinia kristensenii (UniProtKB accession no. A0A088L5A4), S. enterica subsp. enterica serovar Newport str. CVM 19470 (Ensembl Bacteria accession no. EJA85693), S. enterica subsp. enterica serovar Enteritidis str. 3402 (UniProtKB accession no. V7Y6W8), Citrobacter werkmanii NBRC 105721 (UniProtKB accession no. A0A090TWG5), Citrobacter freundii GTC 09629 (Ensembl Bacteria accession no. EOD57340), S. enterica subsp. enterica serovar Newport str. CVM 19443 (Ensembl Bacteria accession no. EJA65811), E. coli O127:H6 (strain E2348/69/EPEC) (UniProtKB accession no. B7UGT4), Klebsiella oxytoca (RefSeq accession no. WP_032745644), Enterobacter aerogenes (RefSeq accession no. WP_032715140), Klebsiella pneumoniae (EMBL CDS accession no. AHM80771), Cronobacter sakazakii CMCC 45402 (UniProtKB accession no. V5TYG0), Cronobacter malonaticus (RefSeq accession no. WP_032982558), Cronobacter turicensis 564 (UniProtKB accession no. K8BK39), and C. malonaticus (RefSeq accession no. WP_032983317). Multialignment of Ant (UniProtKB accession no. T1SA45) against Ant from Salmonella phage epsilon15 (UniProtKB accession no. Q858F6), Escherichia phage phiV10 (UniProtKB accession no. Q286Z4), Escherichia phage TL-2011b (UniProtKB accession no. G9L6E3), Salmonella phage SPN1S (UniProtKB accession no. H2D0F7), Salmonella phage SPN9TCW (UniProtKB accession no. M1EZ64), S. enterica subsp. enterica serovar Enteritidis str. 3402 (UniProtKB accession no. V7Y2G6), S. enterica subsp. enterica serovar Newport str. CVM 19470 (Ensembl Bacteria accession no. EJA85653), S. enterica subsp. enterica serovar Agona str. 632182-2 (Ensembl Bacteria accession no. ESH97805), C. freundii GTC 09479 (EMBL-WGS accession no. EMF20587), E. coli O127:H6 (UniProtKB accession no. B7UGQ3), C. malonaticus (RefSeq accession no. WP_032986301), E. vulneris NBRC 102420 (UniProtKB accession no. A0A090V1M3), K. pneumoniae subsp. pneumoniae KPNIH10 (UniProtKB accession no. A0A0E1DF28), C. sakazakii CMCC 45402 (UniProtKB accession no. V5U0K5), Enterobacter sp. MGH 15 (Ensembl Bacteria accession no. EUM54292), K. oxytoca (RefSeq accession no. WP_032745680), S. enterica subsp. enterica serovar Newport str. CVM 19443 (Ensembl Bacteria accession no. EJA65772), E. cloacae (RefSeq accession no. WP_032671830), C. koseri (UniProtKB accession no. A0A0A5IVX8), S. enterica subsp. enterica serovar Bareilly str. CFSAN000179 (Ensembl Bacteria accession no. KDQ92930), E. coli NA114 (RefSeq accession no. YP_006141911), E. coli 908519 (UniProtKB accession no. V0V944), E. coli UMEA 3290-1 (EMBL-WGS accession no. ESK17333), E. coli KTE235 (EMBL-WGS accession no. ELD77031), Y. kristensenii (UniProtKB accession no. A0A088L842), E. coli O7:K1 str. CE10 (RefSeq accession no. YP_006144928), E. aerogenes UCI 15 (RefSeq accession no. WP_032723151), C. malonaticus (RefSeq accession no. WP_032983289), C. turicensis 564 (UniProtKB accession no. K8BRJ5), E. coli O7:K1 (strain IAI39/ExPEC) (RefSeq accession no. YP_002408599), E. coli O1:K1/APEC (RefSeq accession no. YP_853609), C. werkmanii NBRC 105721 (UniProtKB accession no. A0A090TUF1), Pantoea sp. GM01 (UniProtKB accession no. J2LY07), S. marcescens BIDMC 80 (Ensembl Bacteria accession no. EZQ69401), and E. coli FCP1 (RefSeq accession no. WP_025651152). Secondary structure elements were assigned by PyMOL (The PyMOL Molecular Graphics System, www.pymol.org). Every tenth residue is marked by a black dot. Strictly 100% conserved residues are highlighted in red. Cylinders above the sequences denote α-helices. A dotted line denotes disordered regions.
Fig. S3.
Electron density from initial phasing and anomalous difference Fourier maps of the Rep–Ant complex containing selenium in the asymmetric unit. (A) Initial phased map (1.5 σ) by the SAD method. (B) A composite simulated annealed omit map (1.5 σ) for Rep92–198 showing electron density around the MDD and CAD of Rep92–198. (C) Anomalous difference Fourier maps in the asymmetric unit illustrating the positions of selenium atoms from the WT Rep–Ant complex are shown in mesh. |(Fo-Fc)| difference density is contoured at 4σ. Each chain is shown in a different color, and magnified views of two representative regions are shown.
Table S2.
Data collection and refinement statistics for anomalous difference Fourier map
| SeMet derivative | ||
| Crystal parameters | ||
| X-ray source | PAL-7A | PAL-7A |
| X-ray wavelength, Å | 0.97918 | 0.95003 |
| Space group | P32 | P32 |
| Unit cell parameters | ||
| a, b, c, Å | 86.7, 86.7, 332.5 | 87.2, 87.2, 333.6 |
| γ, degrees | 120.00 | 120.00 |
| Absorption (Se) | Peak | Remote |
| Resolution range, Å | 50.0–2.80 | 50.0–3.01 |
| Total/unique reflections | 360,327/151,683 | 259,107/55,406 |
| Completeness, % | 99.5 (100.0)* | 99.5 (100.0)† |
| Average I/σ, I | 23.6 (2.1)* | 24.2 (3.7)† |
| Rmerge‡, % | 11.9 (99.9)* | 10.7 (61.7)† |
Values in parentheses refer to the highest-resolution shell (2.85–2.80 Å).
Values in parentheses refer to the highest-resolution shell (3.06–3.01 Å).
Rmerge = ΣhklΣi | Ii(hkl) – <I(hkl)> |/ΣhklΣi Ii(hkl)i, where I(hkl) is the intensity of reflection hkl, Σhkl is the sum over all reflections, and Σi is the sum over i measurements of reflection hkl.
The asymmetric unit of the crystal contains two octamers of Rep–Ant complexes, which have a 4:4 stoichiometry with two Rep dimers and one Ant tetramer and an overall dimension of 100 × 120 × 60 Å (Fig. 2). The overall structures of the two octamers are similar to each other (Fig. S3C). Approximately 60% of the nonhydrogen atoms in the interface between Ant and the N-terminal domain of Rep are polar, as indicated by proximal isovelocity surface area (PISA) calculations (12), implying that the interaction is mainly hydrophilic. Thus, it is possible that the high salt concentration (2.8 M NaCl) in the crystallization solution destabilized the hydrophilic interactions, whereas the other four N-terminal domains of Rep remained bound to Ant with the help of crystal contacts with neighboring subunits (Fig. 2 and Fig. S3C).
Domain Architecture of Rep and Ant.
Rep consists of three distinct domains: the N-terminal DNA-binding domain (NDD, residues 1–83), the middle dimerization domain (MDD, residues 84–160), and the C-terminal Ant-binding domain (CAD, residues 161–198), with a linker connecting the NDD and MDD domains. However, no possible domain was predicted in Ant (Fig. 2C). A search for overall structural similarities with full-length Rep using the program DALI (13) failed to reveal any significant matches. Therefore, we performed structural similarity searches with each individual domain (NDD, MDD, and CAD). NDD consists of six α-helices (α1–α6), which form a compact bundle with a hydrophobic core. Helices 2 and 3 form a helix-turn-helix motif (Fig. 2C). The highest Z score for NDD was obtained with the Neisseria meningitidis DMP19 protein [Protein Data Bank (PDB) ID code 3VK0; rmsd of 2.0 Å for 74 equivalent Cα positions, Z score of 10.6, and sequence identity of 11%]. MDD consists of four α-helices (α7–α10) and resembles NDD (Fig. 2C) (14). When the MDD was superimposed on the NDD, the rmsd was 1.6 Å for 45 Cα atoms, suggesting that the overall folds of the NDD and MDD are similar despite the observed deviations in several loops (Fig. 2D). In contrast to the NDD, which contains several conserved positively charged residues, the MDD contains only one conserved positively charged residue (Arg129), suggesting that the MDD might serve as a dimerization domain without DNA-binding activity. The corresponding domain of the CI repressor is responsible for its autocleavage activity (15). The CAD forms an antiparallel coiled coil with two α12 helices (Fig. 2). Ant consists of four α-helix bundles that form a cylinder that is ∼100 Å long and ∼20 Å in diameter (Fig. 2). Overall, the structural features of the Rep–Ant complex described here are different from the structural features of other known Rep–Ant complexes (2, 16).
Despite the overall structural similarity between each MDD and CAD domain in the Rep–Ant complex, the overall geometry of each Rep monomer, which also involves the orientation of the domains relative to each other, was distinct (Fig. 2E). The observed structural heterogeneity was a consequence of different conformations adopted by the linkers between the MDD and the CAD. We considered the implications of the asymmetric homodimeric structure of Rep on Ant binding. Interestingly, the asymmetric structure of the MDD and the CAD assists in correctly docking two NDDs to Ant (Fig. 2); otherwise, the tilted interface that normally occurs between the CAD and Ant blocks the placement of NDDs on Ant. Indeed, the distance from the C terminus to the N terminus of the NDD was similar in each Rep monomer in the dimer (∼35 Å between Leu67 and Ala96 of Rep) (Fig. 2).
Quaternary Structure of Rep, Ant, and the Rep–Ant Complex in Solution.
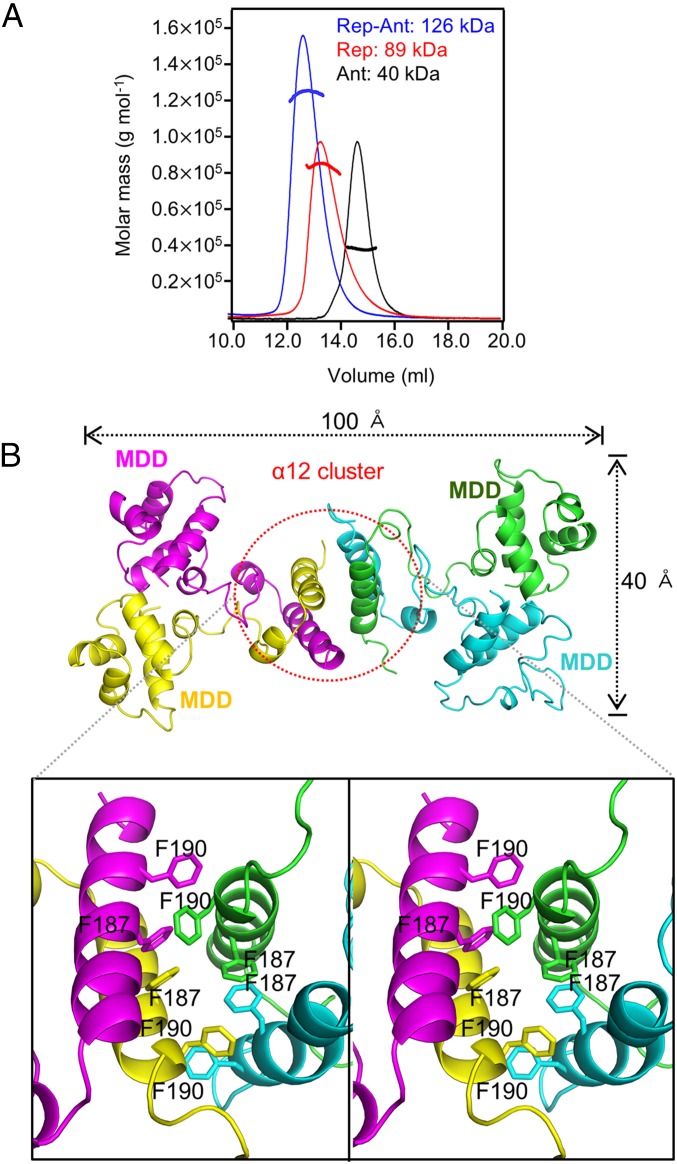
The functional oligomeric state of the Rep–Ant complex in solution was characterized to determine whether the octameric state observed in the crystal is an artifact of crystallization. To analyze the oligomeric states of Rep and Ant in solution, we measured the molecular weight of Rep, Ant, and the Rep–Ant complex using size-exclusion chromatography (SEC) with multiangle light scattering (MALS). The molecular mass of 126 kDa measured for the Rep–Ant complex is consistent with a 4:4 complex in solution, although the molecular mass determined by SEC-MALS was slightly smaller than its theoretical molecular mass (132.6 kDa) (Fig. 3A). The molecular masses of Rep and Ant were 89 and 40 kDa, respectively (Fig. 3A), close to the theoretical molecular mass of tetrameric Rep (91 kDa) and tetrameric Ant (44 kDa) in solution. It was surprising that Rep itself formed a tetramer in solution, because two dimers bind to Ant independently in the Rep–Ant complex. The tetrameric Rep was noncanonical, because canonical Reps usually exist as a dimer.
Fig. 3.
Quaternary structure of Rep, Ant, and the Rep–Ant complex and the solution structure of the Rep92–198 tetramer. (A) Rep (red line), Ant (black line), and the Rep–Ant complex (blue line) were analyzed by SEC-MALS. The dotted line represents the measured molecular mass. (B) Overall crystal structure of the Rep92–198 tetramer and magnified stereo view showing details of the interaction at the interface of two Rep92–198 dimers. Each chain is shown in a different color.
Crystal Structure of the Rep Tetramer.
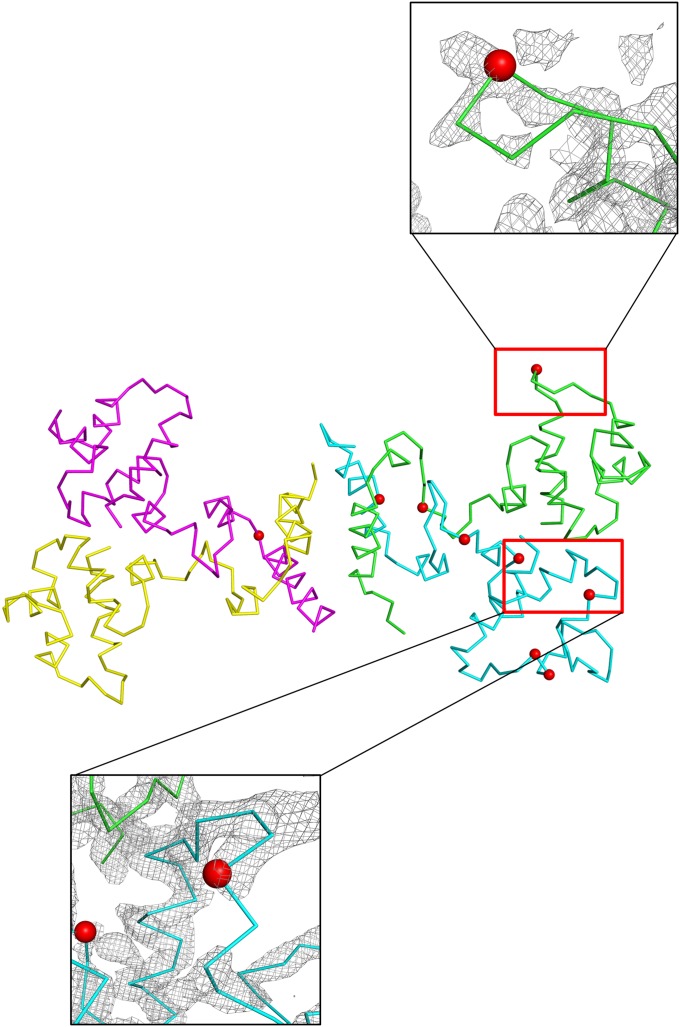
To gain further insight into the structural organization of the Rep tetramer and its repression activity, we solved the crystal structure of the Rep92–198 tetramer without Ant at 3.0-Å resolution (Fig. 3B). The NDD of Rep was removed to facilitate the crystallization of the Rep tetramer because the NDD and MDD are connected by a flexible loop. The asymmetric unit of the crystal contains eight tetramers of Rep92–198, and the Rep92–198 tetramer has an elongated structure with overall dimensions of 40 × 40 × 100 Å (Fig. 3B). The number of Ramachandran outliers (2.65%) was greater than expected because of the flexibility of the Rep protein (Table S1). The outlier residues are located in regions of fairly poor density (Fig. S4). Each monomer of Rep92–198 adopts a slightly different conformation because of the flexible linker between the MDD and the CAD. When monomer A was superimposed on the other 31 monomers, the average rmsd was 1.32 Å for the 80 Cα atom pairs. It is tempting to speculate that this flexibility might be functionally important for the DNA-binding activity of Rep.
Fig. S4.
Disallowed regions of the Rep92–198 tetramer structure. |(2Fo-Fc)| difference density (1.5 σ) around the positions of disallowed residues (red balls). Each chain is shown in a different color, and magnified views of two representative regions are shown.
Surprisingly, the C-terminal helix, α12 of the CAD, which also is involved in Ant recognition, plays a crucial role in Rep tetramerization (Fig. 3B). Phe187 and Phe190 form a compact bundle with a hydrophobic core at the interface (Fig. 3B), which is involved in Rep tetramerization. The phenyl ring of Phe187 makes π–π stacking interactions with that of the neighboring Phe187 (Fig. 3B).
Concentration-Dependent Higher-Order Assembly of Rep.
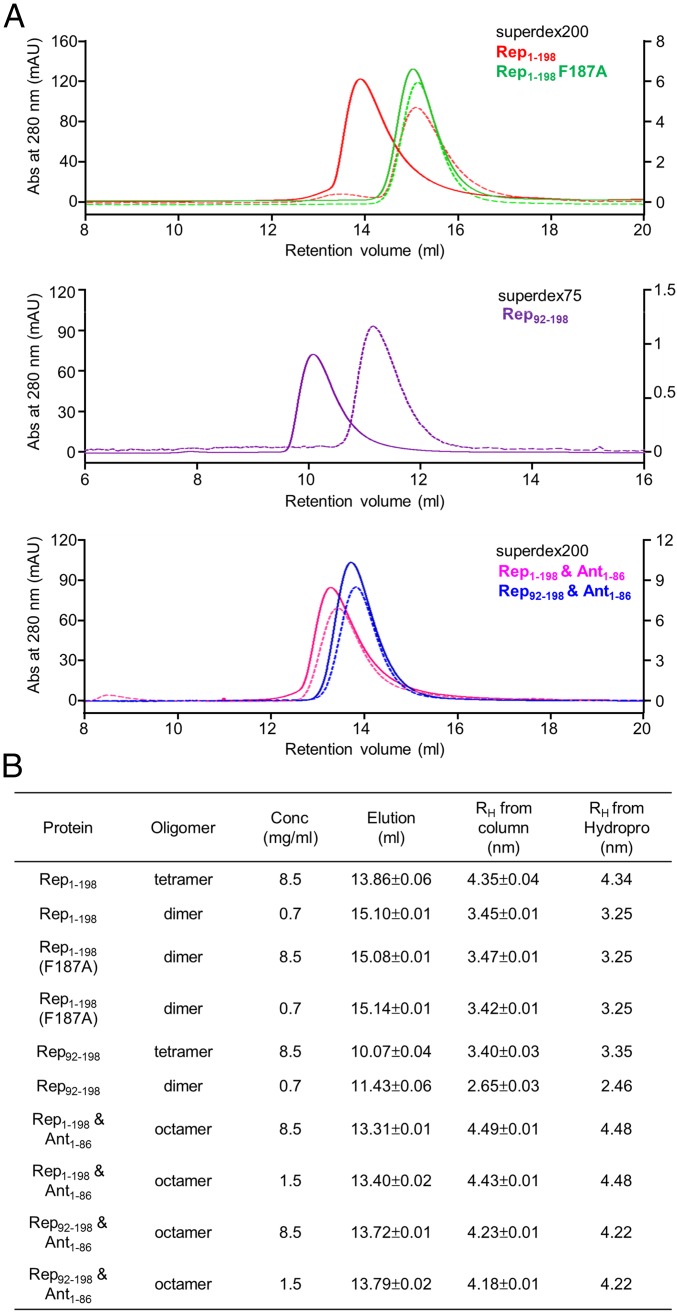
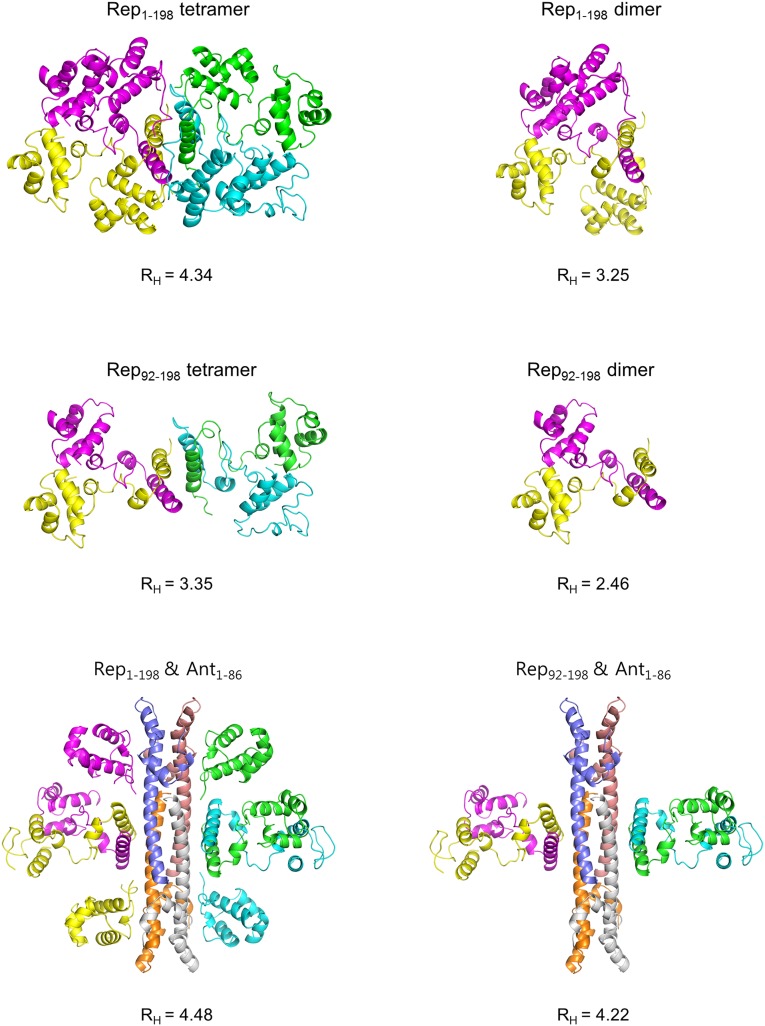
We next hypothesized that the oligomeric state of Rep in solution may depend on the concentration. To analyze the concentration-dependent quaternary structure of Rep in solution, analytical gel filtration was performed using a Superdex 75 or 200 (10/300 GL) column (Fig. 4), and the apparent RH (Stokes radius) from analytical gel filtration was compared with the RH calculated from structure models (Fig. S5). For the Rep92–198 tetramer (or dimer), Rep1–198/Ant1–86 complex, and Rep92–198/Ant1–86 complex, structure models for RH calculation were generated based on the crystal structures of the Rep1–198/Ant1–86 complex and Rep92–198 tetramer (Fig. S5). The two invisible NDDs of the Rep1–198/Ant1–86 complex (yellow and cyan in Fig. 2) were incorporated by superimposing visible NDDs (magenta and green in Fig. 2). The Rep1–198 dimer (or Rep1–198 F187A) model was obtained from the Rep1–198/Ant1–86 complex without modifying the NDD positions. To obtain an overall model of the full-length Rep tetramer, we positioned the NDDs based on the RH values from SEC experiments with the knowledge that the NDDs and MDDs are connected by a flexible linker (residues 77–89). The NDD positions were adjusted until the calculated RH agreed with the experimental values to within 0.1 nm. Relatively good agreement between the calculated and experimental RH values was obtained when the NDD was positioned by superimposing full-length Rep on the Rep92–198 tetramer (Fig. 4 and Fig. S5).
Fig. 4.
Concentration-dependent oligomerization of Rep1–198 and Rep92–198. (A) Analytical gel filtration profiles of Rep1–198 (red), the Rep1–198 F187A mutant (green), Rep92–198 (purple), the Rep1–198/Ant1–86 complex (pink), and the Rep92–198/Ant1–86 complex (blue) at high (8.5 mg/mL, solid lines and left y axis) and low (0.7 mg/mL, dotted lines and right y axis) concentrations. (B) Summary of the hydrodynamic analysis in Fig. 4A. RH from Hydropro, Stokes radii calculated from structure models (Fig. S5).
Fig. S5.
Structure models and theoretical RH values. Structure models for RH calculation were generated based on the crystal structures of the Rep1–198/Ant1–86 complex and the Rep92–198 tetramer and were used for comparison with those of analytical gel filtration (Fig. 4B). The two invisible NDDs of the Rep1–198/Ant1–86 complex were incorporated by superimposing visible NDDs. The Rep1–198 dimer model was obtained from the Rep1–198/Ant1–86 complex without modifying the NDD positions. To obtain the overall model of the full-length Rep tetramer, NDDs were positioned by superimposing full-length Rep on the Rep92–198 tetramer.
For a concentration of 9 μM, the apparent RH (3.45 nm) was closer to the theoretical RH of a Rep dimer (3.25 nm), whereas for a concentration of 93 μM, the apparent RH of Rep (4.35 nm) was closer to that of a tetramer (4.34 nm) (Fig. 4). Because the CAD is responsible for the assembly of the Rep tetramer, we hypothesized that Rep92–198, which lacks the NDD, also might show concentration-dependent dimer–tetramer exchange. Indeed, for a concentration of 18 μM, the apparent RH (2.65 nm) was closer to the theoretical RH of a Rep92–198 dimer (2.46 nm), whereas for a concentration of 186 μM, the apparent RH of Rep92–198 (3.40 nm) was closer to that of a tetramer (3.35 nm) (Fig. 4). We also hypothesized that the Rep1–198 F187A mutant might exist as a dimer regardless of its concentration because Phe187 is a crucial residue for the assembly of the Rep1–198 tetramer. As expected, the Rep1–198 F187A mutant assembled only into dimers at both high and low concentrations (Fig. 4).
Bimodal Binding Between Rep and Ant.
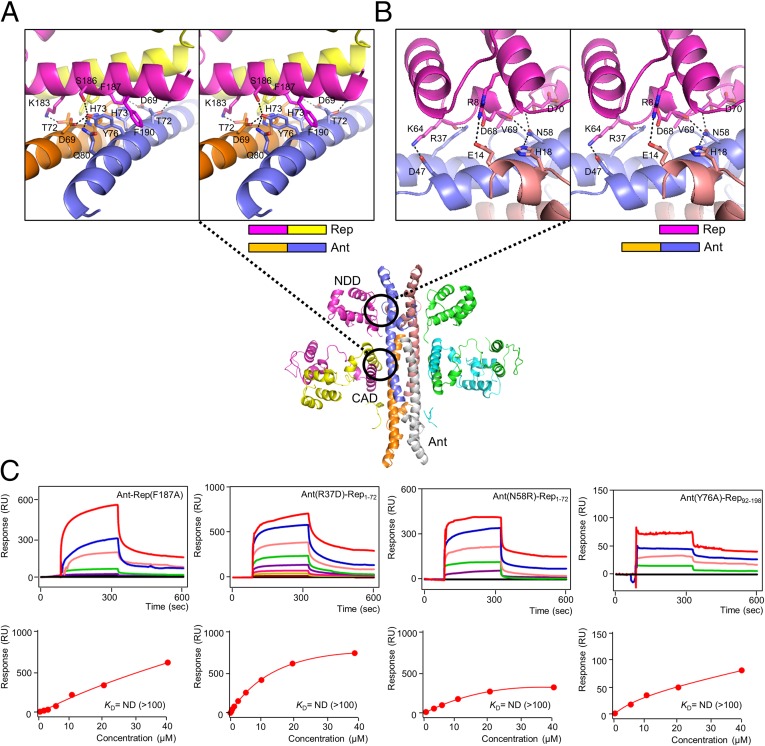
The bimodal binding between the Rep NDD or CAD and Ant is different from that in other Rep/Ant systems studied to date. Calculation of the buried surface area of each potential interaction surface between Rep and Ant with PISA (12) revealed two extensively buried surface regions (Fig. 5 A and B). The two crystallographic binding sites between Rep and Ant were assessed by mutations of interfacial residues, and their binding affinities were measured using surface plasmon resonance (SPR) to quantify the contributions of each residue. The smaller of the two interfaces (∼660 Å2) between Ant and the CAD buries several hydrophobic residues (Phe187 and Phe190 of Rep) against the His73 and Tyr76 of Ant (Fig. 5A). The oxygen atom of Ant Thr72 forms a hydrogen bond with a nitrogen atom of Lys183 (2.4 Å), whereas the oxygen atom of Ant Tyr76 makes hydrogen bonds with the OD2 and OG atoms of Ant Asp69 and Rep Ser186 (both 2.7 Å), respectively (Fig. 5A). Indeed, mutating Phe187 and Tyr76 to Ala significantly reduced the binding (Kd >100 μM), demonstrating the crucial contributions of the hydrophobic core to the binding between Ant and the CAD (Fig. 5C).
Fig. 5.
Molecular interactions of the Rep–Ant complex in detail. (A and B) Magnified stereo views showing detailed interactions at the Ant–Rep interfaces (the CAD and the NDD, respectively). (C) SPR sensorgrams of mutants of the Rep–Ant complex (Rep F187A, Ant R37D, Ant N58R, and Ant Y76A, respectively).
The larger of the two interfaces (∼770 Å2) between Ant and the NDD buries several hydrophilic residues (Glu14, Arg37, Asp47, and Asn58) of Ant against the NDD (Fig. 5B). The Ant Arg37 contributes to binding by forming a hydrogen bond with the carbonyl oxygen atom of Rep Lys64 (2.7 Å), whereas Ant Asp47 forms a salt bridge with Rep Lys64 (2.9 Å) (Fig. 5B). Mutation of Arg37 to Asp significantly reduced the binding interaction (Kd >100 μM) (Fig. 5C). Ant Glu14 and Asn58 make extensive contacts with the Rep. The ND2 and OD1 atoms of Ant Asn58 form hydrogen bonds with the carbonyl oxygen atom of Rep Asp68 and the backbone nitrogen atom of Rep Asp70 (both 3.2 Å). The ND2 atom of Ant Asn58 also makes a hydrogen bond with the NE2 atom of the neighboring Ant His18 (3.3 Å) (Fig. 5B). Mutation of Ant Asn58 to Arg also abolished the binding (Kd >100 μM) (Fig. 5C). These results validate the crystallographic observations of the interfaces between Rep and Ant in the Rep–Ant complex.
DNA-Binding Activity of Rep.
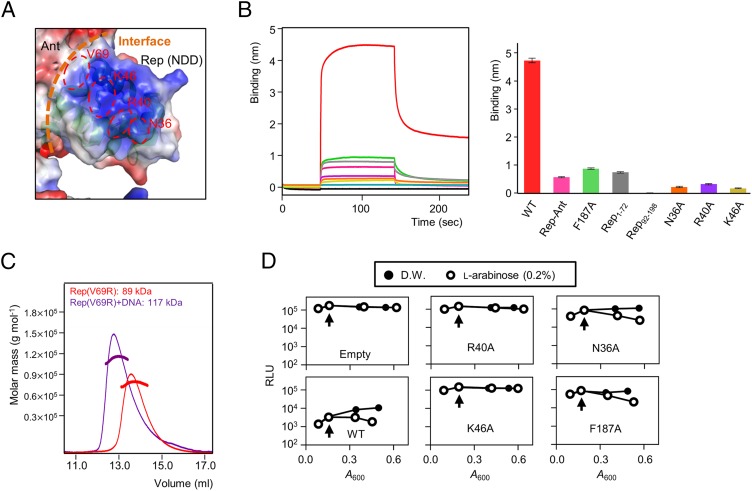
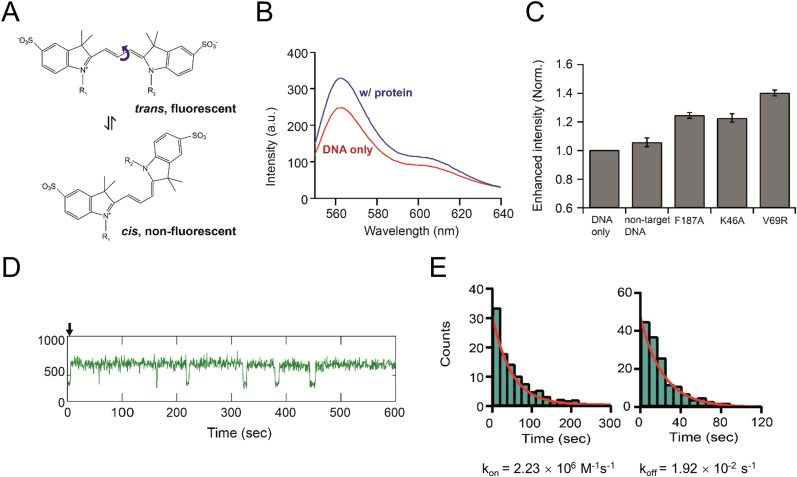
Given that results from DALI indicated that the Rep NDD resembles the DNA-binding domain of other Reps, which are characterized by a positive surface electrostatic potential (Fig. 6A), we tested its ability to bind to DNA in BLI experiments. When Rep was purified without Ant, it was stable only at a high salt concentration (>300 mM NaCl), which is not suitable for DNA-binding assays. Thus, we attempted to make a stable Rep mutant that would exhibit the same DNA-binding ability as WT Rep. We mutated several surface-exposed hydrophobic residues on the NDD (F65N, V69R, and L73R); Rep V69R was selected as a stable Rep mutant for the DNA-binding assay because it was stable at a low salt concentration (<100 mM NaCl). A protein-induced fluorescence enhancement (PIFE) experiment indicated that the Rep V69R mutant does indeed bind strongly to DNA (Table S3) with a Kd of ∼8.6 nM (Fig. S6); this finding indicated that the V69R mutation does not affect the DNA-binding ability of Rep.
Fig. 6.
Functional analysis of the NDD and DNA-binding model of the Rep tetramer. (A) Electrostatic potential at the molecular surface of the Rep–Ant complex. Three key residues (Asn36, Arg40, and Lys46) are shown in red, and the interface between the NDD and Ant is shown with orange dashed lines. (B, Right) Comparisons of the DNA binding of various Rep proteins by BLI. (Left) Representative BLI sensorgrams of Rep1–198 (red), Rep–Ant complex (pink), Rep1–198 F187A (green), Rep1–72 (gray), Rep92–198 (light blue), and Rep1–198 mutants (N36A in orange, R40A in purple, and K46A in light yellow). Each experiment was repeated three times. (C) The Rep V69R proteins with (purple line) and without (red line) DNA were analyzed by SEC-MALS. The dotted line represents the measured molecular mass. (D) Dual-plasmid bioluminescence reporter assay with WT and mutant Rep. Vertical arrows indicate arabinose induction. Results are representative of three independent experiments. D.W., distilled water; Empty, empty vector (pBAD24); RLU, relative light units.
Table S3.
Phage DNA sequences used for assays in this study
| DNA no. | Sequences | Purpose |
| 1 | 5′-TAAGATGTGAGTCCTCCACCAGGGACCTAACGCCTACCGGCGTGTGTATTCTTTCTTCAAATCCTTCTTCCAGCGGATGGTGATACTGCCGTTGCATCTCTTCTTCTCCATGCAAACACTGTATAAACATACAGTAACAGAAGATATCATGACTATCCAGCATGGAATGCAAATTACCTGTAAGGTAATAAAGCAACTGATTAATACCTAAACGATTCATATAAGGTTTTTTGGGTAATAGAATGATCCAGAGTGCATGCGCGCCGGGCGCATAAGCAACCTGGAGATACTTACATGACGGTCTCAACTGAAG-3′ | EMSA |
| 2 | 5′-GAAATCCCGGAGAATGATTTCGTTAAGGTTTTTGCGTCTTATGTCATAAATACTTTTCATAGCTATTGTATTTGCCCATTTATTATTACCTAACACTCTAAATTTAAATGAATATTACCATAAAGGTAAAATTACCATAATGGTAATAATCATTGATTTTTTCACCAAAAAGGTAATAATTCAGATATGAATAGACAGGCTGAGATAAGCAAAATATGAGTGACGAAAAAAAATTTGATTTCAAAAAGCACTGGCTGGGGCTGTCTCCTGATGAGCGTGAAGCATTTGCAGTTGAAGCCG-3′ | BLI |
| 3 | 5′-AAATTACCTGTAAGGTAATA-3′ | MALS |
| 4 | 5′-GAA TCG TTT AGG TAT TAA TCA GTT GCT TTA TTA CCT TAC AGG TAA TT/Cy3dT/ GCA TTC CAT GCT GGA TAG TCA TGA TAT C-3′ | PIFE |
The Rep recognition sites are underlined and in boldface. Cy3-labeled oligo(dT) are denoted as boldface Cy3dT.
Fig. S6.
Kinetics of Rep mutants on target DNA measured using a single-molecule PIFE assay. (A) Structures of Cy3 dye undergoing cis–trans isomerization. Changes in the external environmental, such as the approach of proteins or an increase in solvent viscosity, can hinder the isomer conversion from the trans (fluorescent) state (Upper) to the cis (nonfluorescent) state (Lower), resulting in an increase in fluorescence intensity. (B) Fluorescence spectra of Cy3 on 50 nM target DNA (Table S3) in the absence (red) and presence (blue) of the Rep V69R mutant (500 nM). (C) Relative enhancement in the fluorescence intensity with various Rep mutants. The enhanced intensity was calculated as the ratio of the total integrated intensity of each spectrum. (D) Representative single-molecule time trajectory of Cy3 upon the injection of the V69R mutant (20 nM). The Rep-bound state of the target DNA (on-state) shows a higher level of fluorescence emission from Cy3, whereas the lower level of emission represents free DNA without Rep binding (off-state). The black arrow indicates the time when Rep mutants were injected into a flow chamber. (E) Histograms for the dwell time of the Rep on-state (Left) and Rep off-state (Right), with single exponential fits (red curves).
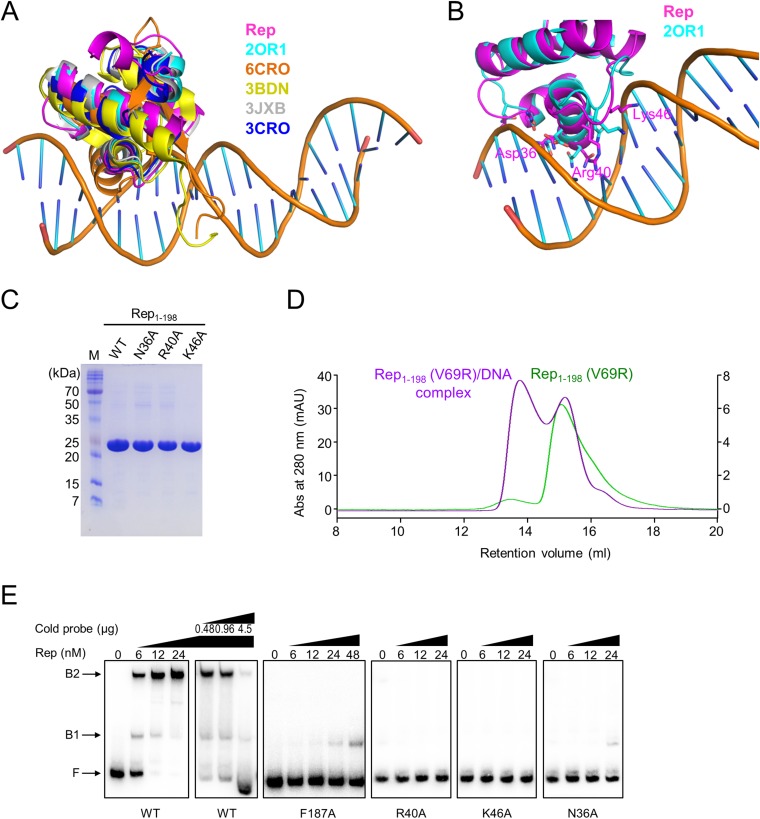
When Rep1–72 was superimposed on other structures of Rep–DNA complexes (PDB ID codes 2OR1, 6CRO, 3CRO, 3BDN, and 3JXB) (Fig. S7 A and B) (17–21), the Asp36, Arg40, and Lys46 in Rep corresponded to Gln29, Gln33, and Lys38, respectively, in the repressor of phage 434 (PDB ID code 2OR1) (17). These residues play a critical role in DNA binding. Thus, we hypothesized that these residues might be involved in DNA binding and examined the DNA-binding properties of WT and mutant Rep in BLI experiments. A DNA fragment containing one Rep-binding site (ATTACCataatGGTAAT; conserved sequences are in capital letters) was PCR amplified using the SPC32H genome as a template, and the resultant PCR product was biotinylated and bound to the surface of an AR2G biosensor chip through a biotin–streptavidin interaction (Table S3). WT Rep exhibited robust DNA-binding activity, whereas Rep92–198, which has no NDD, did not bind to DNA (Fig. 6B). The Rep–Ant complex also showed almost no binding to DNA (Fig. 6B). The putative DNA-binding residues of Rep1–198 (Asn36, Arg40, and Lys46) were assessed by mutations (Fig. 6B). As hypothesized, mutations at the putative DNA-binding residues of Rep1–198 (Asn36, Arg40, and Lys46) significantly reduced the DNA binding relative to that of WT Rep (Fig. 6B and Fig. S7C). The F187A mutant of Rep, which disrupts the CAD interactions, also showed significantly reduced binding to DNA relative to that of WT Rep (Fig. 6B), suggesting that the tetramer structure of Rep is essential for DNA binding.
Fig. S7.
Comparison of the structure of the Rep NDD with that of other Rep–DNA complexes. (A) The superimposition of the Rep NDD with other N-terminal domains of repressors in complex with DNA. The Rep NDD is superimposed on other Reps derived from phages: Rep from SPC32H (pink), CI from phage 434 (cyan), Cro from phage lambda (orange), CI from phage lambda (yellow), C2 from phage P22 (gray), and Cro from phage 434 (blue). The DNA was derived from PDB ID code 2OR1. (B) The superimposition of the Rep NDD (pink) with CI from phage 434 (cyan) showing critical residues for DNA binding. (C) SDS/PAGE of WT and mutant proteins of Rep (N36A, R40A, and K46A) used in this study. (D) Analytical gel filtration profiles of Rep1–198 V69R mutant (5.5 μM) with (purple line and right y axis) and without (green line and left y axis) DNA. (E) Evaluation of DNA binding for WT and mutant Reps by EMSA. Increasing amounts (0, 6, 12, and 24 nM) of the indicated proteins were incubated with a radiolabeled hot probe and then were subjected to EMSA (details are given in SI Materials and Methods). An unlabeled cold probe (0.48, 0.96, and 4.5 μg) was also added to the indicated WT protein lanes. B1, fragments retarded by dimerized Rep; B2, fragments retarded by tetramerized Rep; F, unbound fragments. Increasing amounts of indicated Rep mutants (F187A, R40A, K46A, and N36A) were also incubated with a radiolabeled hot probe and then subjected to EMSA.
We next speculated that the presence of a specific Rep-binding DNA might facilitate the formation of the Rep tetramer rather than the dimer, even with a lower concentration of Rep because the physiological concentration of Rep should be low. To evaluate this possibility, analytical gel filtration was performed to determine whether a Rep tetramer at a low salt concentration (100 mM NaCl) is formed in the presence of DNA. As hypothesized and in contrast to WT Rep, tetrameric Rep was observed in the presence of DNA when an equal amount of Rep was added (Fig. S7D). We also examined the DNA-binding properties of WT Rep and Rep mutants in an EMSA, which showed essentially the same results as the BLI experiments (Fig. S7 C and E; details in SI Text).
Noncanonical DNA-Binding Model of Rep.
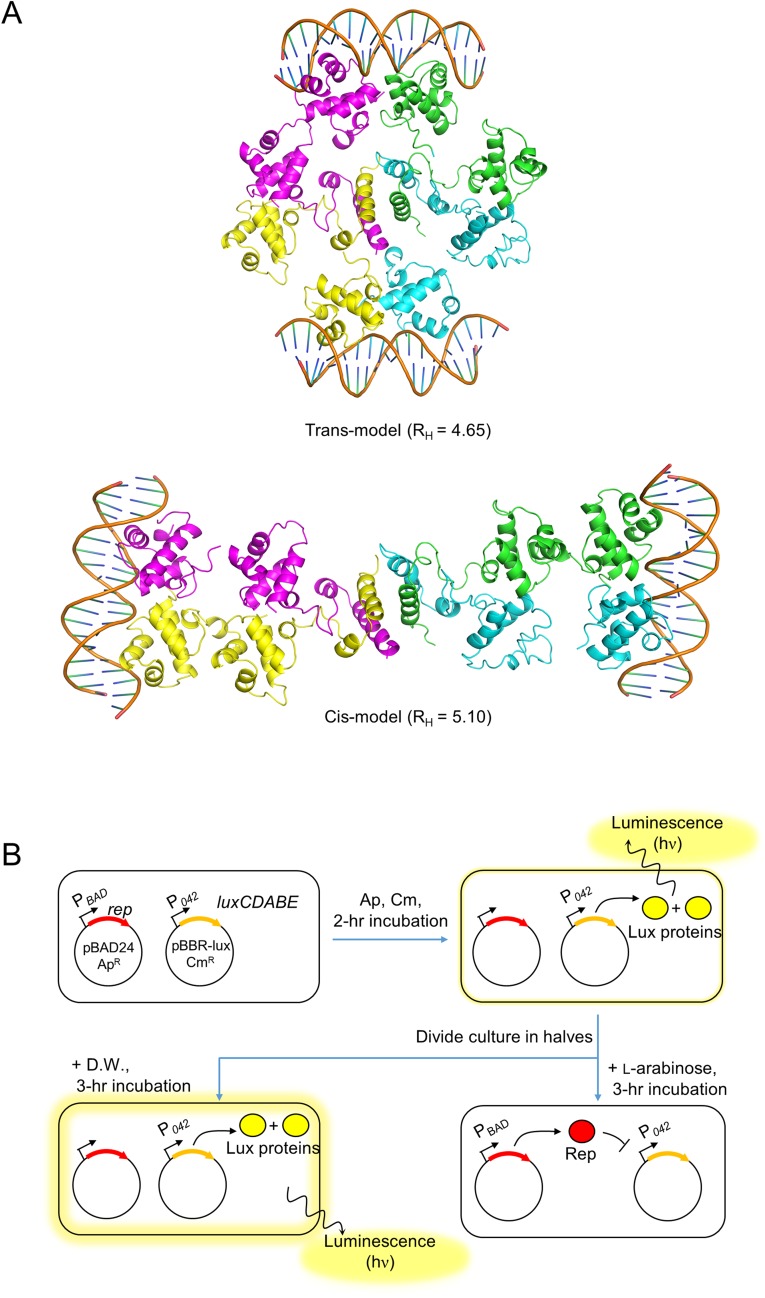
Because we showed that Rep tetramerization is essential for DNA binding, we considered whether the two NDDs originate from the same Rep dimer (the cis model) or the two different Rep dimers (the trans model) (Fig. S8A). The cis model is more common in canonical DNA binding proteins. In this case, it was expected that two NDDs from the same dimeric unit would form a dimer upon binding to DNA. However, BLI experiments using Rep indicated that the Rep F187A mutant, which behaves as a dimer at both high and low concentrations, bound to DNA only weakly, even at high concentrations (Fig. 6B). Based on this observation, we hypothesized that the trans model might be correct; in this model, the dimer pairs for DNA binding originate from different dimers of the Rep tetramer (Fig. S8A). Because the crystal structure of Rep92–198 indicated that the CAD serves as a binding interface between two Rep dimers in a Rep tetramer, we expected that the oligomeric assembly of the Rep tetramer would allow it to bind to two DNAs. Indeed, SEC-MALS experiments of Rep in complex with DNA indicated a molecular mass of 117 kDa for the complex, consistent with a 4:2 Rep:DNA stoichiometry (116 kDa) in solution (Fig. 6C).
Fig. S8.
cis and trans models of the Rep–DNA complex and schematic of the in vivo evaluation of Rep repression by dual-plasmid bioluminescence reporter assays. (A) Ribbon diagrams of cis and trans models of the Rep–DNA complex. (B) Schematic of dual-plasmid bioluminescence reporter assays (details are given in SI Materials and Methods). The repression function of Rep and its derivatives was evaluated by measuring the cellular bioluminescence and A600.
Further support for the trans model is presented by comparing the Stokes radius of the experimental value of the Rep–DNA complex (4.50 nm) with that of the cis or trans model. To build the cis or trans models, NDD dimers were generated by superimposing Rep NDDs with the CI repressor (15). The modeled NDD–DNA complex was generated by superimposing Rep NDDs onto the DNA-bound structure of a Rep from phage 434 (17). Subsequently, the tetrameric structure of Rep92–198 was combined with the modeled NDD–DNA complex (Fig. S8A). The RH values from the cis and trans models were 5.10 and 4.65 nm, respectively. Thus, the experimental value (4.50 nm) was closer to that of the trans model, indicating that the trans model is the more likely one.
Mutational Analysis of the in Vivo Repressor Activity.
To evaluate the residues that were predicted to be involved in DNA binding in vivo, we designed site-directed mutants of Rep and evaluated their repression function in a dual-plasmid bioluminescence reporter assay (Table S4) (11). Salmonella cells harboring both a reporter plasmid that contained a luciferase reporter gene fused to the Rep-binding SPC32H_042 promoter (P042) and an expression plasmid that expressed WT or mutant Rep proteins under an arabinose-inducible promoter were incubated in the presence or absence of arabinose (Fig. S8B).
Table S4.
Plasmids used for assays in this study
| Plasmids | Relevant characteristics | Reference or source |
| Gene overexpression | ||
| pBAD24 | General expression vector with the PBAD promoter; ApR | 36 |
| prep | pBAD24-rep; ApR | 11 |
| prep-R40A | prep with rep R40A; ApR | This study |
| prep-K46A | prep with rep K46A; ApR | This study |
| prep-N36A | prep with rep N36A; ApR | This study |
| pant | pBAD24-ant; ApR | This study |
| pant-Y76A | pant with ant Y76A; ApR | This study |
| pant-T72A | pant with ant T72A; ApR | This study |
| pant-T72K | pant with ant T72K; ApR | This study |
| pant-H73A | pant with ant H73A; ApR | This study |
| pant-N58R | pant with ant N58R; ApR | This study |
| pant-E10R | pant with ant E10R; ApR | This study |
| pant-D47R | pant with ant D47R; ApR | This study |
| pant-R37D | pant with ant R37D; ApR | This study |
| Dual-plasmid luminescence reporter assay | ||
| pBBR-lux | A derivative of broad-host-range cloning vector pBBR1MCS containing a promoterless luxCDABE; CmR | 31 |
| pP042::lux | pBBR-lux with SPC32H_042 promoter of SPC32H; CmR | This study |
ApR, ampicillin-resistant; CmR, chloramphenicol-resistant.
Cells that expressed WT Rep after arabinose induction exhibited decreased luciferase activity (Fig. 6D) because of Rep’s function as a repressor. However, when the R40A and K46A mutants of Rep were expressed after arabinose addition, the luciferase activity in these cells was similar to that in cells harboring an empty expression plasmid, pBAD24, indicating the inability of these mutants to repress the transcription from P042 (Fig. 6D). Although the N36A mutant also resulted in decreased luciferase activity, its activity was more than 10-fold lower than that of WT Rep, regardless of the degree of arabinose induction (Fig. 6D); this finding indicated that the N36A mutant was less efficient than WT Rep in repressing transcription from P042. The F187A mutant, which bound to DNA only weakly, also resulted in decreased luciferase activity, supporting the notion that the trans model is the more likely one (Fig. 6D). Taken together, these results suggest that critical residues, including Arg40, Lys46, and Asn36, in the DNA-binding region of Rep are important for its repression activity.
Rep–Ant Interactions Are Required to Switch to the Lytic Cycle.
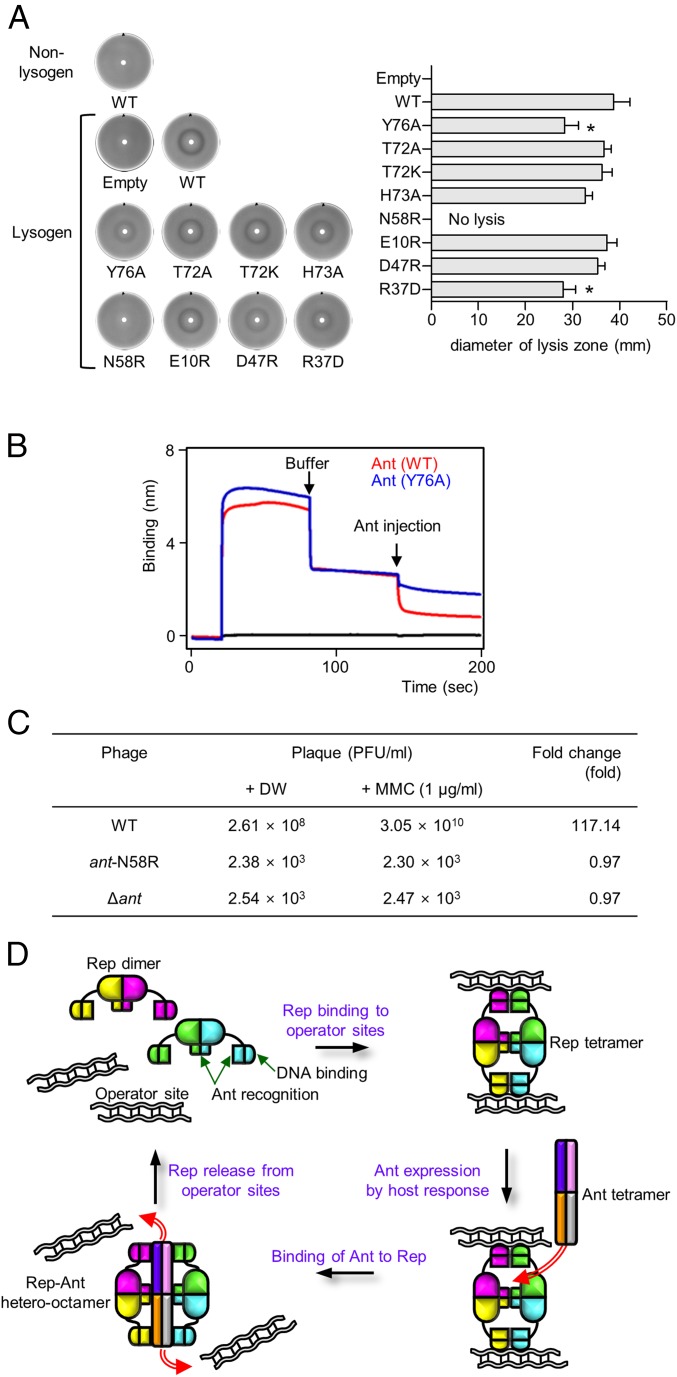
Having established the presence of two binding sites between Rep and Ant in vitro, we examined the effect of disrupting both binding sites in Salmonella cells lysogenized by phage SPC32H (Table S5). From the structure of the Rep–Ant complex, we observed that Thr72, His73, and Tyr76 in Ant interact with the CAD, whereas Glu10, Arg37, Asp47, and Asn58 in Ant interact with the NDD. To evaluate the contributions of these residues to Rep–Ant complex formation, the effect of mutating these residues on the antirepression function of Ant were tested using a disk diffusion assay (Fig. 7A). Plasmids that expressed WT or mutant Ant proteins under an arabinose-inducible promoter were transformed into Salmonella cells lysogenized by phage SPC32H, and the transformed cells were incubated as a bacterial lawn on Luria–Bertani (LB) plates with an arabinose-soaked filter disk. In this assay, WT Ant sequestered the cognate repressor from the operators and induced prophage SPC32H from the host Salmonella, resulting in the formation of a bacterial lysis zone (Fig. 7A). Compared with WT Ant, the Y76A mutation caused a significant reduction in the size of the bacterial lysis zone; the T72A, T72K, and H73A mutations had no effect (Fig. 7A), suggesting that the Tyr76 residue is important for the antirepression function of Ant. We also conducted in vitro reconstitution experiments using BLI to determine the importance of Rep Tyr76 in recruiting Ant. Indeed, although WT Ant was able to remove bound Rep from DNA-immobilized sensor chips, the Ant Y76A mutant, in which the interaction between the CAD and Ant is perturbed, exhibited significantly reduced activity (Fig. 7B). Although the size of the lysis zone was not significantly affected, the H73A mutant resulted in a more turbid lysis zone than did WT Ant (Fig. 7A), indicating its possible involvement in normal Ant functions.
Table S5.
Bacterial strains of Salmonella enterica serovar Typhimurium used in this study
| Strains | Relevant characteristics | Reference or source |
| LT2(c) | Prophage cured strain LT2; WT; host for phage SPC32H and its derivatives | 32 |
| SR5003 | LT2(c) with ΔLT2gtrABC1 | 33 |
| SR5100 | ΔLT2gtrABC1 (32H); SR5003 lysogenized by SPC32H | 11 |
| SR5140 | ΔLT2gtrABC1 (32H Δant); SR5003 lysogenized by SPC32H Δant | 11 |
| SR5275 | ΔLT2gtrABC1 (32H ant-N58R); SR5003 lysogenized by SPC32H ant-N58R | This study |
Fig. 7.
Lytic switch by the Rep–Ant interaction and the overall model. (A) Evaluation of the antirepression function of WT and mutant Ants by a disk diffusion assay (details are given in SI Materials and Methods). The turbidity (Left) and the diameter (Right) of the bacterial lysis zones generated by Ant-mediated prophage induction were compared. Averages and SD from three independent experiments are shown. *P < 0.05. (B) The DNA-stripping activities of WT Ant (red) and the Y76A mutant (blue). Buffer and Ant (WT or the Y76A mutant) were injected as indicated by the arrows. (C) Comparison of the prophage induction rates in Salmonella cells lysogenized by each indicated phage. MMC, mitomycin C. (D) Overall model of noncanonical DNA recognition by Rep and the mechanism of its inactivation by Ant. Each chain is drawn in a different color.
The size of the bacterial lysis zone also was significantly reduced for the N58R and R37D mutants, which were predicted to interact with the NDD of Rep (Fig. 7A). Noticeably, Salmonella cells that expressed the N58R mutant were not lysed at all in the arabinose disk, nor were nonlysogenic control cells that expressed WT Ant or lysogenic control cells harboring an empty expression vector, pBAD24 (Fig. 7A). Similar to the H73A mutant, the D47R mutant produced a turbid lysis zone (Fig. 7A), suggesting its role in the antirepression activity of Ant.
For further proof of the function of Ant Asn58 in the lytic switching of SPC32H in vivo, the N58R mutation was introduced into the SPC32H genome (Fig. S9), and the prophage induction rate was measured (Fig. 7C). The N58R mutation reduced the number of spontaneously induced phage particles from the host Salmonella by approximately five log orders of magnitude (Fig. 7C). When phage induction was artificially induced by the DNA-damaging agent mitomycin C, ∼117-fold more phage particles were induced with the WT phage lysogen, whereas no significant increase was observed with the N58R mutant phage (ant-N58R) lysogen (Fig. 7C). Furthermore, the number of induced phage particles from the ant-N58R lysogen was comparable to that from the ant deletion mutant phage (Δant) lysogen after both spontaneous and artificial induction (Fig. 7C). These results demonstrate that Asn58 is a critical residue for the antirepression function of Ant, which is required for the switch from the lysogenic to the lytic life cycle of SPC32H.
Fig. S9.
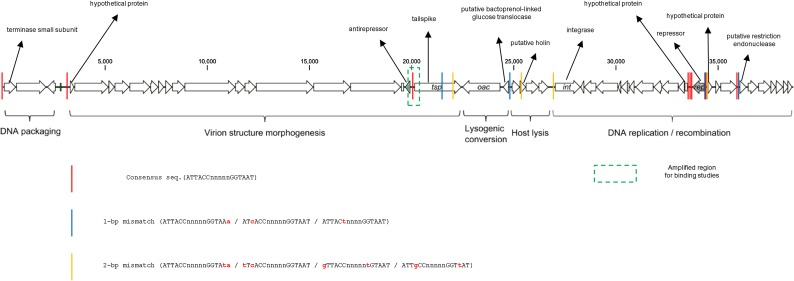
Schematic of the SPC32H genome structure and the position of Rep operators in the genome. Horizontal arrows indicate the predicted ORFs of SPC32H, and vertical lines through the genome indicate Rep operator sites. Red, consensus Rep operator sequence; blue, consensus sequence with a 1-bp mismatch; yellow, consensus sequence with 2-bp mismatches. The box outlined by the green dashed line represents the region used in EMSA binding studies.
Concluding Remarks
In various organisms, disabling repressors is a crucial process for controlling the expression of desired genes; however, the removal of stably bound Rep from DNA is challenging (Kd = 8.6 nM for Rep–DNA binding in this study). Most previously studied Ants simply compete with DNA for the same Rep-binding site. Here, we revealed an alternative mechanism of Ant-mediated derepression by studying a Rep–Ant system from a temperate Salmonella phage. Structural and biochemical analyses of the Rep–Ant complex showed that Ant does not compete for the DNA-binding site of Rep; instead, Ant recognizes Rep by binding to two distinct regions: the NDD and the CAD. The DNA-binding and Ant-recognition surfaces on the NDD are distinct and do not overlap (Fig. 7D). The second binding site of Rep, the CAD, might assist in recruiting Ant so that both NDDs of the Rep dimer bind to Ant simultaneously; the high local concentration of NDDs near Ant would facilitate binding of Rep to Ant over DNA (Fig. 7D).
A canonical repressor consists of NDDs and C-terminal dimerization domains. The C-terminal dimerization domains promote the dimerization of the NDDs (20). However, the Rep from the temperate Salmonella phage SPC32H can reversibly assemble into two oligomeric states, dimer and tetramer, and the Rep F187A mutant, which forms only a dimer in solution, bound to DNA only weakly even at high concentrations. Thus, Rep tetramerization is essential for DNA binding, suggesting that intermolecular dimers of the DNA-binding domains from two Rep dimers are required. Indeed, the crystal structure of Rep92–198 showed that Rep forms a tetramer via a coiled-coil interaction between the CADs from two Rep dimers. The tilted interface between the CADs from the two Rep dimers allows the proper positioning of the NDDs from the two dimers to permit their intermolecular dimerization and binding to DNA. Taken together, our crystallographic, modeling, biochemical, and mutational analyses of the Rep–Ant complex elucidate a noncanonical derepression system that had not been described previously. The principles of the derepression by Ant described here could extend to other organisms. However, whether Rep binding to multiple DNA sites is related to the regulation of specific genes remains to be explored.
Materials and Methods
Protein Expression and Purification of the Rep–Ant Complex.
Constructs comprising residues 1–198 of Rep and residues 1–86 of Ant from the temperate Salmonella phage SPC32H were cloned into pHis1 and pGST2 vectors (22) in frame with an N-terminal 6×-histidine tag and an N-terminal GST tag, respectively. Rep and Ant were expressed separately in Escherichia coli BL21(DE3) cells induced with 0.5 mM isopropyl-β-d-1-thiogalactopyranoside. Cells were harvested by centrifugation, and cell pellets were mixed in a 1:1 ratio. For cell lysis, the mixed pellets were resuspended in buffer A [20 mM Tris⋅HCl (pH 8.0) and 200 mM NaCl] containing 1 mM PMSF. Cells were lysed with a microfluidizer (Microfluidics), and the lysed cells were centrifuged at 4,611 × g (Vision V506CA rotor) for 30 min at 277 K to pellet the cell debris; the supernatant was applied to a glutathione-Sepharose column (GE Healthcare) pre-equilibrated with buffer A. Proteins were eluted with buffer A containing 15 mM reduced glutathione. The eluates were desalted into buffer A, and the buffer-exchanged protein was loaded onto a nickel affinity column pre-equilibrated with buffer A. The Rep–Ant protein complex was eluted with buffer A containing 300 mM imidazole, and the fusion tags, including the GST and 6×-histidine tags, were cleaved using Tobacco etch virus (TEV) protease. The eluate was further purified by gel filtration on a HiLoad 16/60 Superdex 200 column (GE Healthcare) pre-equilibrated with buffer A. A selenomethionine-containing protein of the Rep–Ant complex was expressed in E. coli BL21(DE3) cells and purified in the same manner as the native protein.
Constructs of GST-Rep1–72, GST-Rep92–198, GST-Ant1–86, and GST-Ant1–86 (WT, R37D, N58R, and Y76A, respectively) were cloned into the pGST2 vector, and the constructs of Rep1–198 (N36A, R40A, K46A, V69R, and F187A, respectively) were cloned into the pHis1 vector. Each protein was expressed and purified using a nickel affinity or glutathione-Sepharose column (GE Healthcare), followed by TEV cleavage and gel filtration with elution buffer [20 mM Tris⋅HCl (pH 8.0) and 200–300 mM NaCl] as described above. The Rep92–198 (pGST2 vector)/Ant (pHis1 vector) complex was purified with the same method used to purify the Rep1–198 (pHis1 vector)/Ant1–86 (pGST2 vector) complex. The Rep1–72 (pGST2 vector)/Ant1–86 (pHis1 vector) complex was purified using only a glutathione-Sepharose column without gel filtration.
Crystallization and Data Collection.
Crystals of the Rep–Ant complex were grown by the hanging-drop vapor diffusion method by mixing equal volumes (2 μL) of each protein solution (9 mg/mL in buffer A) and the reservoir solutions. A reservoir solution consisting of 2.6 M sodium chloride and 0.1 M sodium citrate (pH 5.6) was used to grow crystals of the Rep–Ant complex. Crystals of the Rep–Ant complex reached their maximum size within 5–6 d at 296 K. Crystals were soaked in Paratone-N (Hampton Research) before being flash-frozen in a nitrogen stream at 100 K. Single-wavelength anomalous dispersion (SAD) data for the Rep–Ant complex were collected at the 7A beamline of Pohang Accelerator Laboratory, Pohang, South Korea, and high-resolution data were collected at the BL26 beamline of SPring-8, Koto, Hyogo, Japan. The raw data were processed and scaled using the program suite HKL2000 (23). Table S1 summarizes the statistics of data collection. The crystals of Rep92–198 were produced using 0.1 M Tris⋅HCl (pH 8.2), 15% PEG4000, and 0.1 M MgSO4, were cryoprotected by soaking in 20% glycerol, and were flash-frozen in liquid nitrogen for data collection.
Structure Determination and Refinement.
Selenium atoms in each octamer of the SeMet-substituted Rep–Ant complex were located with the program PHENIX (24). Detwinning was essential to improve the quality of the electron density map. The structure of Rep92–198 was solved by molecular replacement using the dimer model of Rep92–198 taken from the Rep1–198–Ant1–86 full complex. A cross-rotational search followed by a translational search were performed using the program PHASER (25). Subsequent manual model building was performed using COOT (26), and restrained refinement was performed using REFMAC (27). Several rounds of model building, simulated annealing, positional refinement, and individual B-factor refinement were performed. Table S1 lists the refinement statistics. Coordinates and structure factors have been deposited in the Protein Data Bank under ID codes 5D50 for the Rep–Ant complex and 5D4Z for Rep92–198.
SI Text
Asp36, Arg40, and Lys46 in Rep corresponded to Gln29, Gln33, and Lys38, respectively, in the repressor of phage 434 (PDB ID code 2OR1) (16), which play a critical role in DNA-binding (Fig. S7B). Thus, we hypothesized that these residues might be involved in DNA binding and examined the DNA-binding properties of WT Rep and Rep mutants in an EMSA. A DNA fragment containing one Rep binding site (ATTACCtgtaaGGTAAT; conserved sequences are in capital letters) was PCR amplified using the SPC32H genome as a template, and the resultant PCR product was γ-32P–labeled for use as a DNA probe (Table S3). As hypothesized, WT Rep exhibited robust DNA-binding activity (Fig. S7E). As increasing amounts of purified WT Rep were incubated with the DNA probe, two specific retarded bands were observed that were not observed with the addition of nonlabeled DNA probe (Fig. S7E, WT). The putative DNA-binding residues of Rep1–72 (Asn36, Arg40, and Lys46) were assessed by mutations (Fig. S7E). Proteins with these point mutations either did not retard DNA (R40A and K46A) (Fig. S7E) or retarded DNA only slightly at concentrations similar to those of WT Rep (Fig. S7E, N36A).
SI Materials and Methods
SEC-MALS.
SEC-MALS experiments were performed using an FPLC system (GE Healthcare) connected to a Wyatt MiniDAWN TREOS MALS instrument and a Wyatt Optilab rEX differential refractometer. A Superdex 200 10/300 GL (GE Healthcare) gel-filtration column pre-equilibrated with buffer A [20 mM Tris⋅HCl (pH 8.0) and 300 mM NaCl] was normalized using ovalbumin protein. Proteins (1–3 mg) were injected at a flow rate of 0.4 mL/min. Data were analyzed using the Zimm model for fitting static light-scattering data and were graphed using EASI graph with a UV peak in ASTRA V software (Wyatt). To obtain the SEC-MALS data of the Rep1–198 V69R mutant/DNA complex, the Rep1–198 V69R mutant [8 mg/mL in 20 mM Tris⋅HCl (pH 8.0) and 100 mM NaCl] and DNA [25.9 mg/mL in 150 mM Tris⋅HCl (pH 8.0)] were mixed in a 9:1 (vol:vol) ratio, resulting in a 1.2-fold molar excess of DNA over the Rep1–198 V69R dimer and were incubated at 4 °C for 1 h before injection.
Analytical Gel Filtration.
Purified Rep1–198, Rep92–198, Rep1–198 F187A mutant, Rep1–198/Ant1–86 complex, and Rep92–198/Ant1–86 complex proteins were subjected to analytical gel filtration chromatography on a Superdex 75 or 200 (10/300 GL) column with running buffer [20 mM Tris⋅HCl (pH 8.0) and 300 mM NaCl] at a constant flow rate of 0.5 mL/min. A standard curve was obtained using molecular weight markers (Sigma). The Stokes radii of β-amylase, alcohol dehydrogenase, carbonic anhydrase, and cytochrome c were calculated from the crystal structures of each protein (PDB ID codes 1FA2, 2HCY, 1V9E, and 1HRC, respectively) using the HYDROPRO program (28). To obtain the gel filtration profile of the Rep1–198 V69R mutant/DNA complex at low concentration, the Rep1–198 V69R mutant [0.5 mg/mL in 20 mM Tris⋅HCl (pH 8.0) and 100 mM NaCl] and DNA [1.6 mg/mL in 150 mM Tris⋅HCl (pH 8.0)] were mixed in a 9:1 (vol:vol) ratio, resulting in an 1.2-fold molar excess of DNA over the Rep1–198 V69R dimer and were incubated at 4 °C for 1 h before injection.
SPR.
The binding of WT and mutant Ant constructs and Rep was measured with a Biacore 3000 system (GE Healthcare) at 25 °C with a flow rate of 20 μL/min. GST-Ant (R37D, N58R, and Y76A mutants) was immobilized on a CM5 surface via covalent linkage to the N terminus of GST. A CM5 chip was activated using 1:1 ratio of N-hydroxysuccinimide (NHS) to 1-ethyl-3-(3 dimethylaminopropyl) carbodiimide (EDC) at a flow rate of 20 μL/min for 5 min. Each protein sample (10 μM) in 20 mM acetate buffer (pH 4.4) was passed over separate flow cells at 20 μL/min for 5 min, followed by a blocking step using ethanolamine (1 M, pH 8.5) at 20 μL/min for 5 min. All binding experiments were performed in buffer A. Binding of Rep proteins (WT and F187A mutant) with WT and mutants of Ant (R37D, N58R, and Y76A) was measured by passing Rep over flow cells coupled to GST-Ant with association and dissociation times of 240 and 300 s, respectively. Between subsequent injections of all proteins, surfaces were regenerated with an injection of 10 mM glycine (pH 2.1) for 30 s at 20 μL/min.
EMSA.
EMSA for Rep and its derivative proteins was performed as previously described with some modifications (11). In brief, the 313 bp of the ant-tsp intergenic region containing the Rep-binding site was PCR amplified (Table S3), and then the purified PCR products were γ-32P–labeled with T4 polynucleotide kinase (Invitrogen). Various concentrations of Rep or its derivative proteins were incubated with 4 nM labeled probe at 37 °C for 15 min in 20 μL of reaction mixture containing a binding buffer [20 mM Tris⋅HCl (pH 7.5), 50 mM NaCl, 0.2 mM EDTA, 1 mM MgCl2, and 5% glycerol] and 0.1 μg of poly(deoxyinosinic-deoxycytidylic) acid. Samples were resolved by 6% native PAGE in 45 mM Tris-borate (pH 8.3) and 1 mM EDTA, and the radioactivity of the vacuum-dried gel was analyzed by the BAS2500 system (Fujifilm).
Bacteriophages.
To introduce an ant-N58R mutation into the phage SPC32H genome, methods of lambda red recombination and suicide vector-mediated double homologous recombination with appropriate oligomers and plasmids were applied sequentially to SPC32H lysogen [ΔLT2gtrABC1 (32H)] as described previously (11, 29). Spontaneously induced prophages from the resultant lysogen were purified, and the mutation in the phage genome was confirmed by DNA sequencing. To compare the induction rates of WT and mutant phages, cultures of each phage lysogen at the early exponential phase were treated with mitomycin C (1 μg/mL, final concentration) or distilled water for 3 h, and the number of free phage particles in the culture supernatant was counted by standard double-agar plaque assays (30) using Salmonella enterica serovar Typhimurium ΔLT2gtrABC1 as a reference strain.
Disk Diffusion Assay.
Overnight cultures of S. Typhimurium lysogenized by SPC32H harboring one of the pant series of plasmids that express Ant or its derivative mutant protein (Table S4) were mixed with LB soft agar [LB supplemented with 0.4% (wt/vol) agar and ampicillin] and then were poured onto fresh LB agar [1.5% (wt/vol) agar] plates. After 30 min of solidification, a filter disk 6 mm in diameter (Whatman) socked with arabinose [15% (wt/vol)] was placed on the bacterial lawn. Plates were incubated at 37 °C for 8 h, and the diameter of the generated bacterial lysis zone was measured.
Dual-Plasmid Bioluminescence Reporter Assay.
The experimental design is described in Fig. S8B. The promoter region (151 bp in length) of the SPC32H_042 gene containing a Rep-binding sequence (11) was PCR amplified and cloned into the promoterless bioluminescence reporter plasmid pBBR-lux (31) to construct a reporter plasmid pP042lux. The S. Typhimurium ΔLT2gtrABC1 strain was cotransformed with the pP042lux and one of the prep series of plasmids that expresses Rep or its derivative mutant protein under the PBAD promoter (Table S4). Overnight-cultured cells were subcultured in fresh LB medium supplemented with chloramphenicol and ampicillin at 37 °C until the cells reached the early exponential phase. Half of the cells were treated with arabinose (0.2% final concentration); the other half were treated with distilled water, and the cultures were further incubated at 37 °C for 3 h. Cellular bioluminescence and the absorbance at 600 nm (A600) were measured periodically using an Infinite 200 Pro plate reader (Tecan). Arbitrary relative light units (RLU) were calculated by dividing the luminescence by the A600.
BLI Measurements.
BLI measurements were performed to evaluate the binding between DNA and Rep using a BLItz system (ForteBio). Streptavidin was immobilized on an AR2G biosensor sensor chip surface using amine coupling in 10 mM Hepes-NaOH (pH 7.0). The surface was activated by 5-min immersion in NHS/EDC, followed by 5-min immersion of streptavidin in 10 mM sodium acetate (pH 4.0). Subsequently, the AR2G biosensor chip was blocked by 5-min immersion in 1 M ethanolamine (pH 8.9). The surface was equilibrated with running buffer [20 mM Tris⋅HCl (pH 8.0) and 300 mM NaCl]. The streptavidin immobilized on the AR2G biosensor chip was bound to 400 nM 5′-biotinylated DNA (300 bp) in 20 mM Tris⋅HCl (pH 8.0) and 300 mM NaCl (Table S3). To determine whether the DNA interacted with proteins, including WT Rep, Rep mutants (N36A, R40A, K46A, and F187A), Rep1–72, Rep92–198, and the Rep–Ant complex, the prepared AR2G biosensor chip was dipped in 60 μM protein in running buffer [20 mM Tris⋅HCl (pH 8.0), and 100 mM NaCl]. Associations between DNA and proteins were measured for 150 s, and dissociations were measured for 150 s. For the dissociation of bound Rep using Ant (WT and Y76A mutant), 110 μM Ant (WT and Y76A mutant) in 20 mM Tris⋅HCl (pH 8.0) and 100 mM NaCl was added. To measure the binding of Rep (1–198, 1–72, 92–198) and Ant, GST-Ant (WT) was immobilized on an AR2G biosensor surface via covalent linkage to the N terminus of GST.
Bacterial Strains, Plasmids, and Growth Conditions.
The bacterial strains used in this study are listed in Table S5, and plasmids are listed in Table S4. All Salmonella mutants were derived from the prophage cured S. Typhimurium LT2(c) strain and its ΔLT2gtrABC1 derivative (32, 33). Escherichia coli and S. Typhimurium strains were grown aerobically at 37 °C in LB medium supplemented with the following antibiotics, if required: 50 μg/mL ampicillin; 50 μg/mL kanamycin; 25 μg/mL chloramphenicol.
Bulk PIFE Measurement.
Cy3-labeled DNA (50 nM) (Table S3) and Rep mutants (500 nM) loaded in a quartz cuvette were excited by 532-nm light, and fluorescence emission was collected at 550–640 nm using a PTI fluorometer. The fluorescence acquisition rate was ∼0.15/s. Spectra in the absence or presence of Rep mutants were obtained and analyzed using Felix analysis software (PTI).
DNA Preparation for Single-Molecule PIFE.
All DNA oligonucleotides for single-molecule measurements were purchased from Bioneer Co., Ltd. Biotin was incorporated at the end of target DNA for tethering on the glass surface, and Cy3 dye was labeled via a substitution reaction between amino-modified thymine and NHS ester-linked Cy3. The details of the DNA sequence (including the positions of incorporated modifications) are given in Table S3. DNA annealing was performed by mixing the complementary stands in a buffer containing 25 mM Tris (pH 8) and 250 mM NaCl. The annealing mixture was heated at 95 °C for 2 min and allowed to cool down slowly in a water bath.
Single-Molecule PIFE Measurement.
Cleaned coverslips and quartz glasses were passivated by polyethylene-glycol to prevent nonspecific binding of samples to the glass surface (34). All imaging and cleavage reactions were performed with the following buffer composition: 100 mM NaCl, 50 mM Tris⋅HCl (pH 8.0), oxygen scavenger [7.5 U/mL of pyranose oxidase (Sigma-Aldrich), 1 kU/mL of catalase (Sigma-Aldrich), 50 mM of β-d-glucose (TCI)], and triplet quencher (2 mM 6-hydroxy-2,5,7,8-tetramethylchroman-2-carboxylic acid) (Sigma-Aldrich). The oxygen scavenger and triplet quencher were used to prevent the organic fluorophores from photobleaching and photoblinking (35). We obtained the single-molecule PIFE assay experimental data using a home-built total internal reflection fluorescence microscope. We excited Cy3 with a 532-nm green laser (Samba; Cobolt AB) and collected the emitting photons through a water-immersion objective lens (UPlanApo 60×; Olympus) followed by filtering with an emission filter. The fluorescence emission signal was captured by back-illuminated electron-multiplying charge-coupled device detector (iXon DU-897; Andor Technology). In the single-molecule measurements, we constructed a flow chamber by assembling a microscope slide and a coverslip with double-sided tape and sealed with epoxy. We adapted rounded holes on the quartz slide as the inlet and outlet for solution exchange. Time trajectories were obtained with a homemade C++ script (available for download at https://cplc.illinois.edu/software) and analyzed by home-made programs written in MATLAB and IDL program.
Acknowledgments
We thank the staff of beamline 7A at the Pohang Light Source for assistance during X-ray experiments; Prof. Hyun Kyu Song for assistance with MALS experiments; Dr. Young Ha Park for assistance with SPR experiments; and Kiup Lee and Hwajung Choi for assistance during protein purifications. This study was supported by Grants 2015R1A5A1008958 and 2015R1C1A1A01054842 from the National Research Foundation (NRF) of Korea funded by the Korean government; Grant 2014M1A8A1049296 from the Korea Carbon Capture and Sequestration Research and Development Center; Grant IBS-R021-D1 from the Institute for Basic Science (to H.H.L); and NRF Grant 2014R1A2A1A10051563 funded by the Korean government Ministry of Science, ICT, and Future Planning (to S.R.).
Footnotes
The authors declare no conflict of interest.
This article is a PNAS Direct Submission.
Data deposition: Coordinates and structure factors have been deposited in the Protein Data Bank [ID codes 5D50 (Rep–Ant complex) and 5D4Z (Rep 92–198)].
This article contains supporting information online at www.pnas.org/lookup/suppl/doi:10.1073/pnas.1602618113/-/DCSupplemental.
References
- 1.Browning DF, Busby SJ. The regulation of bacterial transcription initiation. Nat Rev Microbiol. 2004;2(1):57–65. doi: 10.1038/nrmicro787. [DOI] [PubMed] [Google Scholar]
- 2.León E, et al. A bacterial antirepressor with SH3 domain topology mimics operator DNA in sequestering the repressor DNA recognition helix. Nucleic Acids Res. 2010;38(15):5226–5241. doi: 10.1093/nar/gkq277. [DOI] [PMC free article] [PubMed] [Google Scholar]
- 3.Oppenheim AB, Neubauer Z, Calef E. The antirepressor: A new element in the regulation of protein synthesis. Nature. 1970;226(5240):31–32. doi: 10.1038/226031a0. [DOI] [PubMed] [Google Scholar]
- 4.Luo Y, et al. Crystal structure of LexA: A conformational switch for regulation of self-cleavage. Cell. 2001;106(5):585–594. doi: 10.1016/s0092-8674(01)00479-2. [DOI] [PubMed] [Google Scholar]
- 5.Wang HC, Ho CH, Hsu KC, Yang JM, Wang AH. DNA mimic proteins: Functions, structures, and bioinformatic analysis. Biochemistry. 2014;53(18):2865–2874. doi: 10.1021/bi5002689. [DOI] [PubMed] [Google Scholar]
- 6.Dryden DT. DNA mimicry by proteins and the control of enzymatic activity on DNA. Trends Biotechnol. 2006;24(8):378–382. doi: 10.1016/j.tibtech.2006.06.004. [DOI] [PubMed] [Google Scholar]
- 7.Liu D, et al. Solution structure of a TBP-TAF(II)230 complex: Protein mimicry of the minor groove surface of the TATA box unwound by TBP. Cell. 1998;94(5):573–583. doi: 10.1016/s0092-8674(00)81599-8. [DOI] [PubMed] [Google Scholar]
- 8.Wang HC, et al. White spot syndrome virus protein ICP11: A histone-binding DNA mimic that disrupts nucleosome assembly. Proc Natl Acad Sci USA. 2008;105(52):20758–20763. doi: 10.1073/pnas.0811233106. [DOI] [PMC free article] [PubMed] [Google Scholar]
- 9.Echols H, Green L. Establishment and maintenance of repression by bacteriophage lambda: The role of the cI, cII, and c3 proteins. Proc Natl Acad Sci USA. 1971;68(9):2190–2194. doi: 10.1073/pnas.68.9.2190. [DOI] [PMC free article] [PubMed] [Google Scholar]
- 10.Reichardt L, Kaiser AD. Control of lambda repressor synthesis. Proc Natl Acad Sci USA. 1971;68(9):2185–2189. doi: 10.1073/pnas.68.9.2185. [DOI] [PMC free article] [PubMed] [Google Scholar]
- 11.Kim M, Ryu S. Antirepression system associated with the life cycle switch in the temperate podoviridae phage SPC32H. J Virol. 2013;87(21):11775–11786. doi: 10.1128/JVI.02173-13. [DOI] [PMC free article] [PubMed] [Google Scholar]
- 12.Krissinel E, Henrick K. Inference of macromolecular assemblies from crystalline state. J Mol Biol. 2007;372(3):774–797. doi: 10.1016/j.jmb.2007.05.022. [DOI] [PubMed] [Google Scholar]
- 13.Holm L, Sander C. Protein structure comparison by alignment of distance matrices. J Mol Biol. 1993;233(1):123–138. doi: 10.1006/jmbi.1993.1489. [DOI] [PubMed] [Google Scholar]
- 14.Wang HC, et al. Neisseria conserved protein DMP19 is a DNA mimic protein that prevents DNA binding to a hypothetical nitrogen-response transcription factor. Nucleic Acids Res. 2012;40(12):5718–5730. doi: 10.1093/nar/gks177. [DOI] [PMC free article] [PubMed] [Google Scholar]
- 15.McCabe BC, Pawlowski DR, Koudelka GB. The bacteriophage 434 repressor dimer preferentially undergoes autoproteolysis by an intramolecular mechanism. J Bacteriol. 2005;187(16):5624–5630. doi: 10.1128/JB.187.16.5624-5630.2005. [DOI] [PMC free article] [PubMed] [Google Scholar]
- 16.Tucker AT, et al. A DNA mimic: The structure and mechanism of action for the anti-repressor protein AbbA. J Mol Biol. 2014;426(9):1911–1924. doi: 10.1016/j.jmb.2014.02.010. [DOI] [PMC free article] [PubMed] [Google Scholar]
- 17.Aggarwal AK, Rodgers DW, Drottar M, Ptashne M, Harrison SC. Recognition of a DNA operator by the repressor of phage 434: A view at high resolution. Science. 1988;242(4880):899–907. doi: 10.1126/science.3187531. [DOI] [PubMed] [Google Scholar]
- 18.Albright RA, Matthews BW. Crystal structure of lambda-Cro bound to a consensus operator at 3.0 A resolution. J Mol Biol. 1998;280(1):137–151. doi: 10.1006/jmbi.1998.1848. [DOI] [PubMed] [Google Scholar]
- 19.Mondragón A, Harrison SC. The phage 434 Cro/OR1 complex at 2.5 A resolution. J Mol Biol. 1991;219(2):321–334. doi: 10.1016/0022-2836(91)90568-q. [DOI] [PubMed] [Google Scholar]
- 20.Stayrook S, Jaru-Ampornpan P, Ni J, Hochschild A, Lewis M. Crystal structure of the lambda repressor and a model for pairwise cooperative operator binding. Nature. 2008;452(7190):1022–1025. doi: 10.1038/nature06831. [DOI] [PubMed] [Google Scholar]
- 21.Watkins D, Mohan S, Koudelka GB, Williams LD. Sequence recognition of DNA by protein-induced conformational transitions. J Mol Biol. 2010;396(4):1145–1164. doi: 10.1016/j.jmb.2009.12.050. [DOI] [PubMed] [Google Scholar]
- 22.Sheffield P, Garrard S, Derewenda Z. Overcoming expression and purification problems of RhoGDI using a family of “parallel” expression vectors. Protein Expr Purif. 1999;15(1):34–39. doi: 10.1006/prep.1998.1003. [DOI] [PubMed] [Google Scholar]
- 23.Otwinowski Z, Minor W. Processing of X-ray diffraction data collected in oscillation mode. Methods Enzymol. 1997;276:307–326. doi: 10.1016/S0076-6879(97)76066-X. [DOI] [PubMed] [Google Scholar]
- 24.Adams PD, et al. PHENIX: A comprehensive Python-based system for macromolecular structure solution. Acta Crystallogr D Biol Crystallogr. 2010;66(Pt 2):213–221. doi: 10.1107/S0907444909052925. [DOI] [PMC free article] [PubMed] [Google Scholar]
- 25.McCoy AJ, Grosse-Kunstleve RW, Storoni LC, Read RJ. Likelihood-enhanced fast translation functions. Acta Crystallogr D Biol Crystallogr. 2005;61(Pt 4):458–464. doi: 10.1107/S0907444905001617. [DOI] [PubMed] [Google Scholar]
- 26.Emsley P, Cowtan K. Coot: Model-building tools for molecular graphics. Acta Crystallogr D Biol Crystallogr. 2004;60:2126–2132. doi: 10.1107/S0907444904019158. [DOI] [PubMed] [Google Scholar]
- 27.Murshudov GN, Vagin AA, Dodson EJ. Refinement of macromolecular structures by the maximum-likelihood method. Acta Crystallogr D Biol Crystallogr. 1997;53:240–255. doi: 10.1107/S0907444996012255. [DOI] [PubMed] [Google Scholar]
- 28.García De La Torre J, Huertas ML, Carrasco B. Calculation of hydrodynamic properties of globular proteins from their atomic-level structure. Biophys J. 2000;78(2):719–730. doi: 10.1016/S0006-3495(00)76630-6. [DOI] [PMC free article] [PubMed] [Google Scholar]
- 29.Kim S, Kim M, Ryu S. Development of an engineered bioluminescent reporter phage for the sensitive detection of viable Salmonella typhimurium. Anal Chem. 2014;86(12):5858–5864. doi: 10.1021/ac500645c. [DOI] [PubMed] [Google Scholar]
- 30.Adams MH. Bacteriophages. Interscience Publishers Inc.; New York: 1959. Methods of study of bacterial viruses; pp. 443–457. [Google Scholar]
- 31.Lenz DH, et al. The small RNA chaperone Hfq and multiple small RNAs control quorum sensing in Vibrio harveyi and Vibrio cholerae. Cell. 2004;118(1):69–82. doi: 10.1016/j.cell.2004.06.009. [DOI] [PubMed] [Google Scholar]
- 32.Erickson M, et al. Competition among isolates of Salmonella enterica ssp. enterica serovar Typhimurium: Role of prophage/phage in archived cultures. FEMS Microbiol Lett. 2009;294(1):37–44. doi: 10.1111/j.1574-6968.2009.01554.x. [DOI] [PubMed] [Google Scholar]
- 33.Kim M, Ryu S. Spontaneous and transient defence against bacteriophage by phase-variable glucosylation of O-antigen in Salmonella enterica serovar Typhimurium. Mol Microbiol. 2012;86(2):411–425. doi: 10.1111/j.1365-2958.2012.08202.x. [DOI] [PubMed] [Google Scholar]
- 34.Roy R, Hohng S, Ha T. A practical guide to single-molecule FRET. Nat Methods. 2008;5(6):507–516. doi: 10.1038/nmeth.1208. [DOI] [PMC free article] [PubMed] [Google Scholar]
- 35.Swoboda M, et al. Enzymatic oxygen scavenging for photostability without pH drop in single-molecule experiments. ACS Nano. 2012;6(7):6364–6369. doi: 10.1021/nn301895c. [DOI] [PMC free article] [PubMed] [Google Scholar]
- 36.Guzman LM, Belin D, Carson MJ, Beckwith J. Tight regulation, modulation, and high-level expression by vectors containing the arabinose PBAD promoter. J Bacteriol. 1995;177(14):4121–4130. doi: 10.1128/jb.177.14.4121-4130.1995. [DOI] [PMC free article] [PubMed] [Google Scholar]


