Significance
Metastasis is responsible for 90% of cancer-related deaths and is driven by tumor cells circulating in blood. However, it is believed that only individual tumor cells can reach distant organs because multicellular clusters are too large to pass through narrow capillaries. Here, we collected evidence by examining clusters in microscale devices, computational simulations, and animals, which suggest that this assumption is incorrect, and that clusters may transit through capillaries by unfolding into single-file chains. This previously unidentified cell behavior may explain why previous experiments reported that clusters were more efficient at seeding metastases than equal numbers of single tumor cells, and has led to a strategy that, if applied clinically, may reduce the incidence of metastasis in patients.
Keywords: microfluidics, cancer metastasis, CTC clusters, circulating tumor cell cluster microemboli, capillary microhemodynamics
Abstract
Multicellular aggregates of circulating tumor cells (CTC clusters) are potent initiators of distant organ metastasis. However, it is currently assumed that CTC clusters are too large to pass through narrow vessels to reach these organs. Here, we present evidence that challenges this assumption through the use of microfluidic devices designed to mimic human capillary constrictions and CTC clusters obtained from patient and cancer cell origins. Over 90% of clusters containing up to 20 cells successfully traversed 5- to 10-μm constrictions even in whole blood. Clusters rapidly and reversibly reorganized into single-file chain-like geometries that substantially reduced their hydrodynamic resistances. Xenotransplantation of human CTC clusters into zebrafish showed similar reorganization and transit through capillary-sized vessels in vivo. Preliminary experiments demonstrated that clusters could be disrupted during transit using drugs that affected cellular interaction energies. These findings suggest that CTC clusters may contribute a greater role to tumor dissemination than previously believed and may point to strategies for combating CTC cluster-initiated metastasis.
Circulating tumor cells (CTCs) drive metastasis by disseminating from primary tumors to seed metastases in distant organs. These rare cells may serve as prognostic/predictive cancer markers or may help identify potential therapeutic targets (1–5). However, individual “singlet” CTCs may not be the strongest initiators of secondary tumors. Aggregates containing two or more CTCs (also known as circulating tumor microemboli; herein, CTC clusters) have been known for decades to seed colonies with greater efficiencies than individual CTCs (6–8). Recent data suggest that clusters may have 50 times greater metastatic potential than individual CTCs (9). The greater colonization efficiency of CTC clusters may be due to a number of factors including protection against anchorage-dependent apoptosis (5, 10), the cooperation of heterogeneous cell phenotypes within CTC clusters (11), and shielding from assault by immune cells (2, 12). Beyond their role in metastasis, CTC clusters may also serve as biomarkers for early detection (13), as prognostic markers (5, 9), and may have utility for noninvasively tracking changing drug susceptibilities in patients undergoing treatment (14).
Despite their biological significance, the behavior of CTC clusters in circulation is largely unexplored (3, 15). The current consensus is that CTC clusters are incapable of transiting through capillaries because of their large size and therefore immediately arrest in circulation, leading to the rupture of vessel walls (2, 4, 15). This idea has remained unchallenged for decades (16), despite the fact that many groups have reported the isolation of CTC clusters, sometimes containing up to 100 cells, from the peripheral blood of cancer patients (2, 5, 9–11, 17–19). Since blood is routinely drawn from the venous circulation of the arm, it is unlikely that CTC clusters could be consistently collected unless they passed through both pulmonary capillary beds and finger capillaries at least once. Furthermore, CTC clusters have been shown in animal models to exhibit circulating half-lives on the order of minutes (9) and to seed metastases in distant organs (20). Taken together, these observations suggest that CTC clusters may possess the ability to traverse small vessels (Fig. 1A).
Fig. 1.
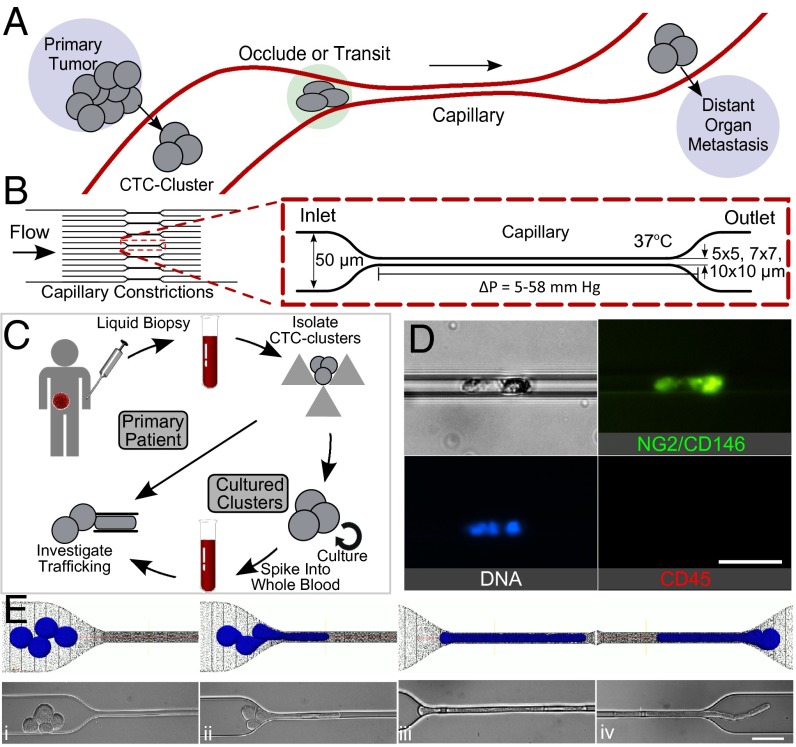
(A) Diagram of CTC clusters occluding or transiting through capillary to seed metastases. (B) Microfluidic device schematic, 16 parallel microchannels of 5 × 5, 7 × 7, or 10 × 10-µm square cross-sections, designed to mimic capillary flow conditions (not to scale). (C) Experimental workflow: CTC clusters were isolated from breast or melanoma patient liquid biopsies (30). Patient clusters introduced into capillary devices directly or after ex vivo culture and spiking into whole blood. (D) Primary patient CTC cluster isolated from melanoma patient transiting through 10-µm capillary constriction under 7 cm H2O at 37 °C. (E) Computational simulation (Top) and micrographs (Bottom) of four-cell LNCaP cluster in transit: (i) approach, (ii) unfold/elongate, (iii) travel, (iv) exit/reform through a 5-µm capillary constriction. (Scale bars: 50 µm.)
In this work, microfluidic constriction devices were engineered with dimensions mimicking human capillaries to study the behavior of CTC clusters within constrictions under physiological temperature and pressures. Although not perfect analogs of human capillaries, microchannel constrictions are advantageous for studying CTC cluster behavior for a number of reasons: (i) devices can be easily integrated with imaging systems permitting sensitive multifluorescence analyses of cellular responses in real time; (ii) unlike larger blood vessels, which are suitably modeled as tubes within fluids, the mechanical properties of capillaries are better modeled as tunnels within elastic solids (21); (iii) similar to other blood cells (22), physical parameters such as pressure, constriction size, cell elasticity, cell size, and strengths of intercellular adhesions likely dominate the transit behavior of CTC clusters in circulation. Many of these parameters can be precisely controlled in microfluidic systems, and (iv) microfluidic constrictions of this sort have previously demonstrated utility in exploring various biophysical cellular properties such as the viscoelastic properties of cancer cells (23) and neutrophils (24), examining nuclear deformability during migration (25, 26) and for phenotypic discrimination (27). Although clusters have been demonstrated to transit through 50- to 300-µm microchannels (28), capillary-sized microfluidic constrictions have yet to be studied. Observations of CTC clusters in microchannel constrictions in conjunction and in vivo models organisms reveal how CTC clusters dynamically reorganize to pass through narrow blood vessels.
Results
Microfluidic devices designed to mimic the hydrodynamic properties of capillary networks were developed consisting of 16 parallel microchannels that taper into 5-, 7-, or 10-µm “capillary constrictions” (Fig. 1B). Cancer cell clusters and CTC clusters traveling through these capillary constrictions at 37 °C under physiological pressures of 7–33 cm H2O (29) were examined. Under these conditions, red blood cells assumed morphologies similar to those reported in human capillaries (Supporting Information and Movies S1 and S2). Transit under greater than physiological (83 cm H2O) pressures is presented in the Supporting Information.
CTC Clusters Transit Through Narrow Constrictions in Single File.
Primary patient CTC clusters were isolated from blood specimens of malignant melanoma patients undergoing treatment at Massachusetts General Hospital Cancer Center (Fig. 1C). Blood samples from 10 different patients were processed using a recently developed label-free microfluidic CTC cluster isolation technology (30). Patient CTC clusters were successfully isolated from two samples, and one CTC cluster isolated from patient MEL-142 was successfully released from the cluster isolation chip and transferred to the microfluidic capillary constriction device. Fig. 1D and Movie S3 depict the successful transit of this CTC cluster through a capillary constriction. This preliminary result prompted us to conduct further experiments to determine how CTC clusters could be capable of this behavior. Because of the difficulty in isolating, staining, and manipulating extremely scarce primary patient clusters, we conducted experiments using clusters from more readily available breast cancer patient cultured CTCs (Fig. 1C) and cancer cell lines.
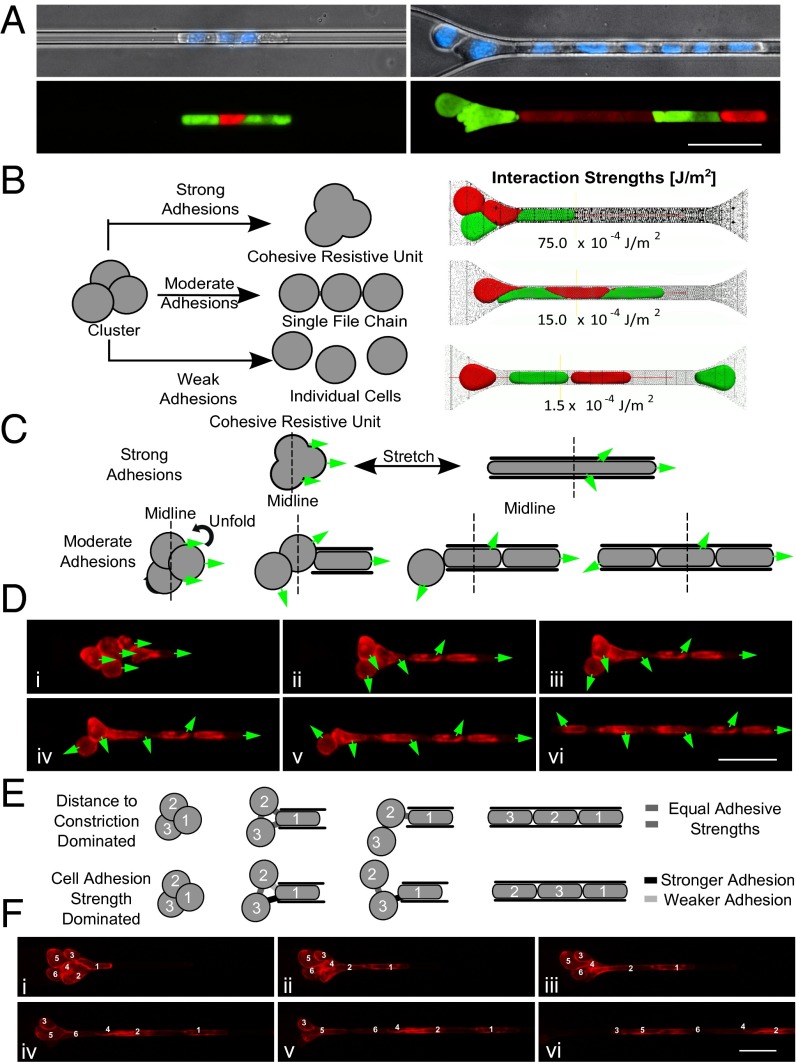
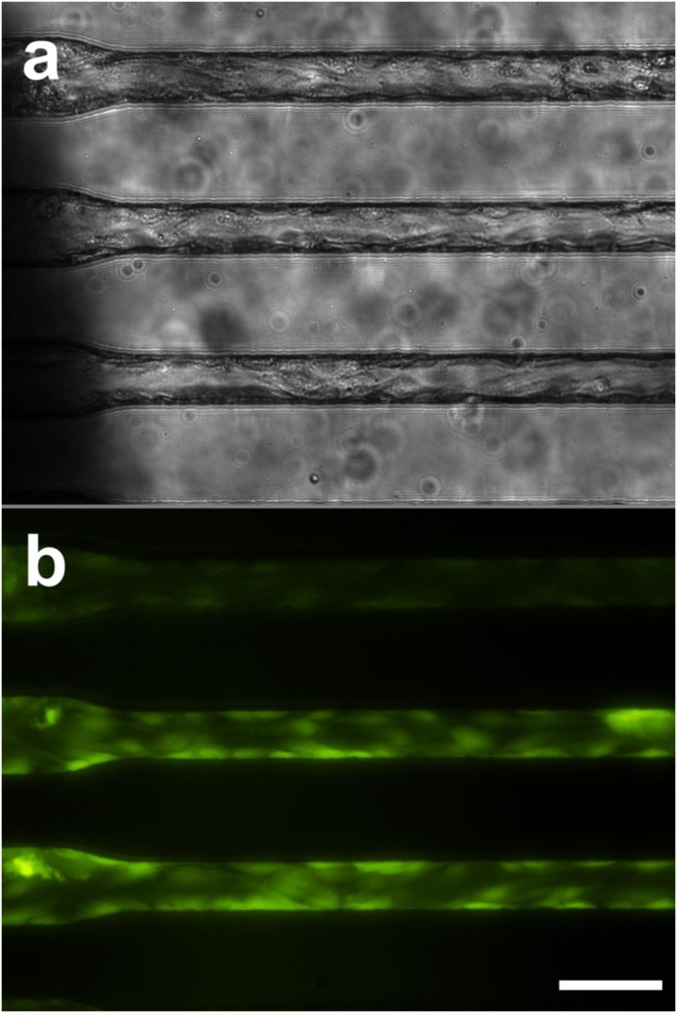
Over 90% of observed cancer cell line and cultured CTC clusters, including those containing 20 or more cells (Movies S4–S6), transited through constrictions as small as 5 µm. Individual cells experienced two distinct transit phases: an entry phase where cells encountering capillary constrictions deformed and elongated (Fig. 1Eii) and a travel phase where cells no longer deformed but traveled at constant velocity (Fig. 1Eiii). These phases are consistent with the previously reported transit behaviors of individual cancer cells (23). The transit of CTC clusters incorporated these behaviors at the level of individual cells, but with added complexity due to multicellular organization (Movie S4). When entering constrictions, clusters “unfolded” so that cells could enter and pass sequentially (Fig. 1E ii and iii). After exiting constrictions, cells retracted into rounded morphologies and clusters reformed into “typical” organizations (Fig. 1Eiv). To determine whether cells within CTC clusters transited in single file, clusters containing mixed populations of breast cancer cells engineered to express either GFP or mCherry (in approximately equal numbers) were imaged while traversing capillary constrictions (Fig. 2A). Both cell bodies and nuclei traversed in single file (Fig. 2A). Clusters also successfully transited in similar chain-like organizations through human endothelial cell-coated microchannels (Fig. S1 and Movie S7). However, because of the variability in constriction diameters across the lengths of cellularized microchannels (Fig. S1), hydrodynamic analyses of CTC cluster transit, described below, were conducted in non–cell-coated devices.
Fig. 2.
Cluster organization. (A) Micrographs of three-cell (left) and eight-cell (right) MDA-MB-231 GFP or mCherry tagged cells in clusters stained with Hoechst 33342 transiting through 5-µm capillary constriction. (B) Conceptual cluster behavior (left) and computational transit simulations (right). Strong intercellular adhesions (75.0 × 10⁻⁴ J/m2)—cluster occludes; moderate adhesions (15.0 × 10⁻⁴ J/m2)—single-file transit; weak adhesions (1.5 × 10⁻⁴ J/m2)—dissociation. (C) Conceptual responses: strong adhesions—minimal cell rotation; moderate adhesions—unfolding and cellular rotation. Greens arrows indicate leading edges of cells in the flow direction in frame i. (D) Time-lapse images of six-cell LNCaP cluster membrane stained with CellMask DeepRed. (E) Conceptual transit depends on distance to constriction (equal strength adhesions) or somewhat independent (heterogeneous adhesions). (F) Time-lapse images of six-cell LNCaP cluster demonstrating transit order. Cells numbered by distance to constriction in frame i. Experiments were conducted under 33 cm H2O at 37 °C. (Scale bars: 50 µm.)
Fig. S1.
Cellularized microchannels. Photomicrophotographs of rounded PDMS microchannels coated with human umbilical vein endothelial cells in bright field (A) and viability stained with calcein-AM (B). (Scale bar: 50 µm.)
Single-File Transit Is Favored at Physiological Interaction Energies.
It was hypothesized that biophysical interactions between cells were responsible for rearrangement into stable single-file chains. Therefore, we developed a hybrid Brownian dynamics–Lattice Boltzmann fluid–structure interaction computational model (31) to simulate CTC cluster transit under the same conditions as the experiments described above (Fig. 2B). The strengths of cell–cell interactions were found to dramatically influence the transit behaviors of CTC clusters. When interaction energies were set to (i) 1.5 × 10⁻³ J/m2, to approximate experimentally published values of cell–cell adhesions in cancer cells (32, 33), simulated clusters elongated and transited in single file similar to experimentally observed clusters (Fig. 2B, middle row, and Movie S8); (ii) 6.0 × 10⁻⁴ J/m2, below physiologically relevant levels, clusters dissociated into individual cells during transit (Fig. 2B, bottom row, and Movie S9); and (iii) 7.5 × 10⁻³ J/m2, above physiological levels, clusters occluded constrictions (Fig. 2B, top row, and Movie S10). These results suggest that the reorganization of clusters into single-file chains during transit is biophysically favored at physiological cell interaction energies and that modifying these interactions may dramatically alter the fate of CTC clusters at capillary constrictions (explored below).
We next examined clusters as they transitioned from typical cluster morphologies to single-file chains of cells by observing stained cell membranes. Clusters underwent substantial reorientation as they entered constrictions (Fig. 2 C–F and Movies S5 and S6). Cells near the leading edges of clusters underwent less rotation than cells near the trailing edges, which often rotated 180° or more (Fig. 2D). This behavior suggests that cells within clusters rotated to accommodate stable intercellular junctions (Fig. 2C) and is consistent with computational simulations of cells demonstrating that physiological-level interaction energies result in selective cleavage and retention of specific cell–cell adhesions. Another observation was that the order in which cells transited could not be predicted by their relative distances to the constrictions before entering (Fig. 2F). This led us to hypothesize that the relative adhesive strengths among cells within a given cluster dictate the order in which cells reorganize to pass through (Fig. 2E). If cells must break intercellular adhesions with all cells except two adjacent neighbors, it is likely only the strongest cell–cell adhesions are retained.
Cluster Reorganization Permits Transit by Reducing Resistance.
Inspection of CTC clusters revealed qualitative characteristics of cell reorganization during transit (above). However, the key to understanding the mechanisms that dominate cluster transit is to evaluate transit hydrodynamics. We therefore compared the transit behaviors of singlet CTCs and CTC clusters traversing 5-, 7-, and 10-µm capillary constrictions at 37 °C under 7- to 80-cm H2O applied pressures. Cell diameter(s) and transit velocities of single cell and cluster events were computed using custom Matlab scripts (Fig. 3A and Movie S11).
Fig. 3.
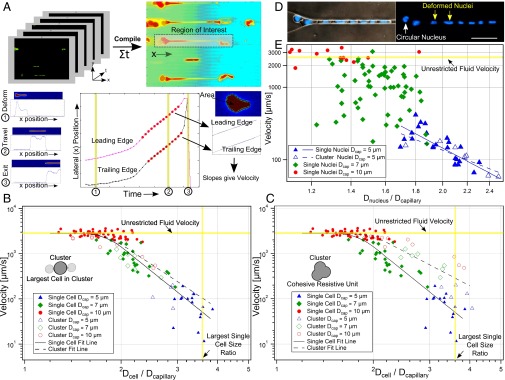
Hydrodynamic analysis. (A) Size and velocity determination. (B and C) Velocities of singlet MDA-MB-231 cells traversing 5-µm (blue triangle, n = 18), 7-µm (green diamond, n = 23) or 10-µm (red circle, n = 52) microchannels vs. the ratios of cell-to-constriction diameters (Dcell/Dcapillary). Cells exhibited three transit regimes: Dcell/Dcapillary < 1.5—unrestricted fluid velocity; Dcell/Dcapillary >3.6—cells occluded; 1.5 ≤ Dcell/Dcapillary ≤ 3.6—transit under power law relation. Clustered MDA-MB-231 cells plotted assuming (B) cluster sizes equivalent to largest constituent cells or (C) cell volumes summed. Clusters match the color/shape of individual cells (above) but are hollow (n = 5, 7, 10, respectively). Single cells (solid lines) and clusters (dashed lines) were best fit to log-log transformed data. (D) Micrographs of eight-cell Hoechst 33342 stained MDA-MB-231 cluster in 5-µm capillary constrictions. Nuclei changed from circular (white arrow) to elongated (yellow arrows) upon entering. (Scale bar: 50 µm.) (E) MDA-MB-231 nuclear velocity vs. ratio of nuclear diameter to constriction size for single cells traversing 5-µm (n = 23), 7-µm (n = 59) and 10-µm (n = 14) capillary constrictions. Clusters traversing 5-µm constrictions (n = 6) were plotted as their largest constituent nuclei.
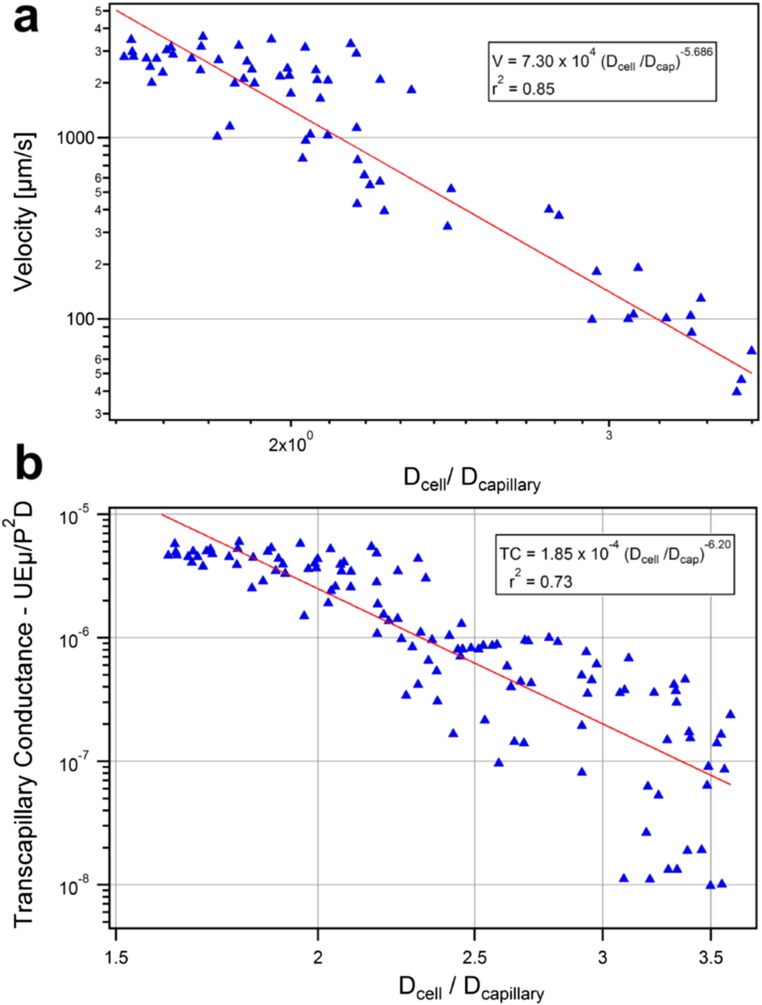
First, the velocities of singlet MDA-MB-231-LM2 cells (solid symbols) transiting under 33-cm H2O pressures through 5-µm (n = 18), 7-µm (n = 23), and 10-µm (n = 52) constrictions were plotted vs. the ratio of cells to constriction sizes (Fig. 3 B and C). Cell velocities ranged from 5 µm/s to unrestricted fluid velocities of ∼2,850 µm/s, which encompassed the physiological capillary velocity of ∼200 µm/s. Singlets exhibited three distinct transit regimes dictated by relative size of the cell to the constriction (Fig. 3 B and C, solid symbols). (i) Small cells (Dcell/Dcapillary < 1.5) transited at unrestricted fluid velocities. (ii) Large cells (Dcell/Dcapillary > 3.6) occluded capillary constrictions (the mean ratio for occluding cells was 3.8 ± 0.5 [95% confidence interval (CI)]; occlusions occurred almost exclusively in 5-µm constrictions) and were not included in this analysis. (iii) Moderately sized cells (1.5 ≤ Dcell/Dcapillary ≤ 3.6) transited according to a power law relation (23) with a power law exponent of −5.7 ± 0.6 (95% CI). This is consistent with theoretical scaling analyses (Supporting Information) and previously reported values, which suggest a power law exponent of approximately −5 (23). The strong power relation between size and velocity means that small changes in individual cell sizes dramatically affect hydrodynamic resistance (Fig. 2A).
The transit behavior of clusters was then investigated by overlaying cluster data points onto singlet data. The effective hydrodynamic diameters of clusters were calculated in two manners for comparison. When effective cluster diameters were set equal to spheres of equivalent volumes as all constituent cells, cluster velocities deviated significantly from singlet velocities (Fig. 3C) (power law exponents of −3.3 ± 0.9 vs. −5.7 ± 0.6, 95% CI), indicating that clusters did not act as cohesive resistive units. However, when cluster diameters were assumed to equal the diameters of their largest constituent cells, the transit of CTC clusters was statistically indistinguishably from singlet counterparts (Fig. 3B) (power law exponents, −4.7 ± 1.2 vs. −5.7 ± 0.6, 95% CI). This agreement suggests that the resistances of examined clusters were dominated by the largest cell within each cluster; a result consistent with the singlet cell findings that transit velocities depended strongly on size (above). It should be noted that this approximation was accurate for clusters containing relatively few cells (less than five in most cases). In the general case, the behavior of clusters in constrictions was better approximated as the sum of the resistances of each individual cell in the cluster (Supporting Information and Fig. S2). Detailed hydrodynamic analyses of CTC cluster transit using an expanded dataset with transit scaling analyses are included in the Supporting Information and Figs. S2–S4. Clusters that passed through constrictions were observed to return to spherical morphologies and reassemble into typical “cluster” morphologies within seconds (Supporting Information, Fig. S5, and Movie S12). Transited clusters also remained viable after exiting constrictions (Fig. S5) and proliferated at rates indistinguishable from controls (Fig. S6). Theoretical cell and cluster resistances derived from hydrodynamic analyses are presented for comparison in Fig. S7.
Fig. S2.
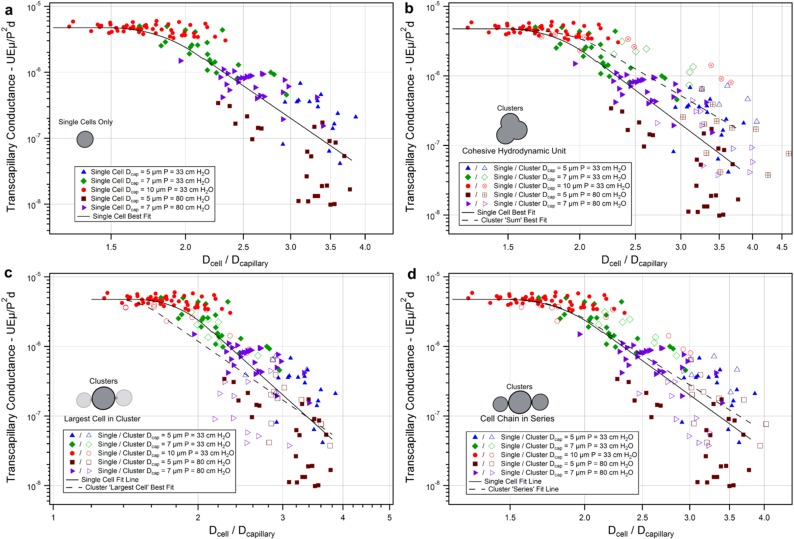
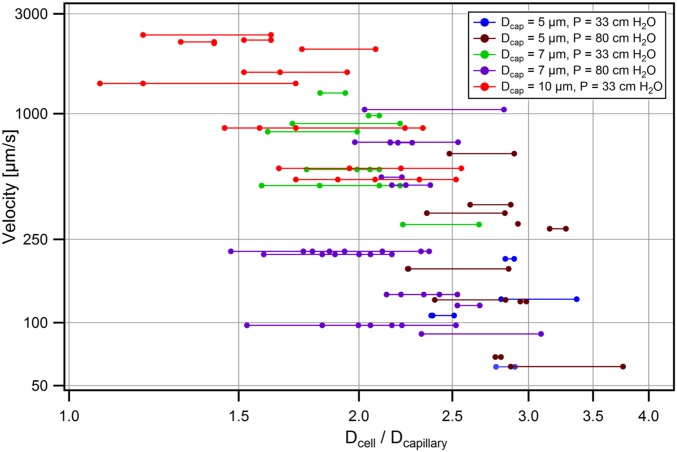
Cluster transit hydrodynamic analysis. Transcapillary conductance was calculated to normalize cells and clusters transiting under different pressures for comparison (SI Text). (A) Single cells only. Cluster diameters were plotted assuming the following: (B) cohesive resistive unit behavior where total cluster volumes were summed to equivalent larger single cells, (C) largest cell within cluster dictated total cluster conductance, or (D) single-file series behavior where individual cell resistances were summed to an effective spherical hydrodynamic diameter. MDA-MB-231 GFP cells, individually (solid symbols) or clustered (hollow symbols), were transited through 5-µm capillaries at 33 cm H2O [blue triangles; n = 18, 5 (singles, clusters)], 7 µm at 33 cm H2O (green diamonds; n = 23, 7), 10 µm at 33 cm H2O (red circles; n = 52, 10), 5 µm at 83 cm H2O (burgundy squares; n = 28, 15), or 7 µm at 83 cm H2O (purple arrowheads; n = 27, 11) at 37 °C. Clusters plotted assuming a single-file cell chain in series conductance most accurately matched single-cell data.
Fig. S4.
Power law exponent determination. Linear best fit of log-log transformed MDA-MB-231 single-cell (A) velocities vs. cell-to-capillary diameter ratio of cells transiting at 33 cm H2O (n = 70) (for Fig. 3) and (B) transcapillary conductance vs. diameter for cells transiting at 33 or 83 cm H2O (n = 121) (for Fig. S2). All transiting single cells with Dcell/Dcap ratios between 1.6 and 3.6 were included in analysis. Least-squares estimates provided power law exponents of −5.69 and −6.10, respectively.
Fig. S5.
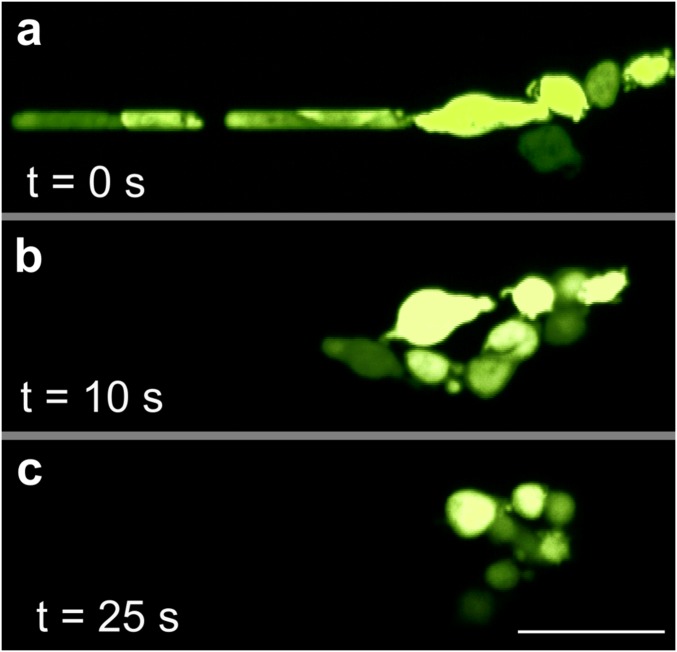
Reorganization and viability. Fluorescent photomicrographs of MDA-MB-231 L2 GFP cells traversing a 7-µm capillary under 33 cm H2O at 37 °C. Once cell began to exit the constriction, applied pressure was set to 0 to stop the flow and timer begun. (A) At time 0, cluster exited channel in a single-file chain. (B) After 10 s, cells within the cluster have begun to return to rounded morphology. (C) After 25 s, cells have returned to rounded morphology and have begun to reform lost multiple cell–cell adhesions.
Fig. S6.
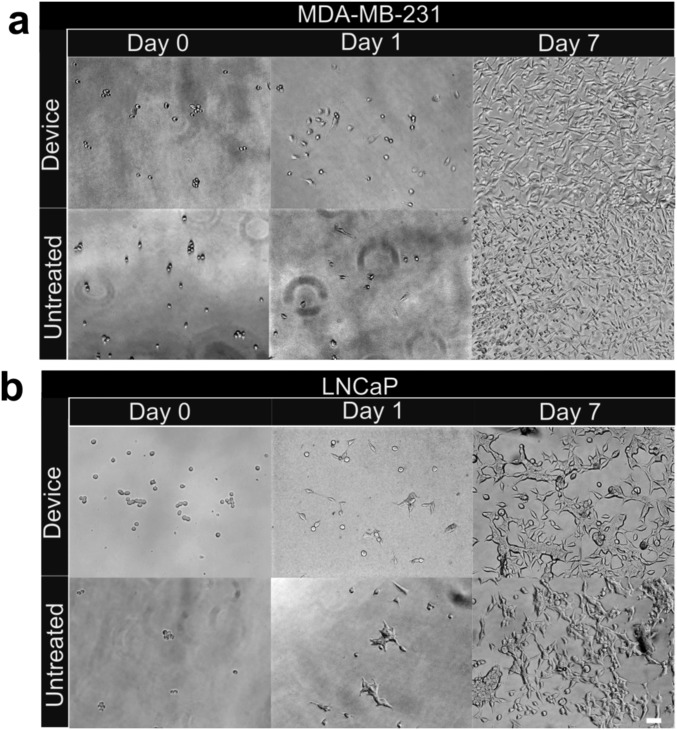
Cell proliferation posttransit. (A) Representative photomicrographs of MDA-MB-231 L2 and (B) LNCaP clusters transited through capillary device (top panels) or untreated controls (bottom panels) were seeded into 48-well plates at approximately equal numbers and grown in RPMI-1640 media supplemented with 10% FBS at 37 °C/5% CO2. Photomicrographs were taken 1 h (left column), 1 d (middle column), and 7 d (right column) after transit. (Scale bars: 50 µm.)
Fig. S7.
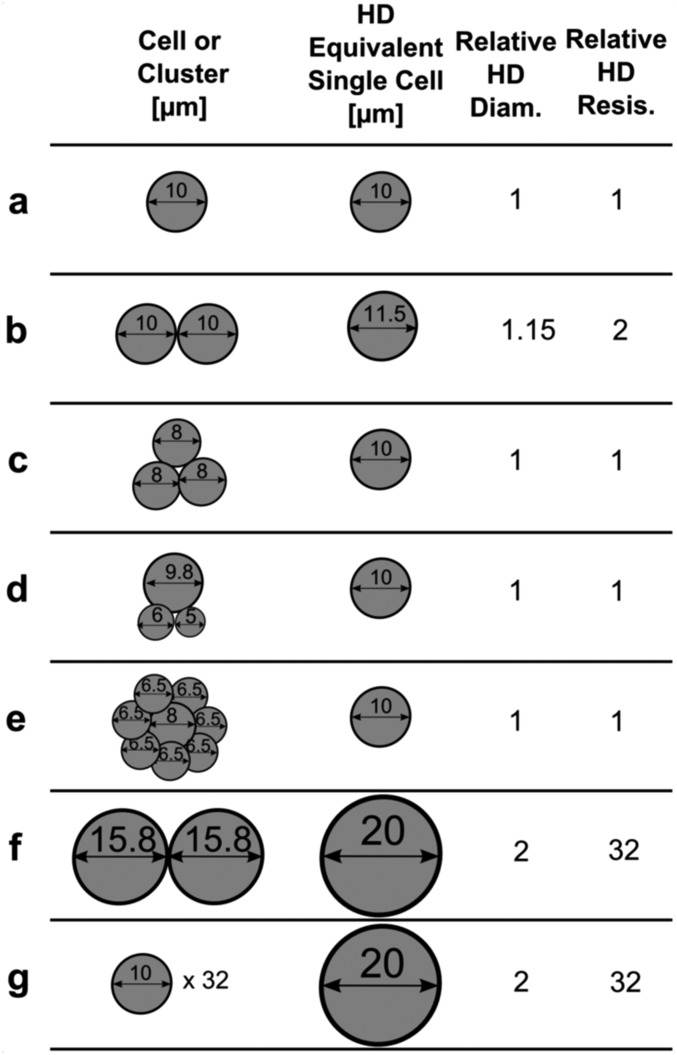
Implications of hydrodynamic transiting parameters. Clusters (far left column), their equivalent single-cell hydrodynamic (HD) resistance (middle left column), relative HD diameter (middle right), and relative HD resistance (far right) assuming (i) a fifth-degree power law relation between cell diameter and hydrodynamic resistance (Fig. S4) and (ii) chain in series transit behavior of clusters where resistances are summed in series (Fig. S2). (A) Standard case of a single 10-μm diameter cell. (B) Two cells of 10-μm diameters. (C) Three cells of 8-μm diameter. (D) One 9.8-μm cell with one 6- and one 5-μm cell. (E) One 8-μm cell with seven 6.5-μm cells. (F) Two 15.8-μm cells. (G) Thirty-two 10-μm cells. Note the dominance that the largest cell within the cluster has on resistance (D), insensitivity to numerous relatively small cells (E and G) and dramatic 32-fold increase in hydrodynamic resistance by doubling single-cell diameter (F and G). Analysis is theoretical and assumed that cells are large enough in relation to the constriction to provide significant resistance to the flow while not being too large to fully occlude the constriction.
Cell Nuclei Contribute Resistance in Very Narrow Vessels.
To investigate the role of nuclei in cluster transit, the sizes and velocities of nuclei within singlets and clusters were analyzed as described above. Nuclei deformed from rounded to elongated ellipsoidal morphologies upon entering constrictions (Fig. 3D and Movie S13). The dependence of nuclear size on transit behavior is plotted in Fig. 3E. In 10-µm channels (n = 14), cell nuclei traversed capillaries at unrestricted fluid velocities similar to whole-cell studies (Fig. 3 B and C). In 7-µm channels (n = 29), nuclear diameters were not correlated with cell velocities, suggesting that nuclei were not large enough to offer significant resistance. However, in 5-µm channels, nuclei in both singlets/clusters (n = 35/13, respectively) were inversely correlated with cell velocities and were statistically indistinguishable from one another (power law exponents, −4.3 ± 1.6 vs. −3.2 ± 2.2, respectively, 95% CI).
Interestingly, the diameter-to-constriction ratios that dictated transit regimes for whole cells (Fig. 3 B and C) (above) also appeared to be valid for nuclei-to-constriction ratios. Nuclei traversing 5-µm constrictions had diameter ratios within the power law regime calculated for whole cells (1.7 ≤ Dnucleus/Dcapillary ≤ 2.5) but below the whole-cell power law regime for most cells in 7-µm constrictions (1.2 ≤ Dnucleus/Dcapillary ≤ 1.8) and all nuclei in 10-µm constrictions (0.9 ≤ Dnucleus/Dcapillary ≤ 1.3). These findings suggest that nuclei may play a role in the transit of CTCs and CTC clusters in narrow (∼5 µm) but not larger capillaries.
Human CTC Clusters Transit in Whole Blood.
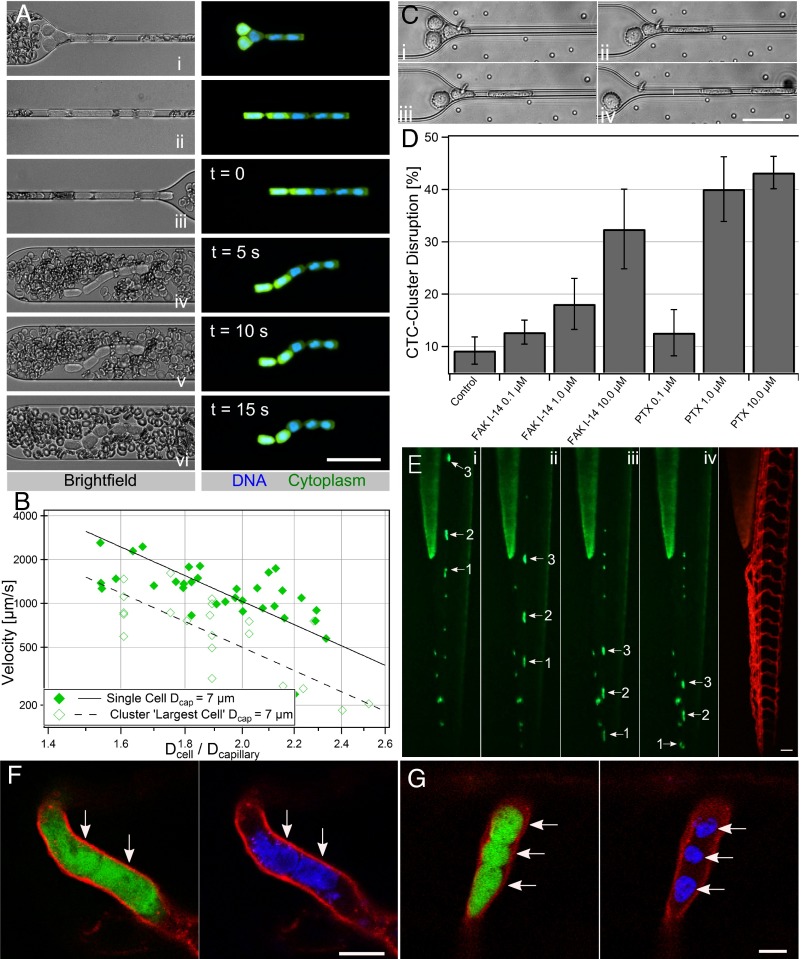
Cultured CTC clusters were derived from four breast cancer patients undergoing treatment at Massachusetts General Hospital and cultured as previously described (14). Cultured CTC clusters were spiked into whole blood before introduction into capillary constriction devices to better mimic the properties of the vascular fluid environment (Fig. 1C). Cultured human CTC clusters traversed constrictions in the same single-file manner as cancer cell and primary patient clusters (Fig. 4A and Movie S12). Importantly, cultured CTC clusters were grown as 3D aggregates in suspension and were handled without chemical or enzymatic agents that may have interfered with cell–cell adhesions. The hydrodynamic behavior of cultured CTC clusters and singlets from one patient (Brx-50) exhibited similar inverse relationships to cell size as cancer cells tested above (Fig. 4B) (power law exponents, −3.89 ± 1.5 and −4.0 ± 1.8, s−1, 95% CI, respectively). Using the largest cell in each cluster as the effective cluster size (as described above), cluster velocities were slightly but significantly lower than singlet velocities (P < 0.05). It is unclear why this is the case, although interactions of CTCs and red blood cells within the capillary constrictions may have been a contributing factor (Fig. 4Ai–iii).
Fig. 4.
Transit, disruption, and transplantation of cultured CTC clusters. (A) Micrographs of Hoechst 33342 stained, GFP tagged breast cancer patient cultured CTC clusters (BRx-50) surrounded by red blood cells in whole blood traversing 7-µm capillary constriction under 20 cm H2O (Left) bright-field and (Right) nuclear and cytoplasmic. Time stamps for iii–vi show recovery after exit. (B) Plot of velocities vs. diameter ratios of individual (diamonds, n = 33) and cultured CTC clusters (hollow diamonds, n = 22) assuming largest cell represents cluster resistance. (C) Time-lapse sequence of three-cell Brx-50 cluster treated with 10.0 µM focal adhesion kinase inhibitor 14 dissociating into single cells within 7-µm channel at 20 cm H2O. (D) Constriction disruption efficiency of Brx-50 clusters preincubated with 0.1, 1.0, or 10 µM focal adhesion kinase inhibitor 14 (FAK I-14) or paclitaxel (PTX) for 24 h vs. vehicle controls. At least three device replicates were conducted per case with 15 or more clusters per replicate. (E) Time-lapse images (Left) showing transplanted Brx-50 cluster transiting through dorsal aorta of 3-d postfertilization Tg(kdrl:mCherry) zebrafish with fluorescently labeled vasculature of a different, but representative, animal (right). Numbers and arrows indicate three clusters in transit; cluster 1 transitions from dorsal aorta to caudal vein in frame iv. (F and G) Cytoplasmic (Left) and nuclear (Right) stained Brx-50 clusters in single file: (F) two-cell cluster in mandibular arch vessel and (G) three-cell cluster in intersegmental vessel (arrows indicate distinct cells or nuclei). (Scale bars: 50 µm in frames A, C, and E; 10 µm in frames F and G.)
Drugs Disrupt Clusters in Transit.
Computational simulations suggested that weakening cell–cell interaction energies could dissociate clusters in transit (Fig. 2B). To test this hypothesis, Brx-50 patient cultured CTC clusters were treated with 0.1, 1.0, or 10.0 µM FAK inhibitor 14 (FAK I-14), a selective small molecular inhibitor of focal adhesion kinase (involved in cell–matrix adhesions) up-regulated in many tumors (34) or paclitaxel (PTX), a commonly used chemotherapeutic agent that has been shown to weaken cell–cell adhesions (35), for 24 h before transit through 7-µm capillary constrictions at 20 cm H2O. None of the drug-treated clusters were observed to undergo significant dissociation or loss of viability vs. vehicle controls before introduction into capillary constriction devices, suggesting that, although these compounds are known to induce apoptosis, that programmed cell death was not primarily responsible for observed effects. After entering capillary constrictions, drug-treated clusters were disrupted into singlets and smaller aggregates (Fig. 4C and Movie S14) in a similar manner predicted by computational simulations (Fig. 2B). Cultured CTC clusters treated with 1.0 µM or greater FAK I-14 or PTX showed statistically significantly greater probabilities of disruption vs. control clusters (FAK I-14: 1.0 µM, 18.1 ± 4.9%, P < 0.05; 10.0 µM, 32.4 ± 7.6%, P < 0.0001; PTX: 1.0 µM, 40.1 ± 6.2%, P < 0.0001; 10.0 µM, 43.2 ± 3.1%, P < 0.0001, vs. control, 9.2 ± 2.6%) (Fig. 4D).
CTC Clusters Transit Through Capillary-Sized Vessels.
To explore the behavior of CTC clusters in capillary-sized vessels, cultured human CTC clusters (Brx-50) tagged with GFP and nuclear stained with Hoechst 33342 were transplanted into the circulation of Tg(kdrl:mCherry) transgenic zebrafish embryos 3 days postfertilization. Over 120 CTC clusters transplanted into the circulation of 51 independent animals were observed to transit through the comparatively wider dorsal aortas and caudal veins (Fig. 4E and Movie S15) as well as narrower vessels such as the aortic arches (Movie S16), branchial arches (Movie S16), mandibular arches (Fig. 4F), and intersegmental vessels (Fig. 4G and Movie S17). Because individual zebrafish vessels, unlike engineered microfluidic constrictions, vary greatly in diameter (36) and cannot be practically set to desired intravascular pressures, cluster velocities in zebrafish could not be directly compared with those within capillary constrictions. However, CTC clusters remained viable (as determined by membrane impermeable fluorescent molecule localization) and exhibited similar single-file reorganization behavior as in vitro counterparts (Fig. 4 F and G).
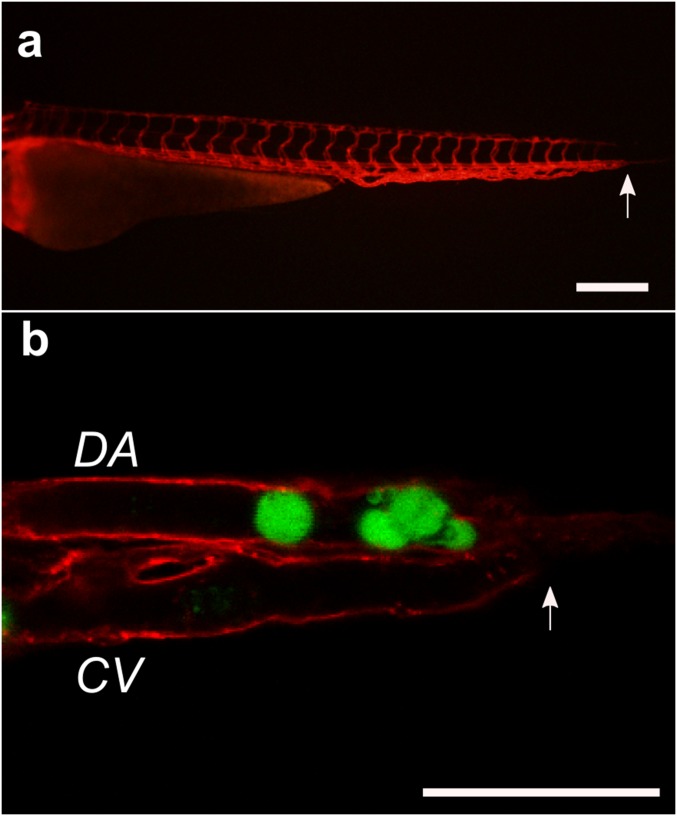
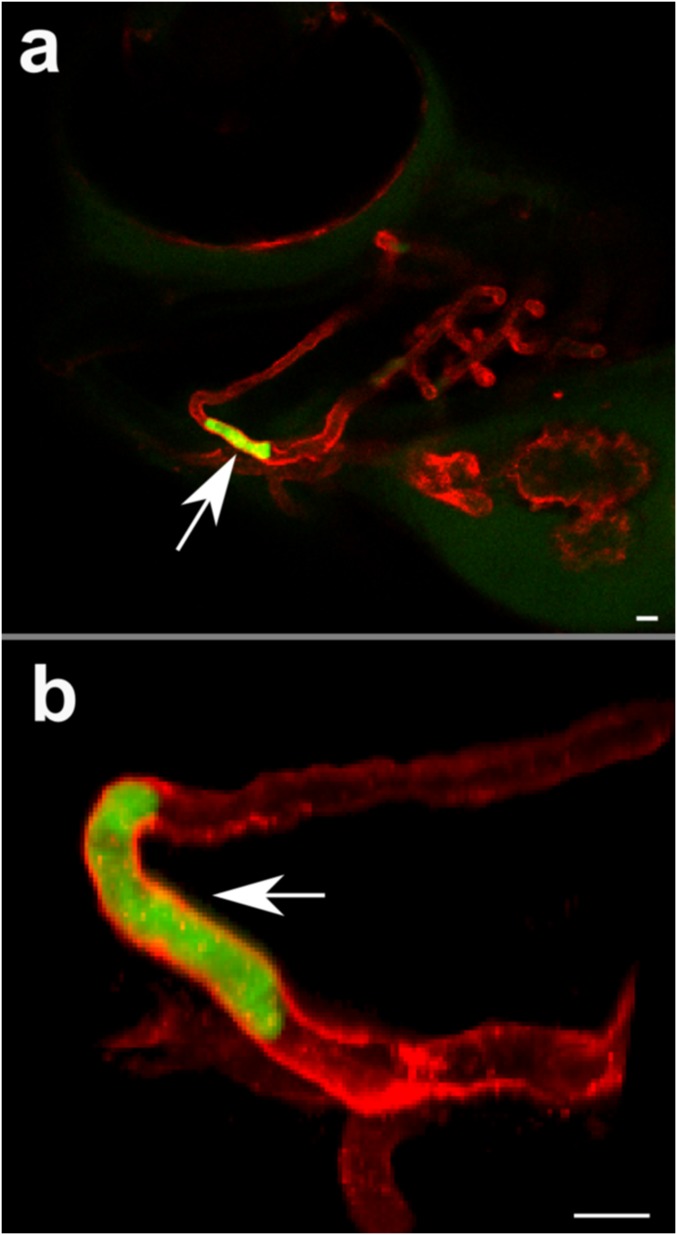
An interesting observation was that many CTC clusters that entered the dorsal aorta were observed to deposit in the caudal vein plexus (Fig. S8), directly upstream of a sharp 180° turn in the circulation where the dorsal aorta feeds into the caudal vein, a geometry not present in human capillaries. In addition, CTC clusters that appeared to have stopped within the vasculature were observed to have transited from apparent occlusion sites over minutes to hours (Fig. S9), suggesting the potential for reinitiation of cluster transit after occlusion and/or a slow “creeping” transit behavior. This observation may explain the reportedly short circulating half-lives of CTCs (37) and CTC clusters (9) because increased residence times within capillaries may inhibit/delay their detection or sampling from larger vessels. Further studies are needed to explore these phenomena.
Fig. S8.
(A) Sagittal view of 3-d postfertilization Tg(kdrl:mCherry) transgenic zebrafish before transplantation. Arrows indicates where sharp “U turn” of blood occurs. (Scale bar: 250 μm.) (B) Xenotransplanted GFP-tagged Brx-50 cultured CTC cluster and singlet (green) occluding at the caudal end of the zebrafish where the dorsal aorta (DA) terminates and the caudal vein (CV) begins. (Scale bar: 50 μm.)
Fig. S9.
(A) Sagittal view of head of 3-d postfertilization Tg(kdrl:mCherry) transgenic zebrafish showing transplanted human CTC cluster (white arrow) transiting through mandibular arch. (B) Close-up image of same transplanted CTC cluster (white arrow) showing displacement of cluster over time. Photomicrographs were captured less than 10 min apart. (Scale bar: 50 μm.)
Discussion
In contradiction to the decades-held assumption that CTC clusters are incapable of transiting through narrow vessels (16), this work is to our knowledge the first direct evidence that CTC clusters can traverse capillary-sized constrictions and blood vessels under physiological conditions. Even in whole blood, cultured CTC clusters successfully transited through capillary constrictions with over 90% efficiency. Clusters of both mesenchymal (cultured breast cancer and MDA-MB-231) and epithelial (primary melanoma patient and LNCaP) cell phenotypes exhibited similar transit behaviors. These results are supported by both computational simulations, which verified that this behavior was favored at physiological cell–cell interaction energies, and by in vivo xenotransplantation studies. Zebrafish embryos were chosen as model organisms for transplantation because they have ∼5- to 10-µm-diameter one-cell-thick blood vessels that are close analogs of human capillaries (36), have conservative pressure drops across their circulation [∼10–100 times lower than that across human capillaries (29, 38)], and, unlike mouse or rat models, are optically transparent allowing for whole-organism imaging of transgenically labeled vasculature. The remarkable ability of CTC clusters to transit through capillary-sized vessels suggests that the term circulating tumor “microemboli” may be a misnomer and that the dissemination of CTC clusters to distant organs may contribute to their greater metastatic potential.
The key to CTC cluster transit through narrow blood vessels appears to be their ability to rapidly and reversibly unfold into single-file chains through selective cleavage of intercellular adhesions. This unfolding behavior is critically important for successful transit because, instead of acting as cohesive resistive units, CTC clusters act as individual cells in series, which significantly reduce their overall resistances to flow. Because of the timescales at which clusters unfold to enter constrictions and reorganize after exiting (approximately milliseconds to seconds), the responses of CTC clusters are likely dominated by the state of existing intercellular adhesions and cytoskeletal elements. An interesting area of investigation is whether the physical forces exerted on clusters during transit may contribute to the greater metastatic ability of CTC clusters vs. singlets (6–9). For example, mechanotransduction pathways involved in the metastatic progression of cancer cells (39, 40) may provide CTC clusters with biophysical cues that promote the extravasation, migration, and eventual colonization of new tumors.
Finally, strategies that interfere with cell–cell or cell–matrix adhesions may lead to the disruption of clusters in constrictions where high intravascular shear forces are present. Because of the greater metastatic potential of clustered circulating tumor cells than singlets (9) and of larger clusters vs. smaller clusters (7), this strategy may be an effective method of reducing the probability of metastasis, the leading cause of cancer mortality worldwide.
Materials and Methods
Single CTCs and CTC clusters containing ∼2–20 cells of patient (obtained with informed consent according to Massachusetts General Hospital Institutional Review Board Protocol 05-300) and cancer cell line origins were introduced into 5- to 10-µm microfluidic constrictions under pressure drops of 7–83 cm H2O at 37 °C and analyzed using custom Matlab scripts to calculate cell/nuclear sizes (Fig. S10) and velocities. Human cultured CTC clusters were introduced into the bloodstream of 3 d postfertilization Tg(kdrl:mCherry) transgenic zebrafish (Massachusetts General Hospital Subcommittee on Research Animal Care Protocol 2011N000127) for observation. Complete materials and methods are available in Supporting Information.
Fig. S10.
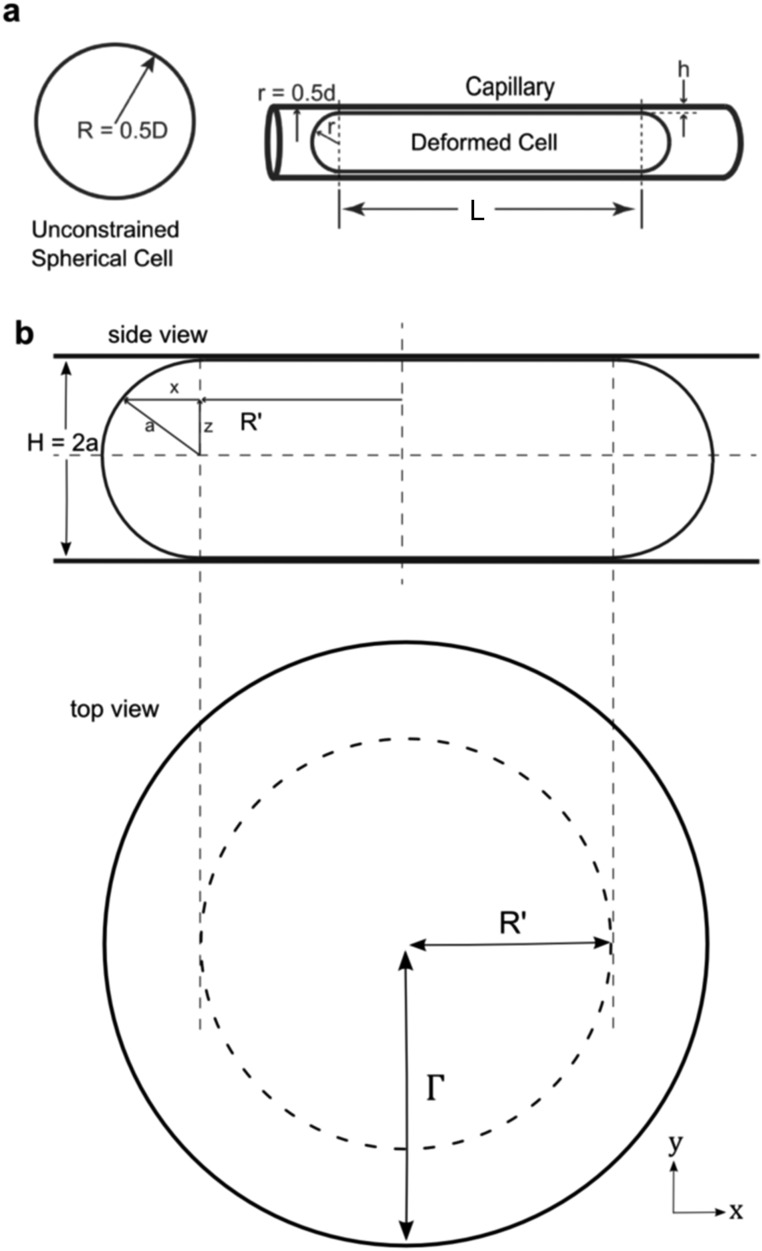
(A) Definition sketch for scaling analysis of cell transit velocity through capillaries. (B) Side-view and top-view schematics of droplet constrained in the entrance region of devices before entering capillaries. Parameters used to determine unconstrained cell and nuclear spherical volumes.
SI Materials and Methods
Microfluidic Capillary Constriction Fabrication.
Devices were fabricated using standard soft lithography techniques. Briefly, two-layer masters were fabricated by spin coating SU-8 negative photoresist (Microchem) onto silicon wafers. Coated wafers were patterned using UV photolithography to define masters for devices consisting of 16 parallel microchannel “capillary constrictions” of either 5.0 × 5.0 × 223-, 7.0 × 7.0 × 987-, 10.0 × 10.0 × 4,000-, or 30.0 × 30.0 × 4,000-µm (width by height by length) geometries coupled to common fluidic inlets and outlets 30 µm high and 50 µm wide. Differences in the lengths of constrictions were designed so that the different capillary constrictions had equivalent hydraulic resistances. The heights of SU-8 features were verified to be within ±10% of set points using a surface profilometer (Dektak ST System Profilometer; Veeco Instruments). Polydimethylsiloxane (PDMS) prepolymer mixed with its cross-linker (Dow Corning) at 10:1 ratio (wt/wt) was poured onto silicon master molds, degassed, and cured at 65 °C for 24 h. Cured PDMS replicas were removed from the molds and punched using 2.5- or 1.2-mm Harris Uni-Core biopsy punchers at the inlet (to serve as the reservoir) and outlet, respectively. Punched PDMS slabs were ultrasonicated (Branson 200; Branson Ultrasonics) for 3 min in isopropanol, oxygen plasma treated at 300 mmTor O2 at 50 W for 35 s, and bonded to glass slides to form microfluidic devices. Devices were filled with 10 µL of PBS containing 3% (wt/vol) BSA (Sigma-Aldrich) for 60 min at room temperature and then flushed with 10 µL of PBS. One-meter-long sections of TYGON flexible plastic tubing with an inner diameter of 0.25 mm were then coupled to 10-mL polypropylene syringes (Becton Dickinson) using 22-gauge needles. Tubing and syringes were primed by filling with 2–3 mL of PBS. The uncoupled tubing ends were then interfaced with outlet ports of devices and plungers removed from syringes before operation.
Cell Isolation, Culture, and Reagents.
Reagents for cell isolation, culture, and preparation were obtained from Life Technologies unless noted otherwise. LNCaP (ATCC), MDA-MB-231-LM2-GFP, and MDA-MB-231-LM2-mCherry (9) (lung-metastatic variants of MDA-MB-231 engineered to expressed green fluorescent protein or mCherry, respectively) cells were maintained in RPMI-1640 media supplemented with 10% (vol/vol) FBS and 1% penicillin/streptomycin (10,000 units/mL) by subculturing every 3–4 d using 0.25% trypsin-EDTA. HUVEC cells (Lonza) were maintained in EBM-2 basal media (Lonza) supplemented with EGM-MV bullet kit (Lonza). For experiments requiring clusters containing both GFP and mCherry variant MDA-MB-231-LM2 cells, a 1:1 mixture of each variant was seeded and harvested for use 2 d later.
Blood specimens were obtained after informed patient consent and per Institutional Review Board Protocol 05-300 at the Massachusetts General Hospital. Ex vivo cultured CTC clusters were isolated and cultured as previously described (14). Briefly, CTCs and CTC clusters were isolated from blood biopsies of metastatic breast cancer patients using antibody affinity capture (41) and engineered to express GFP and luciferase (14). Cultured CTC clusters were grown as multicellular clusters in suspension in ultralow attachment six-well plates (Corning) in RPMI-1640 media supplemented with 20 ng/mL epidermal growth factor, 20 ng/mL basic fibroblast growth factor, 1× B-27 supplement, and 1× antibiotic–antimycotic at 37 °C, 5% CO2 and 4% O2. Medium was exchanged every 3–4 d.
Primary patient CTC clusters were isolated from blood samples of 10 metastatic malignant melanoma cancer patients undergoing treatment using the CTC cluster capture chip as previously described (30). Briefly, 3- to 4-mL liquid blood specimens were flowed against a network of triangular microposts at a rate of 1.25 mL/h on ice to capture clusters followed by a wash of PBS at the same flow rate. Extraction was conducted by reversing flow into serum-free media at 500 mL/h. Extracted samples were stained with 5% (vol/vol) Alexa Fluor 488 anti-NG2 (Becton Dickinson), 5% (vol/vol) Alexa Fluor 488 anti-CD146 (BioLegend), 2% (vol/vol) Alexa Fluor 488 anti-CD45 (Becton Dickinson), and 16.2 µM Hoechst 33342 in 1% (wt/vol) BSA in PBS for 10 min on ice followed by centrifugation at 200 × g for 4 min and gentle resuspension of the pellet in 125 µL of PBS. Isolated primary patient specimens were immediately used for CTC cluster transit experiments (described below).
Cell and CTC Cluster Preparation.
Suspensions of LNCaP, MDA-MB-231-LM2-GFP, and MDA-MB-231-LM2-mCherry, HUVEC cell line clusters and single-cell suspensions were obtained when cells were ∼80% confluent in 25-cm2 tissue culture flasks (Corning) by washing twice with PBS, incubation with 0.05% trypsin-EDTA for 5 min, followed by neutralization with serum-containing media, centrifugation at 300 × g for 5 min and gentle resuspension of the pellet in 1 mL of staining solutions for 10–15 min. The staining solution was composed of 4.0 µM calcein-AM, 5.0 µg/mL CellMask Deep Red, and/or 16.2 µM Hoechst 33342 in PBS as needed. Single-cell suspensions were obtained in a similar manner as above, except 0.25% trypsin-EDTA was used and suspensions were mechanically dissociated after neutralization.
Suspensions of cultured CTC clusters were prepared by collecting and applying gentle mechanical dissociation to 500 µL of cultured CTC clusters collected before media exchange, which resulted in a mixed population of individual CTCs and CTC clusters. Cells were centrifuged at 200 × g for 5 min, and the pellet was resuspended in 500 µL of PBS containing 16.2 µM Hoechst 33342 for 10 min followed by addition of 2 mL of PBS, centrifugation (as above) and resuspension of the pellet in 200 µL of PBS. Two microliters of this suspension, containing a mixture of single cells and clusters, was then spiked into 18 µL of fresh whole blood obtained from healthy male volunteers using BD Microtainer Contact-Activated Lancets (Becton Dickinson).
Formation of Endothelial Cell-Coated Microchannels.
The 30.0 × 30.0 × 4,000-µm (width by height by length) microchannel devices, fabricated as described above, were rounded and narrowed as previously described (42, 43). Briefly, uncured PDMS prepolymer was prepared as described above and mixed with equal parts Xiameter PMX-200 1 cS silicone oil (Dow Corning). Diluted prepolymer was loaded into devices heated on a hot plate at 100 °C for 10 s before by applying a negative pressure of 75 kPa to the outlet using a vacuum pump for 2–3 min. The negative pressure was then reduced to 17 kPa while simultaneously heating on a hot plate at 100 °C for 5 min. After cooling, the walls of rounded and narrowed channels were then coated using 10 µL of 1 mg/mL fibronectin solution in sterile distilled water for 60 min at 37 °C before flushing twice with 10 µL of sterile PBS. HUVEC cells were collected as described above, counted using a hemocytometer, and then resuspended at a concentration of ∼10.0 × 10⁶ cells per mL in EBM-2 complete media before being introduced into microchannels, and incubated at 37 °C/5% CO2 for 30 min. HUVEC-coated microchannels were then fed with syringes filled with EBM-2 complete media interfaced to outlets (as described above) raised 5 cm above the microchannels to generate flow in the reverse direction from loading/migration for 24 h at 37 °C/5% CO2 before use. Final constriction diameters of cellularized microchannels varied from ∼10 to 22 µm across the lengths of individual channels due to the presence of cellular nuclei along channel walls.
Capillary Constriction Transit Experiments.
Individual cells and CTC clusters were prepared (as described above) and 7- to 20-µL suspensions were loaded into the inlet reservoirs of microfluidic devices (prepared as described above). With the inlet exposed to the atmosphere, the end of the tubing connected to the outlet was lowered 7–83 cm below the height of the device. The resulting hydrostatic head provided a pressure differential across the capillary constriction of the devices between 7 and 83 cm H2O (taking into account noncapillary loses in the inlet and outlet regions). A height differential of 33 or 83 cm was used for LNCaP and MDA-MB-231-LM2 cells, whereas a differential of 7, 10, or 20 cm H2O was used for primary patient CTC clusters and cultured CTC clusters.
Multicellular clusters within device reservoirs were considered CTC clusters if two or more cells within an aggregate were positively stained for NG2 and/or CD146, negative for CD45, and contained multiple Hoechst-stained nuclei. Identified primary patient CTC clusters were gently guided from reservoirs to capillary constrictions by micromanipulation (CellTram Vario; Eppendorf) using a 8-µm inner-diameter borosilicate glass capillary (Eppendorf) set to a 80° angle incident to the device surface. The minimal required pressure was used to physically relocate clusters to constrictions without significant cell deformation or aspiration of cells into the glass capillaries. CTC clusters and individual cells traversing the capillary region of the device were then monitored using an inverted fluorescence microscope with automated stage (Eclipse 90i; Nikon) under 4×, 10×, and 20× magnification. For multifluorescent imaging and to observe the reorganization of clusters after exiting capillary regions, fluid flow was selectively and temporarily stopped by raising the free end of the outlet tubing to the same height as the device.
Experiments for examining red blood cell (RBC) morphologies during transit were conducted as described above, except 10 µL of whole blood from a healthy donor was diluted with 90 µL of 5 mM EDTA in PBS before introduction into 5- and 7-µm capillary constriction devices operating at 20 cm H2O. Transit behavior was recorded using a Phantom, version 4.2, high-speed camera (Vision Research) capturing 2,200 frames per second, and videos were encoded at 5 frames per second. All transit experiments were conducted at 37 °C using a heated microscope stage (WIS1; Carel) according to the manufacturer’s recommended protocol.
Transit Video Analysis.
Analysis of the transit of individual cells and CTC clusters was conducted using custom-developed Matlab scripts. The protocol is summarized in Fig. 3A. Briefly, all frames of a movie showing fluorescently tagged cytoplasmic or nuclear fractions of cells/clusters traversing the capillary region of a device were compiled to generate a heat map of event frequencies. Regions of interest defining individual capillary regions plus sections of the entrance and exit channels were drawn and events passing through were identified by intensity thresholding. The planar x–y area of cell/nuclear events, either passing individually or within multicellular clusters, were recorded in the entrance region before events encountered the capillary constriction. The lateral x position of the leading and trailing edges of fully elongated events traveling through the capillary region were plotted vs. time, and the slopes of the leading and trailing edges were averaged to calculate the event velocity. All events were manually checked one-at-a-time to verify no apparent errors in event area or velocities were recorded.
The equivalent unconstrained spherical diameters of cell/nuclear events were calculated from still frames of videos in the entrance region of channels before cells entered the capillary constrictions. In this region, cells were constrained in the z axis to the height of the constriction (5, 7, or 10 µm) but were allowed to deform in the x–y plane. Cells and nuclei assumed flattened “pancake-like” geometries, cylinders with bulging annuli (Fig. S10B). Unconstrained spherical volumes (V) were calculated using Eq. S1:
| [S1] |
where a is half the device height and Γ is the apparent disk radius observed from above (see above for derivation of Eq. S1).
The velocities of cell and nuclear events were plotted vs. the ratios of equivalent spherical event diameters to constriction sizes. To estimate the power law relationship between cell velocities and sizes, the velocities and diameter ratios of single cells presenting a diameter ratio between 1.6 and 3.6 were log-log transformed and fit with a linear least-squares best-fit regression to determine power law relations.
The equivalent hydrodynamic size of clusters was then plotted assuming the clusters behave in one of three manners: (i) As cohesive resistive units (strong adhesive interactions). In this case, the total volumes of individual cells were summed and this volume converted to an equivalent spherical volume of a single larger cell event. (ii) As individual cells in series (moderate adhesive interactions). In this case, the area of each individual cell/nuclei within a cluster was converted to an equivalent spherical volume. The total equivalent spherical cluster diameter was then calculated assuming a fifth power law exponent according to Eq. S2:
| [S2] |
where Dseq is the equivalent spherical cell/nuclear diameter of the cluster assuming series behavior, and D1–DN are the equivalent spherical cell/nuclear diameter of cells 1 to N within a given cluster, where N is the total number of cells in the cluster. (iii) As the largest cell within the cluster (moderate adhesive interactions). In this case, the hydrodynamic resistance of a cluster is approximated as that of its largest cell.
Analysis of velocity vs. the ratio of cellular/nuclear size to constriction size was sufficient to normalize cells transiting through different constrictions sizes for comparison (assuming other parameters such as pressure remained equal). However, to compare events transiting under potentially different pressures, exhibiting different elasticities and within different fluid viscosities, we derived a dimensionless number “transcapillary conductance” (Tc) from scaling laws:
| [S3] |
where U is cell velocity, E is cell elastic modulus, µ is fluid viscosity, ΔP is capillary driving pressure, and d is constriction diameter. For derivation of Eq. S3, see Scaling Analysis and Transcapillary Conductance Derivation. In this analysis, E was set at 250 Pa and µ at 7.0 × 10⁻⁴ Pa⋅s for PBS buffer and 3.0 × 10⁻³ Pa⋅s for whole blood.
Least-square estimated power law exponents and regression slopes were compared using two independent-sample two-tailed Student’s t test with significance thresholds set at 0.05. For regression lines with no statistical difference between slopes, adjusted means were determined by assuming a common slope and compared using Student’s t test (as above).
Drug-Induced Cluster Dissociation.
Brx50 breast cancer patient-derived cultured CTC clusters were cultured as described above. One day before splitting, cultures were treated with 0.1% (vol/vol) dimethyl sulfoxide (vehicle control), 0.1, 1.0, or 10.0 µM paclitaxel (PTX) (Sigma-Aldrich), or 0.1, 1.0, or 10.0 µM focal adhesion kinase inhibitor 14 (FAK I-14) (Sigma-Aldrich) and incubated for 24 h at 37 °C/5% CO2/4% O2. Treated CTC clusters in complete media were then directly introduced into capillary constriction devices as described above and observed transiting through 7-µm capillary constriction devices under 33 cm H2O at 37 °C. A cluster was considered to have been disrupted if the cluster broke into two or more segments during transit by visual observation of cytoplasmic GFP. For each condition, three or more device replicates were used with 15–55 clusters analyzed per replicate. Statistical analyses were conducted using two-sample two-tailed Student’s t tests with a threshold for significance set at 0.05.
CTC Cluster Transit in Zebrafish Circulation.
Zebrafish studies were approved by the Massachusetts General Hospital Subcommittee on Research Animal Care under Protocol 2011N000127. Brx-50 cultured CTC clusters were prepared as above except concentrated to a final concentration of 5,000 clusters per mL in PBS with 0.1% (wt/wt) BSA and 2% (wt/wt) polyvinylpyrrolidone (PVP40; Sigma-Aldrich). Cultured CTC cluster suspensions were back loaded into a fine glass capillary needle (World Precision Instruments; TW100-4), pulled on a Sutter P-1000 Micropipette puller, using a microloader pipette tip (Eppendorf). The pulled glass capillary was positioned onto a Narishge (model MN157) micromanipulator, and injections were performed at 30 psi using an air compressor and an Applied Scientific Instrumentation pressure Injector (MPPI-3). Three-day postfertilization Tg(kdrl:mCherry) zebrafish (44) were anesthetized using 168 mg/L Tricaine (MS-222; pH 7.5) and arranged on a 3% (wt/vol) agar-coated 10-cm Petri dishes and injected with a bolus of cells (2- to 10-nL total volume) into the pericardial space. Movies were acquired at 6.3 zoom, with an epifluorescent stereo microscope (MVX10; Olympus) fitted with an Olympus DP72 camera. For confocal images, anesthetized animals were embedded in 5% (wt/wt) methyl cellulose placed onto 35.0-mm glass-bottom imaging plates (P35G-0-10-C; MatTek) and imaged using an inverted Zeiss LSM 710 confocal microscope using the ZEN imaging software. Z-stack image series were acquired in the ZEN software (single-pass point scanning at 1.5 µm per step over 45.0 µm). Fluorescent imaging was completed using the following settings: GFP: excitation, 488 nm, and emission, 503–528 nm; mCherry: excitation, 633 nm, and emission, 650–750 nm; and DAPI: excitation, 405 nm, and emission, 410–496 nm. For Z-stack images, planes were merged based on maximum intensity.
Postcapillary Cluster Growth Analysis.
LNCaP and MDA-MB-231-LM2-GFP clusters were collected (as described above) and split into two equal fractions, each with ∼1 × 10⁵ clusters per milliliter. One fraction was transited through microfluidic capillary devices operated with a device hydrostatic head of 33 cm H2O (as described above). The outlet tubing was then removed from the device, and the contents of the outlet transferred by micropipette to one well of a 48 (tissue culture-treated)-well plate. This process was repeated three to four times until a total of 20 µL containing ∼2,000 clusters were introduced into the well. The other fraction was introduced into the inlet reservoir of the microfluidic capillary device, but no pressure was applied so no cells were transited. Similarly, the contents of the inlet were transferred to a different well, and this process was repeated until 20 µL were introduced. One milliliter of fresh complete RPMI-1640 media (as formulated above) was then added to each well and then incubated at 37 °C and 5% CO2 with one media exchange on day 4. Experiment conducted in triplicate. Representative photomicrographs were taken 60 min, 1 d, and 7 d after seeding using an inverted fluorescence microscope with automated stage (Eclipse 90i, Nikon) at 2× magnification.
Computational Simulation of Cluster Transit.
A coarse-grained computational model of clusters traversing the microfluidic capillary device was developed using a fully coupled lattice Boltzmann (LB)–immersed boundary method (31, 45). Fluid flow in the microchannel was modeled with a 3D, 19-velocity LB fluid. The lattice spacing (Δx) was chosen to be 1 μm, and the LB fluid state was described by the velocity distribution function ni(r, t) for velocity (ci) at lattice site (r) and time (t). The macroscopic quantities, mass density (ρ), momentum (ρu), and momentum flux (Π = ρuu) are the moments of ni.
The fluid velocity distribution functions were determined by modeling the fluid collision, momentum exchange, and propagation using the discrete Boltzmann equation, given by the following:
Lij is the collision operator linearized around the local equilibrium velocity distribution function njeq. njeq results from the second-order velocity expansion of the Maxwell–Boltzmann distribution. For pressure-driven flow, an external force bias niext was added to the velocity distribution of all lattice sites. The error of the LB method was of order (Δx2).
A pressure gradient of 0.178 MPa/m was applied across 5- to 10-µm capillary constrictions. Microchannel geometries were matches to those used in transit experiments (described above) and were set with no-slip boundary conditions. A closed network of beads and springs was used to model the membrane and cytoskeletal network of each cell with 642 beads and 1,280 triangular mesh faces on each spherical particle surface. The deformable particle model accounts for membrane elasticity, bending modulus, area dilatation modulus, and volume conservation.
Neighboring beads were connected with finitely extensible nonlinear elastic (FENE) springs, given by the following:
which was harmonic at small separation but restricted the separation to be smaller than the initial position l0. The stress (σ) was chosen to be Δx, l0 was chosen to be 3Δx, and the spring constant (k) chosen to be 0.17 Δε/σ2 where Δε was the simulation energy unit. The radius of a freely suspending sphere was set as R = 5.7 Δx. Bead positions on the spherical shell were acquired by triangle tessellation. A bending potential (Ubend) was imposed between all neighboring triangular faces, given by the following:
where θ is the angle between the normal vectors of neighboring faces and kbend is the membrane bending modulus. The particle elastic modulus (G = dfx/dx) was measured by stretching the particle in the small force linear force–extension (fx–x) response regime and found to be 0.7 Δε/Δx3, corresponding to the cell’s Young’s modulus of 250 Pa and within the range of reported elastic moduli of tumor cells (32). The interaction between cells was modeled with short-ranged potentials between the beads on the surface to capture the cell surface adhesion and repulsion. Beads on particle surfaces interacted according to the Lennard-Jones (L-J) potential (U):
where r is the distance between particles, σ is the distance for zero interparticle potential, and ε is the depth of the attractive energy well representing the intersurface attraction strength. rcut = 1.12 σ for beads on the same particle and rcut = 2.5 σ for beads on different particles. Ushift is added such that U(rcut) = 0.
The adhesion energy between cell surfaces was calculated from the total energy between all beads within the interaction range. The adhesive energies between cells were set at 1.5 × 10⁻⁴, 1.5 × 10⁻³, and 7.5 × 10⁻³ J/m2. Clusters containing four to eight cells were simulated with each cell volume equivalent to unrestricted spheres of 11.4-µm diameter. Model channel were constructed with repulsive beads on channel walls that repelled beads on model cell surfaces with the bead–bead repulsive potential.
SI Text
Expanded Multipressure Hydrodynamic Analysis.
In addition to the experiments examining hydrodynamics of cell/cluster transit at 33-cm H2O pressure in the main text (Fig. 3 B and C), MDA-MB-231 L2 GFP cells were also transited at 83 cm H2O through 5- and 7-µm constrictions for analysis. Cells transiting through 10-µm constrictions under the higher pressure traveled too quickly for accurate analysis using our camera and were not included in this analysis. The dimensionless number, transcapillary conductance (Tc) (derived below), represents the ease at which events are able to traverse a given constriction (higher is greater ease). Tc permits the comparison of the transiting behavior of cells at the different pressures. Single cells transiting at both pressures are plotted in Fig. S2A, demonstrating agreement between the transit behaviors at the different pressures using Tc (Fig. S4). In Fig. S2 B–D, clusters were plotted alongside single-cell data assuming that clusters behaved as (i) cohesive resistive units (total volumes summed), (ii) the largest cell within a given cluster, and (iii) individual cells in series (resistances of constituent cells summed), respectively. Similar to Fig. 3C, clusters plotted as cohesive resistive units (Fig. S2B) overestimated predicted transit conductances. When clusters were plotted as individual cells in series (Fig. S2D), cluster transit most closely matched single-cell data. Plotted as the largest constituent cell (Fig. S2C), clusters underestimated predicted transit conductances. This underestimation is due to numerous cluster events containing high numbers of cells transiting through 7-µm channels at 83 cm H2O (Fig. S3), which skewed the dataset. In the 33-cm H2O pressure case (Fig. 3C), total cluster resistance could be appropriately reduced to the largest cell within the cluster because conductance was highly sensitive to small differences in the sizes of individual cells (Fig. S7). This assumption does not hold true for cases in clusters that contain large numbers of cells with similar sizes. Therefore, in the generalized case, cluster hydrodynamics appears to be most accurately modeled as individual cells transiting in series.
Fig. S3.
Compositions of clusters. Velocities vs. diameter ratio for individual cells within clusters of MDA-MB-231 cells transiting through capillary constriction devices analyzed in Fig. S2. Each dot represents an individual cell. Lines connect individual cells within clusters. A series of lines and dots together represent a single cluster.
Posttransit Cluster Reorganization and Proliferation.
To study whether the transit process affected the viabilities and proliferative abilities of CTC clusters, cancer cell (Fig. S5) and cultured CTC clusters (Fig. 4A) were observed exiting 7-µm capillary constrictions transiting under 33 cm H2O. Individual cells within CTC clusters rapidly contracted from elongated to rounded morphologies within ∼10–30 s of exiting constrictions (Fig. 4A), and CTC clusters did not experience catastrophic membrane integrity failure during transit as determined by fluorescent dye localization (Fig. 2 A, D, and F, and 4A, Fig. S5, and Movies S2, S3, S8, and S12). Clusters rapidly reformed within into “typical” circular cluster-like morphologies with numerous intercellular adhesions between multiple cells (Fig. S5C). MDA-MB-231-LM2-GFP and LNCaP clusters that traversed constrictions were collected, seeded into fresh media, incubated, and observed over 7 d (Fig. S6). Compared with untreated controls, transited clusters exhibited indistinguishable rates of adhesion and proliferation. The morphologies of transited clusters were also indistinguishable from untreated clusters 1 h after seeding.
Characterization of RBC Transit Morphologies.
The discocytic shapes of RBCs are known to deform in response to the parabolic pressure profiles within capillaries (46). The morphologies of RBCs transiting through engineered capillary constrictions were examined to determine how closely blood cell shapes matched in vivo observations. RBCs transiting under 20-cm H2O pressure, assumed “parachute-like” morphologies in 7-µm constrictions (Movie S1) and “torpedo-like” morphologies in 5-µm constrictions (Movie S2). These shapes were indistinguishable from the shapes of RBCs transiting through 7- and 4-µm-diameter capillaries (46), respectively. This suggests that engineered capillary constrictions were relevant models of the hydrodynamic fluid environment within true capillaries.
Scaling Analysis and Transcapillary Conductance Derivation.
What follows is a highly simplified model of the transit of cells through capillaries. The aim was not to derive an exact law, but to use some simplifications and dimensional arguments to discover important parameters and restrict the functional form of the experimental data.
The model problem was of an elastic spherical cell of radius R forced through a cylindrical capillary of radius r by an applied pressure difference ΔP. The objective was to determine velocity, U, once the cell has fully entered the capillary. Fig. S10A is a definition sketch used for the scaling analysis.
The suspending liquid was taken as a Newtonian fluid with properties similar to water. The scale of the resulting fluid motion was in the regime where the Reynolds number is very small. Because this dimensionless parameter was small, fluid density could be ignored and dynamic viscosity, µ, was the defining fluid parameter (47).
The overall mechanical responses of cells are typically viscoelastic (32). The elastic component of the internal stress of the cell was determined by the instantaneous deformed state whereas the viscous component of the stress was determined by the history of deformation. Cells fully in the constriction transiting at constant velocity were experimentally observed to not further deform. The viscous component of the cell’s mechanical model was therefore assumed to be negligible (in the limit of long channels) when determining the steady transit velocity. The effective elastic modulus, E, was assumed to be the dominant mechanical property. The true mechanical at such large deformations certainly did not follow that of a linearly elastic solid of constant modulus.
In dimensional terms, the steady-state velocity was assumed a function of five parameters:
where f is an unknown function, and the exact nature of the elastic modulus is unknown.
Deformation.
Before entering the constriction the spherical cell had total volume, V, given as follows:
Once forced inside the capillary, we assumed that the deformed shape of the cell could be approximated as a cylinder of length L, with a spherical cap of radius r on both ends (Fig. S10A). The volume of this deformed shape was as follows:
Because cell volume was assumed to be conserved, the dimensionless length of the cylindrical section of the deformed cell was as follows:
From experimental images, this approximation of the true cell shape appeared reasonable (Figs. 1C and 2A). Even if the shape was not precise, the deformation field could be described by a single dimensionless geometric parameter, R/r, the relative size of the cell to the capillary.
Mechanical stress.
The average stress in the cell (σ) was a function of the deformation field and the material property (E). Because the cell was not necessarily a linearly elastic solid, the elastic modulus can be a function of the deformation itself, namely E(R/r). In dimensionless terms, the average stress must follow a form,
Where ɛ is an unknown function which depends upon the details of the deformation of the cell and E0 is the small strain constant elastic modulus. The function ɛ incorporates effects due to large deformation or nonlinear elasticity. It is conceivable that the functional form of ɛ may be very different for different types of cells. Although the function ɛ is very difficult to know, the argument here is that, when the deformed shape is constant, σ/E0 is only a function of R/r for a given cell type. In the limit of small deformations, the function ɛ would become the strain.
Fluid lubrication.
As the cell traversed the capillary, we assumed that a thin lubricating fluid layer of thickness, h, was present between the elongated cell and the capillary wall. The viscous shear stress, τ acting on the cell from this lubricating fluid layer was given by classic solution for Couette flow (47):
where µ is the dynamic viscosity. The total shear force, T, is the stress multiplied by the total area over which it acts,
In using this model for the viscous stress, we assume the following:
-
•
h is a constant across the length of the cylindrical section, or h is an appropriately averaged value.
-
•
h « r, the model approximates two sliding parallel plates and do not need to account for the curvature around the capillary.
-
•
Any leak back flow due to the pressure difference from one end of cell to the other is small in terms of the additional viscous stress (47).
When the deformed cell was moving at constant speed, the total shear force must balance the force due to applied pressure, ΔP, across the cell,
Rearranging for velocity,
The value of h is unknown and must come from the coupling of the fluid and cell mechanics problem. Although the true value is complex, the order of magnitude of h can be estimated using results from fluid lubrication theory (47). A classic problem in lubrication theory is the slider bearing, where a block slides over a solid surface with a thin fluid gap. The gap height varies linearly over the length of the block. When the block slides at constant speed, the pressure inside the fluid layer increases dramatically and provides a lift force on the block. The excess pressure Pex inside a thin fluid layer can get very high. Although the detailed calculation of the pressure inside the lubrication layer requires knowing the variation in h and thus the shape of the cell in the capillary, the excess pressure in a lubrication layer can be estimated to be on the order of magnitude of the following:
This scaling estimate is similar to a more complete analysis of classic problems for flow of red cells in capillaries (48).
Coupled flow and cell mechanics.
In the coupled problem of cell mechanics and fluid lubrication, the local pressure in the fluid gap must match the local stress of the deformed cell along the length of the cell. We can estimate the scaling of this force balance by equating the average stress and the excess pressure,
Solving for the gap thickness,
Combining this expression for the gap height with our expression for cell velocity, we obtain the following:
which can be written as follows:
Importantly, everything on the right-hand side of the above equation is a function of R/r only.
Although the function ɛ(R/r) is difficult to know, the magnitude of the strain must provide some measure of right order of magnitude. The end-to-end length of the deformed cell is L + 2r compared with the initial length of 2R. The strain is approximated as follows:
The true strain for a deformed sphere is a more complicated field, but the above expression is appropriate for an order of magnitude estimate.
Substituting in the expressions for ɛ and our previous expression for L/r and we obtain a dimensionless number we define as transcapillary conductance (Tc):
which for large values of R/r yields a power law for velocity scaling as (R/r)−5.
The utility of the above model is not as an exact result, but indicates the scaling law and provides some guidance for plotting the experimental data in dimensionless terms. The model indicates that, for a given fluid, pressure drop, and cell type, Tc can be plotted as a function of the dimensionless cell size R/r (or D/d),
The scaling model points to a few important predictions about the cell velocity, namely, the following:
-
•
Velocity depends strongly on R/r. A power law in the range of (R/r)−5 could reasonably be expected. Stronger dependencies could certainly occur when one considers uncertainty of the mechanics of cells under large deformations.
-
•
Velocity scales as the square of the pressure difference.
-
•
Velocity is inversely proportional to the fluid viscosity and elasticity of the cell; i.e., a stiffer cell or more viscous fluid leads to lower velocities.
Finally, we should note that the above analysis assumed that the cell was transiting through a cylindrical tube, whereas in the experiments the cross section of the tube is square. Although we would expect the square shape to influence the details, we do not expect the square channel to change the basic scaling and dimensional analyses presented here. Furthermore, experimental and theoretical data have demonstrated that there are only small differences between pressure signatures CTCs transiting through square and circular cross-section channels (49).
Derivation of Unconstrained Spherical Volumes.
Images of the cell before entrance into the constriction were used to calculate unconstrained cell diameters. Within the entrance region of the devices, cells were constrained in the z axis (vertical) but unconstrained in the x and y axes. Cells/nuclei were assumed to form a cylindrical shape with a “bulge” consisting of a sphere revolved around a radius R′ (Fig. S10B). The radius of the half-sphere, a, was taken as one-half of the channel height, H. From above, cells appeared as disks of apparent radii Γ = R′ + a.
The area of a slice in the z plane is as follows:
Because x = (a2 – z2)1/2,
The total volume is as follows:
The first term of the integral simplifies to the following:
which is the volume of the inner solid cylinder of radius R′. The second term in the integral is as follows:
The third term is as follows:
Therefore, the total volume is as follows:
Note that, if cells/nuclei were simply assumed to take squished cylinder geometries, the computed volumes not have noticeable differences when a/R′ « 1. Experimentally, we measured Γ from the images of the cell in the entrance region and used the known value of a to estimate the cell volumes.
Supplementary Material
Acknowledgments
We thank E. Reategui, X. Hong, S. Pan, D. Miyamoto, N. V. Jordan, M. Choz, M. Zeinali, R. Oklu, T. Todorova, and L. Sequist for helping with patient sample acquisition, coordination, and processing. We are grateful to A. Khankhel and A. Chandrasekaran for microfabrication of masters; C. Angpraseuth, R. Desai, and R. O’Keefe for device fabrication; and X. Jiang, A. Stoddard, J. Edd, F. Ellett, S. Angione, N. Aceto, L. Libby, and C. Mackenzie for helpful discussions. We are indebted to O. Hurtado for microfabrication guidance. This work was financially supported by NIH Grant F33-GM109574 (to B.D.S.), Howard Hughes Medical Institute (D.A.H.), Alex Lemonade Stand Foundation (D.M.L.), Live Like Bella Foundation (D.M.L.), NIH Grant R24OD016761 (to D.M.L.), NIH Grant P41 EB002503-11 (to M.T.), and NIH National Institute of Biomedical Imaging and Bioengineering Quantum Grant (to M.T. and D.A.H.).
Footnotes
The authors declare no conflict of interest.
This article is a PNAS Direct Submission. K.K. is a guest editor invited by the Editorial Board.
This article contains supporting information online at www.pnas.org/lookup/suppl/doi:10.1073/pnas.1524448113/-/DCSupplemental.
References
- 1.Yu M, Stott S, Toner M, Maheswaran S, Haber DA. Circulating tumor cells: Approaches to isolation and characterization. J Cell Biol. 2011;192(3):373–382. doi: 10.1083/jcb.201010021. [DOI] [PMC free article] [PubMed] [Google Scholar]
- 2.Hong B, Zu Y. Detecting circulating tumor cells: Current challenges and new trends. Theranostics. 2013;3(6):377–394. doi: 10.7150/thno.5195. [DOI] [PMC free article] [PubMed] [Google Scholar]
- 3.Krebs MG, et al. Molecular analysis of circulating tumour cells—biology and biomarkers. Nat Rev Clin Oncol. 2014;11(3):129–144. doi: 10.1038/nrclinonc.2013.253. [DOI] [PubMed] [Google Scholar]
- 4.Paterlini-Brechot P, Benali NL. Circulating tumor cells (CTC) detection: Clinical impact and future directions. Cancer Lett. 2007;253(2):180–204. doi: 10.1016/j.canlet.2006.12.014. [DOI] [PubMed] [Google Scholar]
- 5.Hou JM, et al. Clinical significance and molecular characteristics of circulating tumor cells and circulating tumor microemboli in patients with small-cell lung cancer. J Clin Oncol. 2012;30(5):525–532. doi: 10.1200/JCO.2010.33.3716. [DOI] [PubMed] [Google Scholar]
- 6.Fidler IJ. The relationship of embolic homogeneity, number, size and viability to the incidence of experimental metastasis. Eur J Cancer. 1973;9(3):223–227. doi: 10.1016/s0014-2964(73)80022-2. [DOI] [PubMed] [Google Scholar]
- 7.Liotta LA, Saidel MG, Kleinerman J. The significance of hematogenous tumor cell clumps in the metastatic process. Cancer Res. 1976;36(3):889–894. [PubMed] [Google Scholar]
- 8.Fidler IJ. Tumor heterogeneity and the biology of cancer invasion and metastasis. Cancer Res. 1978;38(9):2651–2660. [PubMed] [Google Scholar]
- 9.Aceto N, et al. Circulating tumor cell clusters are oligoclonal precursors of breast cancer metastasis. Cell. 2014;158(5):1110–1122. doi: 10.1016/j.cell.2014.07.013. [DOI] [PMC free article] [PubMed] [Google Scholar]
- 10.Hou JM, et al. Circulating tumor cells as a window on metastasis biology in lung cancer. Am J Pathol. 2011;178(3):989–996. doi: 10.1016/j.ajpath.2010.12.003. [DOI] [PMC free article] [PubMed] [Google Scholar]
- 11.Yu M, et al. Circulating breast tumor cells exhibit dynamic changes in epithelial and mesenchymal composition. Science. 2013;339(6119):580–584. doi: 10.1126/science.1228522. [DOI] [PMC free article] [PubMed] [Google Scholar]
- 12.Balzer EM, Konstantopoulos K. Intercellular adhesion: Mechanisms for growth and metastasis of epithelial cancers. Wiley Interdiscip Rev Syst Biol Med. 2012;4(2):171–181. doi: 10.1002/wsbm.160. [DOI] [PMC free article] [PubMed] [Google Scholar]
- 13.Carlsson A, et al. Circulating tumor microemboli diagnostics for patients with non-small-cell lung cancer. J Thorac Oncol. 2014;9(8):1111–1119. doi: 10.1097/JTO.0000000000000235. [DOI] [PMC free article] [PubMed] [Google Scholar]
- 14.Yu M, et al. Cancer therapy. Ex vivo culture of circulating breast tumor cells for individualized testing of drug susceptibility. Science. 2014;345(6193):216–220. doi: 10.1126/science.1253533. [DOI] [PMC free article] [PubMed] [Google Scholar]
- 15.Chaffer CL, Weinberg RA. A perspective on cancer cell metastasis. Science. 2011;331(6024):1559–1564. doi: 10.1126/science.1203543. [DOI] [PubMed] [Google Scholar]
- 16.Weiss L. The hemodynamic destruction of circulating cancer cells. Biorheology. 1987;24(2):105–115. doi: 10.3233/bir-1987-24204. [DOI] [PubMed] [Google Scholar]
- 17.Molnar B, Ladanyi A, Tanko L, Sréter L, Tulassay Z. Circulating tumor cell clusters in the peripheral blood of colorectal cancer patients. Clin Cancer Res. 2001;7(12):4080–4085. [PubMed] [Google Scholar]
- 18.Cho EH, et al. Characterization of circulating tumor cell aggregates identified in patients with epithelial tumors. Phys Biol. 2012;9(1):016001. doi: 10.1088/1478-3975/9/1/016001. [DOI] [PMC free article] [PubMed] [Google Scholar]
- 19.Hou JM, et al. Molecular features and clinical relevance of circulating tumor cells (CTC) and circulating tumor microemboli (CTM) in patients with small cell lung cancer (SCLC) Clin Exp Metastasis. 2011;28(2):221–222. [Google Scholar]
- 20.Zeidman I, Buss JM. Transpulmonary passage of tumor cell emboli. Cancer Res. 1952;12(10):731–733. [PubMed] [Google Scholar]
- 21.Fung YC, Zweifach BW, Intaglietta M. Elastic environment of the capillary bed. Circ Res. 1966;19(2):441–461. doi: 10.1161/01.res.19.2.441. [DOI] [PubMed] [Google Scholar]
- 22.Baskurt OK, Meiselman HJ. Blood rheology and hemodynamics. Semin Thromb Hemost. 2003;29(5):435–450. doi: 10.1055/s-2003-44551. [DOI] [PubMed] [Google Scholar]
- 23.Byun S, et al. Characterizing deformability and surface friction of cancer cells. Proc Natl Acad Sci USA. 2013;110(19):7580–7585. doi: 10.1073/pnas.1218806110. [DOI] [PMC free article] [PubMed] [Google Scholar]
- 24.Bathe M, Shirai A, Doerschuk CM, Kamm RD. Neutrophil transit times through pulmonary capillaries: The effects of capillary geometry and fMLP-stimulation. Biophys J. 2002;83(4):1917–1933. doi: 10.1016/S0006-3495(02)73955-6. [DOI] [PMC free article] [PubMed] [Google Scholar]
- 25.Davidson PM, Denais C, Bakshi MC, Lammerding J. Nuclear deformability constitutes a rate-limiting step during cell migration in 3-D environments. Cell Mol Bioeng. 2014;7(3):293–306. doi: 10.1007/s12195-014-0342-y. [DOI] [PMC free article] [PubMed] [Google Scholar]
- 26.Harada T, et al. Nuclear lamin stiffness is a barrier to 3D migration, but softness can limit survival. J Cell Biol. 2014;204(5):669–682. doi: 10.1083/jcb.201308029. [DOI] [PMC free article] [PubMed] [Google Scholar]
- 27.Chen J, et al. Classification of cell types using a microfluidic device for mechanical and electrical measurement on single cells. Lab Chip. 2011;11(18):3174–3181. doi: 10.1039/c1lc20473d. [DOI] [PubMed] [Google Scholar]
- 28.King MR, et al. A physical sciences network characterization of circulating tumor cell aggregate transport. Am J Physiol Cell Physiol. 2015;308(10):C792–C802. doi: 10.1152/ajpcell.00346.2014. [DOI] [PMC free article] [PubMed] [Google Scholar]
- 29.Williams SA, et al. Dynamic measurement of human capillary blood pressure. Clin Sci (Lond) 1988;74(5):507–512. doi: 10.1042/cs0740507. [DOI] [PubMed] [Google Scholar]
- 30.Sarioglu AF, et al. A microfluidic device for label-free, physical capture of circulating tumor cell clusters. Nat Methods. 2015;12(7):685–691. doi: 10.1038/nmeth.3404. [DOI] [PMC free article] [PubMed] [Google Scholar]
- 31.Chen Y-L. Inertia- and deformation-driven migration of a soft particle in confined shear and Poiseuille flow. RSC Advances. 2014;4(34):17908–17916. [Google Scholar]
- 32.Maître JL, et al. Adhesion functions in cell sorting by mechanically coupling the cortices of adhering cells. Science. 2012;338(6104):253–256. doi: 10.1126/science.1225399. [DOI] [PubMed] [Google Scholar]
- 33.Duguay D, Foty RA, Steinberg MS. Cadherin-mediated cell adhesion and tissue segregation: Qualitative and quantitative determinants. Dev Biol. 2003;253(2):309–323. doi: 10.1016/s0012-1606(02)00016-7. [DOI] [PubMed] [Google Scholar]
- 34.Golubovskaya VM, et al. A small molecule inhibitor, 1,2,4,5-benzenetetraamine tetrahydrochloride, targeting the Y397 site of focal adhesion kinase decreases tumor growth. J Med Chem. 2008;51(23):7405–7416. doi: 10.1021/jm800483v. [DOI] [PMC free article] [PubMed] [Google Scholar]
- 35.Ling Y, Zhong Y, Perez-Soler R. Disruption of cell adhesion and caspase-mediated proteolysis of beta- and gamma-catenins and APC protein in paclitaxel-induced apoptosis. Mol Pharmacol. 2001;59(3):593–603. doi: 10.1124/mol.59.3.593. [DOI] [PubMed] [Google Scholar]
- 36.Isogai S, Horiguchi M, Weinstein BM. The vascular anatomy of the developing zebrafish: An atlas of embryonic and early larval development. Dev Biol. 2001;230(2):278–301. doi: 10.1006/dbio.2000.9995. [DOI] [PubMed] [Google Scholar]
- 37.Sasportas LS, Gambhir SS. Imaging circulating tumor cells in freely moving awake small animals using a miniaturized intravital microscope. PLoS One. 2014;9(1):e86759. doi: 10.1371/journal.pone.0086759. [DOI] [PMC free article] [PubMed] [Google Scholar]
- 38.Hu N, Sedmera D, Yost HJ, Clark EB. Structure and function of the developing zebrafish heart. Anat Rec. 2000;260(2):148–157. doi: 10.1002/1097-0185(20001001)260:2<148::AID-AR50>3.0.CO;2-X. [DOI] [PubMed] [Google Scholar]
- 39.Stroka KM, Konstantopoulos K. Physical biology in cancer. 4. Physical cues guide tumor cell adhesion and migration. Am J Physiol Cell Physiol. 2014;306(2):C98–C109. doi: 10.1152/ajpcell.00289.2013. [DOI] [PMC free article] [PubMed] [Google Scholar]
- 40.Jaalouk DE, Lammerding J. Mechanotransduction gone awry. Nat Rev Mol Cell Biol. 2009;10(1):63–73. doi: 10.1038/nrm2597. [DOI] [PMC free article] [PubMed] [Google Scholar]
- 41.Stott SL, et al. Isolation of circulating tumor cells using a microvortex-generating herringbone-chip. Proc Natl Acad Sci USA. 2010;107(43):18392–18397. doi: 10.1073/pnas.1012539107. [DOI] [PMC free article] [PubMed] [Google Scholar]
- 42.Abdelgawad M, et al. A fast and simple method to fabricate circular microchannels in polydimethylsiloxane (PDMS) Lab Chip. 2011;11(3):545–551. doi: 10.1039/c0lc00093k. [DOI] [PubMed] [Google Scholar]
- 43.Fiddes LK, et al. A circular cross-section PDMS microfluidics system for replication of cardiovascular flow conditions. Biomaterials. 2010;31(13):3459–3464. doi: 10.1016/j.biomaterials.2010.01.082. [DOI] [PubMed] [Google Scholar]
- 44.Wang Y, et al. Moesin1 and Ve-cadherin are required in endothelial cells during in vivo tubulogenesis. Development. 2010;137(18):3119–3128. doi: 10.1242/dev.048785. [DOI] [PMC free article] [PubMed] [Google Scholar]
- 45.Hsu CW, Chen YL. Migration and fractionation of deformable particles in microchannel. J Chem Phys. 2010;133(3):034906. doi: 10.1063/1.3457156. [DOI] [PubMed] [Google Scholar]
- 46.Skalak R, Branemark PI. Deformation of red blood cells in capillaries. Science. 1969;164(3880):717–719. doi: 10.1126/science.164.3880.717. [DOI] [PubMed] [Google Scholar]
- 47.Batchelor GK. An Introduction to Fluid Dynamics. Cambridge Univ Press; Cambridge, UK: 1967. [Google Scholar]
- 48.Lighthill MJ. Pressure-forcing of tightly fitting pellets along fluid-filled elastic tubes. J Fluid Mech. 1968;34(1):113–143. [Google Scholar]
- 49.Zhang Z, Xu J, Hong B, Chen X. The effects of 3D channel geometry on CTC passing pressure—towards deformability-based cancer cell separation. Lab Chip. 2014;14(14):2576–2584. doi: 10.1039/c4lc00301b. [DOI] [PubMed] [Google Scholar]
Associated Data
This section collects any data citations, data availability statements, or supplementary materials included in this article.


