ABSTRACT
West Nile virus (WNV) is the most important cause of epidemic encephalitis in North America. Innate immune responses, which are critical for control of WNV infection, are initiated by signaling through pathogen recognition receptors, RIG-I and MDA5, and their downstream adaptor molecule, MAVS. Here, we show that a deficiency of MAVS in hematopoietic cells resulted in increased mortality and delayed WNV clearance from the brain. In Mavs−/− mice, a dysregulated immune response was detected, characterized by a massive influx of macrophages and virus-specific T cells into the infected brain. These T cells were polyfunctional and lysed peptide-pulsed target cells in vitro. However, virus-specific T cells in the brains of infected Mavs−/− mice exhibited lower functional avidity than those in wild-type animals, and even virus-specific memory T cells generated by prior immunization could not protect Mavs−/− mice from WNV-induced lethal disease. Concomitant with ineffective virus clearance, macrophage numbers were increased in the Mavs−/− brain, and both macrophages and microglia exhibited an activated phenotype. Microarray analyses of leukocytes in the infected Mavs−/− brain showed a preferential expression of genes associated with activation and inflammation. Together, these results demonstrate a critical role for MAVS in hematopoietic cells in augmenting the kinetics of WNV clearance and thereby preventing a dysregulated and pathogenic immune response.
IMPORTANCE West Nile virus (WNV) is the most important cause of mosquito-transmitted encephalitis in the United States. The innate immune response is known to be critical for protection in infected mice. Here, we show that expression of MAVS, a key adaptor molecule in the RIG-I-like receptor RNA-sensing pathway, in hematopoietic cells is critical for protection from lethal WNV infection. In the absence of MAVS, there is a massive infiltration of myeloid cells and virus-specific T cells into the brain and overexuberant production of proinflammatory cytokines. These results demonstrate the important role that MAVS expression in hematopoietic cells has in regulating the inflammatory response in the WNV-infected brain.
INTRODUCTION
West Nile virus (WNV), a mosquito-borne, neurotropic flavivirus, is the most important cause of encephalitis in the United States, with 20,179 cases of neuroinvasive disease reported to the CDC since 1999; 1,360 of these cases occurred in 2015. WNV is an enveloped, positive-strand flavivirus and is related to Zika virus, which is implicated in Guillain-Barre syndrome and neonatal microcephaly (1, 2). Humans are a dead-end host for WNV, with the virus maintained in nature by cycling between birds and several species of mosquito; Culex mosquitoes are the most important in this process (2).
C57BL/6 wild-type (WT) mice infected with WNV develop clinical disease that parallels the disease observed in human patients, ranging from subclinical infection to encephalitis. While it is not clear why a specific individual develops severe versus mild disease, the role for type I interferon (IFN-I) in protection is well established. Mice deficient in IFN-I receptor (IFNAR), IRF3, IRF5, IRF7, RIG-I, MDA5, MyD88, or MAVS (also called IPS-1, STI, VISA, and CARDIF) expression all develop severe disease (3–6). RIG-I and MDA5 are members of the RIG-I-like receptor (RLR) family of cytosolic RNA helicases. RLRs function as pathogen recognition receptors for RNA viruses, including WNV. During WNV infection, RIG-I and MDA5 recognize and bind to pathogen-associated molecular pattern RNA motifs to undergo signaling activation. The active RLRs then interact with MAVS to direct downstream induction of gene expression. Mavs−/− mice are especially sensitive to WNV, developing a uniformly lethal encephalitis (3). In vitro infection of bone marrow-derived macrophages and dendritic cells or neurons revealed increased virus titers and decreased type I IFN production in cells lacking MAVS expression (3).
The precise role of MAVS in WNV-infected brains is not well understood. For example, it is not known whether MAVS expression in infiltrating hematopoietic or resident brain cells is most important for protection (3). Furthermore, the WNV-specific T cell response, required for virus clearance, is quantitatively robust in Mavs−/− mice, but it is not known whether T cells in these mice are functionality equivalent to those present in WT mice (3). Here, we show that MAVS expression in hematopoietic cells is most important for WNV clearance in infected mice. Virus-specific CD8 T cells are detected in elevated numbers in the brains of infected Mavs−/− compared to WT mice but exhibit lower functional avidity than WT counterparts. Activated T cells and macrophages accumulate in the brains of Mavs−/− mice, resulting in severe inflammation, which contributes to pathogenesis and a lethal infection.
MATERIALS AND METHODS
Mice, virus, and cells.
Mavs−/− mice on a C57BL/6 background were initially obtained as a generous gift from S. Akira (Osaka University, Osaka, Japan) and modified as described previously (3, 7, 8). C57BL/6 mice were purchased from Charles River Laboratories. C57BL/6-SJL(CD45.1) mice and Foxp3-IRES-GFP mice were purchased from Jackson Laboratories. Mavs−/−/Foxp3-IRES-GFP mice and Mavs−/− SJL(CD45.1) mice were generated by intercrossing at the University of Iowa. All the mice were maintained in the specific-pathogen-free Animal Care Facility at the University of Iowa. All protocols were approved by the University of Iowa Institutional Animal Care and Use Committee. WNV strain TX 2002-HC (WNV-TX) was propagated as previously described (3). Working stocks of WNV-TX were generated by a single round of amplification on Vero cells. The titers of virus stocks were determined by a standard plaque assay on Vero cells, as previously described (9). Vero cells were maintained in Dulbecco's modified Eagle medium (DMEM) supplemented with 10% fetal bovine serum (FBS).
Mouse infections.
Age-matched 8- to 12-week-old mice were inoculated subcutaneously (s.c.) in the left rear footpad with 100 PFU of WN-TX in 20 μl of phosphate-buffered saline (PBS) supplemented with 1% heat-inactivated FBS. The mice were monitored daily for morbidity and mortality.
Mouse bone marrow chimeras.
Bone marrow cells were extracted from femurs and tibia of CD45.1 or CD45.2 congenic WT and Mavs−/− mice (all 6 weeks old). Red blood cells (RBCs) were lysed using ACK (ammonium-chloride-potassium) buffer. Isolated bone marrow cells (2 × 10⁷ cells) were transferred adoptively into lethally irradiated (950 rads) CD45.1 or CD45.2 mismatched congenic WT and Mavs−/− mice. The chimeric mice were maintained on water supplemented with antibiotics for 2 weeks to prevent opportunistic infections. Reconstitution was verified 5 weeks after bone marrow transfer by flow cytometry analysis of CD45.1/CD45.2 expression on peripheral blood mononuclear cells (PBMCs).
Isolation of immune cells from brains.
Brains harvested after PBS perfusion were dispersed and digested with 1 mg/ml collagenase D (Roche) and 0.1 mg/ml DNase I (Roche) at 37°C for 30 min. Dissociated central nervous system (CNS) tissue was passed through a 70-μm cell strainer, followed by Percoll gradient (70%/37%) centrifugation. Mononuclear cells were collected from the interphase, washed, and resuspended in culture medium for further analysis.
Flow cytometry.
The following anti-mouse monoclonal antibodies were used: CD3 (145-2C11), CD4 (RM4-5), CD8α (53-6.7), gamma interferon (IFN-γ) (XMG1.2), tumor necrosis factor (TNF) (MP6-XT22), interleukin 2 (IL-2) (JEH6-5H4), IL-10 (JES-2A5), IL-1β (NJTEN3), CD16/32 (2.4G2), CD45.1 (A20), CD45.2 (104), CD69 (H1.2F3), Ly6C (AL-21), Ly6G (1A8), CXCR3 (CXCR3-173), CD11c (HL3), Siglec F (E50-2440), I-A/E (M5/114.15.2), CCR2 (MC21), CD45 (30-F11), CD40 (HM40-3), CD86 (GL1), B220 (RA3-6B2), NK1.1(PK136), Foxp3 (FJK-16S), and BCL-2 (BCL/10C4) (all the antibodies were from BD Bioscience, eBioscience, or Biolegend).
For surface staining, 106 cells were blocked with 1 μg anti-CD16/32 antibody and 1% rat serum and stained with the indicated antibodies at 4°C.
For in vitro intracellular cytokine/protein staining, 1 × 10⁶ cells/well were cultured in 96-well dishes at 37°C for 5 to 6 h in the presence of 2.5 to 10 μM peptide (CD8, NS4B-2488 [SSVWNATTA]; CD4, E641 [PVGRLVTVNPFVSVA]; BioSynthesis Inc., Lewisville, TX) or 20 μg/ml poly(I·C) (Invivogen, San Diego, CA), brefeldin A (BFA) (BD Biosciences), and antigen-presenting cells (CHB3 cells). The cells were then labeled for cell surface markers, fixed/permeabilized with Cytofix/Cytoperm solution (BD Biosciences), and labeled with anti-intracellular cytokine/protein antibodies.
To assess functional avidity, cells were stimulated with graded doses of the relevant peptide pulsed onto CHB3 cells and examined for IFN-γ production. The frequency of CD8 T cells producing IFN-γ at each concentration of peptide was measured and expressed as a percentage of the maximum response detected. The data were fitted to sigmoidal dose-response curves and used to calculate the amount of peptide needed to reach a half-maximum response (50% effective concentration [EC50]).
For major histocompatibility complex (MHC) class I tetramer staining, cells were stained with 8 μg/ml allophycocyanin (APC)-conjugated NS4B-2488 (SSVWNATTA) tetramers (obtained from the National Institutes of Health, National Institute of Allergy and Infectious Diseases MHC Tetramer Core Facility, Atlanta, GA) in complete RPMI 1640 medium for 30 min at 4°C. For MHC class II tetramer staining, cells were stained with E641 (PVGRLVTVNPFVSVA) tetramers for 60 min at 37°C. The cells were then incubated with surface and intracellular markers. All flow cytometry data were acquired on a BD FACSCalibur or BD FACSVerse and analyzed using FlowJo software (Tree Star, Inc.).
In vivo cytotoxicity assay.
In vivo cytotoxicity assays were performed on day 7 after WNV infection, as previously described (10). Briefly, splenocytes from CD45.1 congenic naive Mavs−/− and WT mice were stained with 2 μM (Mavs−/−), 0.2 μM (WT), or 0.004 μM (1:1 WT-Mavs−/−) carboxyfluorescein succinimidyl ester (CFSE) (Molecular Probes, Eugene, OR) and then pulsed with the NS4B peptide (10 μM) or left unpulsed (0.004 μM CFSE) at 37°C for 1 h. Cells (4 × 10⁵) from each group were mixed (1.2 × 10⁶ cells in total) and transferred intravenously (i.v.) into mice. At 4 h after transfer, total splenocytes were isolated. Target cells were identified on the basis of CD45.1 staining and were distinguished from each other by differential CFSE staining. After gating on CD45.1+ cells, the percent lysis was calculated as previously described (10).
Generation of BMDCs and prime/boost immunization.
Bone marrow-derived dendritic cells (BMDCs) were generated as previously described (11). Briefly, cells were depleted of RBCs and plated at a density of 1 × 10⁶/ml in X-vivo 15 medium (Lonza Walkersville, Walkersville, MD) supplemented with recombinant granulocyte-macrophage colony-stimulating factor (1,000 U/ml; BD Pharmingen) and recombinant IL-4 (50 U/ml; eBioscience). After 6 days, the BMDCs were stimulated with 1 μg/ml lipopolysaccharide (LPS) for 18 h and further incubated with or without 1 μM NS4B peptide for 2 h at 37°C. CD11c+ dendritic cells (DCs) were purified using CD11c microbeads and a Miltenyi autoMACS magnetic cell sorter (Miltenyi Biotec, Cologne, Germany). Purity was confirmed by flow cytometry. Mice were infected i.v. with BMDCs (5 × 10⁵) in 200 μl PBS. Recombinant vaccinia virus expressing WNV NS4B epitope (rVV-NS4B) was generated as previously described (12). Seven days after BMDC/peptide immunization, the mice were boosted with 1 × 10⁶ PFU rVV-NS4B i.v. in 200 μl PBS.
Microarray analysis.
CD45+ cells from the brains of four WT and four Mavs−/− mice were separated as described above. RNA was purified using a mirVana kit (Life Technologies) according to the manufacturer's instructions. RNA samples were assessed for purity and quality using an Agilent 2100 Bioanalyzer. RNA for the microarray was processed using a NuGen WT-Ovation Pico RNA amplification system, together with a NuGen WT-Ovation Exon module. Samples were hybridized and loaded onto Affymetrix Mouse gene 2.0. The arrays were scanned with a HiScan bead array system, and data were collected using GeneChip operating software. Data from Affymetrix Mouse gene 2.0 Expression BeadChip were normalized and median polished using Robust Multichip Average background correction with log2-adjusted values. After obtaining the log2 expression values for genes, statistical analysis was performed comparing the two groups (CD45+ cells from brains of WT and Mavs−/− mice). The significance of expression differences was assessed using a false-discovery rate (FDR) cutoff of 0.05 and a 2-fold change. Analysis and visualization of data and pathway analysis were performed using PartekGS software and Ingenuity Pathway Analysis software.
Treg adoptive transfer.
Lymphocytes were prepared from spleens and lymph nodes of donor Mavs−/−/Foxp3-IRES-GFP or Mavs+/+/Foxp3-IRES-GFP mice. CD4 T cells were negatively selected using a CD4 T Cell isolation kit II (containing a biotinylated antibody cocktail) and an AutoMACS (Miltenyi Biotech). Enriched CD4 T cells were labeled with anti-mouse CD8-APC, B220-APC, and streptavidin-APC. Regulatory T cells (Tregs) (GFPhi) were then sorted twice using yield mode, followed by purity mode, on a FACSDiva or FACSAria (BD). Cell purities were typically 99.4% to 99.7%. Tregs (6 ×10⁵) were transferred adoptively into Mavs−/− mice via the i.v. route.
Proliferation assay.
Splenocytes (1 ×10⁶) from WT or Mavs−/− mice were labeled with 2.5 μM CFSE (Invitrogen) and cultured in the presence of 1 μg of anti-CD3 monoclonal antibody (MAb) in a 96-well round-bottom plate. After 66 h, cells were harvested and stained for CFSE dilution, caspases 3/7/8 (Invitrogen), and BCL-2 expression in CD4 and CD8 T cells.
Statistical analysis.
A Student t test was used to analyze differences in mean values between groups. The viral burden in tissues was analyzed by the Mann-Whitney test. Survival data were analyzed using a Mantel-Cox log rank test. All results are expressed as means and standard errors of the mean (SEM). P values of <0.05 were considered statistically significant.
Microarray data accession number.
The complete microarray data have been deposited at the Gene Expression Omnibus under accession no. GSE79417.
RESULTS
MAVS expression in CD45+ hematopoietic cells is critical for protection from WNV.
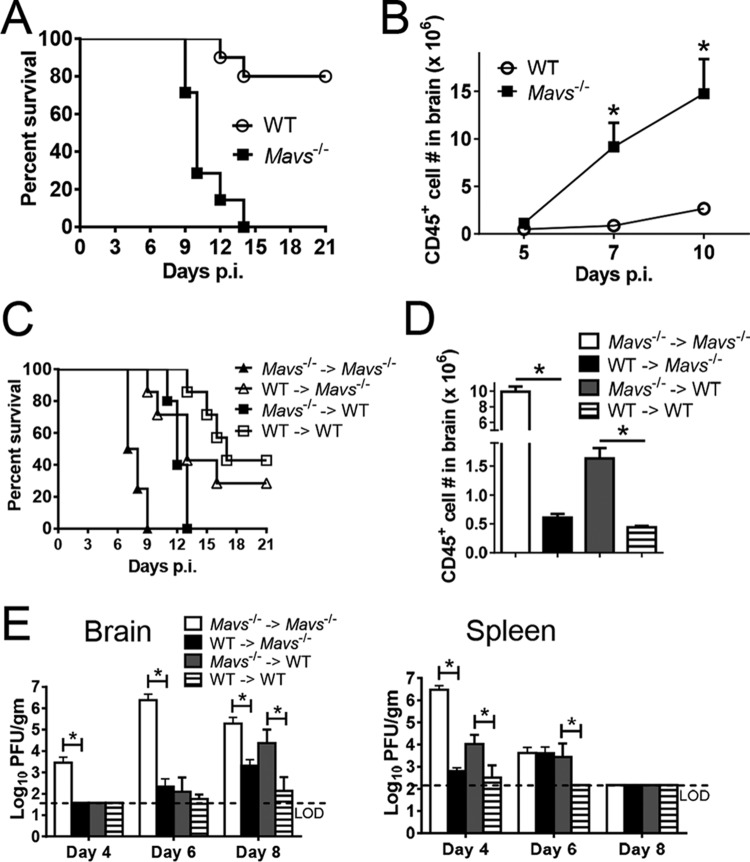
In agreement with published results (3), we found that Mavs−/− mice uniformly succumbed to infection with WNV, with death occurring by 14 days postinfection (p.i.). Only 10 to 30% of WNV-infected WT mice died under the same conditions (Fig. 1A). Large numbers of infiltrating CD45+ cells were detected in Mavs−/− brains between days 5 and 7 p.i., 2 days earlier than observed in infected WT mice (Fig. 1B). To address whether MAVS expression in these infiltrating cells or in nonhematopoietic resident cells was most critical in preventing lethal disease, we performed a set of reciprocal bone marrow transfers, transferring Mavs−/− or WT bone marrow to Mavs−/− or WT recipients, and monitored the mice for clinical disease, inflammatory-cell infiltration, and virus clearance (Fig. 1C to E). Recipients of Mavs−/− cells developed more severe disease and uniformly succumbed to the infection. The numbers of infiltrating cells were significantly greater in mice that received Mavs−/− cells. However, the kinetics of virus clearance was more nuanced. Clearance was delayed in the brains and spleens if either donor or recipient mice lacked MAVS expression. However, the results also demonstrated that when the phenotype of the recipients (WT versus Mavs−/−) WAS controlled for, mice that received Mavs−/− donor cells cleared virus more slowly than those that received WT cells.
FIG 1.
MAVS expression in CD45+ hematopoietic cells is critical for protection from WNV. (A and B) Eight- to 12-week-old WT and Mavs−/− mice were infected with 100 PFU WNV in the footpad (subcutaneously [s.c.]). (A) Survival after infection (WT, n = 10; Mavs−/−, n = 7; P = 0.0002). (B) Numbers of CD45+ cells in brains at the indicated times p.i. (C, D, and E) Bone marrow chimeras were generated as described in Materials and Methods. The chimeric mice were infected with 100 PFU WNV s.c. (C) Survival was monitored daily (Mavs−/− → Mavs−/−, n = 4; Mavs−/− → WT, n = 5; WT → WT, n = 7; WT → WT, n = 7; WT → Mavs−/−, n = 7; P = 0.0018 [WT → WT group compared to Mavs−/− → WT group] and P = 0.0015 [WT → Mavs−/− group compared to Mavs−/− → Mavs−/−]). Arrows denote indicated donor bone marrow transferred into indicated irradiated host. (D) Numbers of CD45+ cells from brains at the indicated times p.i. (E) To obtain virus titers, brains and spleens were homogenized at the indicated time points, and the titers were determined on Vero cells. Titers are expressed as PFU/g tissue. n = 5 or 6 mice/group/time point. *, P < 0.05. The data were pooled from the results of two independent experiments. The error bars indicate SEM.
These results demonstrate a key role for MAVS in mediating severe disease in hematopoietic cells. Differences between transferred Mavs−/− and WT bone marrow cells could reflect differences in the cellular composition of the naive spleen. However, similar frequencies of dendritic cells, macrophages, neutrophils, and lymphocytes were present in spleens from both WT and Mavs−/− mice (data not shown).
Robust virus-specific CD4 and CD8 T cell responses in the brains of Mavs−/− mice.
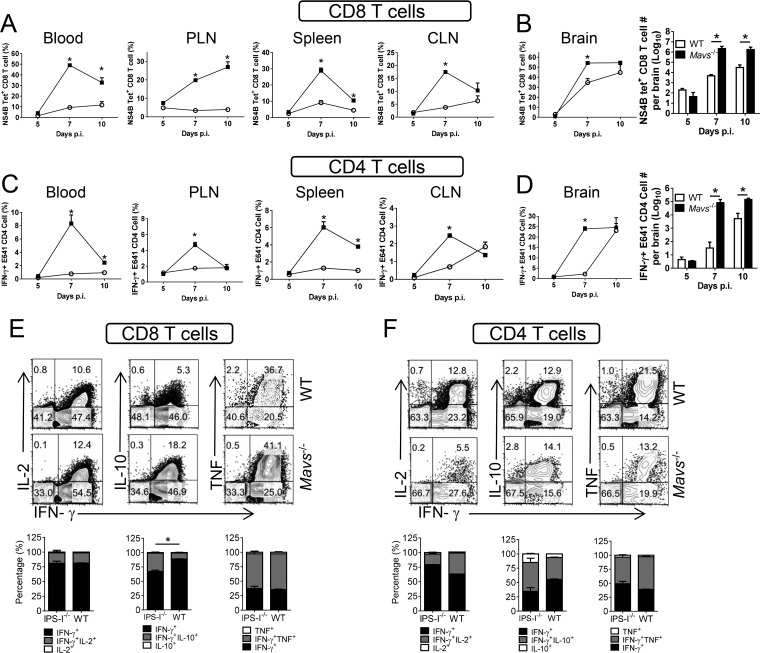
Infiltrating hematopoietic cells include lymphocytes and myeloid cells, and the number of virus-specific T cells is increased in Mavs−/− mice (3). Because these cells are unable to clear WNV effectively, we assessed the quality of the T cell response. A large fraction of T cells in the blood and peripheral lymphoid tissue (spleen and cervical and popliteal lymph nodes) were specific for single WNV-specific epitopes, with nearly 50% of blood CD8 T cells responding to a Db-restricted NS4B CD8 T cell epitope (13) and 10% responding to an I-Ab-restricted E protein CD4 T cell epitope (14), as measured by MHC class I/peptide tetramer staining or peptide restimulation, respectively (Fig. 2A and C). Similarly, the numbers of virus-specific CD8 and CD4 T cells in the brains rapidly increased in Mavs−/− mice, so that a thousandfold more cells were detected at day 7 p.i. (Fig. 2B and D). Virus-specific CD8 and CD4 T cells in Mavs−/− and WT brains were polyfunctional, with similar frequencies expressing IFN-γ and TNF or IFN-γ and IL-2. Notably, a larger fraction of cells from Mavs−/− mice expressed both IFN-γ and IL-10, indicating that the cells were highly activated (Fig. 2E and F) (15). None of the cells expressed IL-4 or IL-17 (data not shown). This large increase in T cell numbers, with equivalent production of cytokines on a per cell basis, suggested that greatly increased levels of proinflammatory cytokine were present in the infected Mavs−/− brain. To determine whether this increase in T cell numbers reflected intrinsic defects in apoptosis or T cell proliferation in Mavs−/− mice, we treated splenocytes from naive mice in vitro with anti-CD3 antibody. We detected no differences in T cell apoptosis, measured by expression of activated caspases 3, 7, and 8 and BCL-2 (Fig. 3A and B), or proliferation, assessed by CFSE dilution (Fig. 3C and D).
FIG 2.
Robust virus-specific CD4 and CD8 T cell responses in the brains of Mavs−/− mice. Eight- to 12-week-old WT and Mavs−/− mice were infected with 100 PFU WNV s.c. CD8 (A and B) and CD4 (C and D) T cells from peripheral lymphoid organs (cervical [CLN] and popliteal [PLN] lymph nodes) and brains were stained with NS4B tetramer (A and B) or stimulated with E641 peptide (C and D) at the indicated time points. The frequencies and numbers of tetramer+ CD8 T cells and IFN-γ+ CD4 T cells are shown. (E and F) Brain cells were harvested at day 10 p.i. and stimulated with NS4B peptide (CD8 T cells) (E) or E641 peptide (CD4 T cells) (F). The cells expressing IFN-γ and TNF, IL-10, or IL-2 are shown. n = 3 mice/group/time point/experiment. *, P < 0.05. The data are representative of the results of 2 independent experiments. The error bars indicate SEM.
FIG 3.
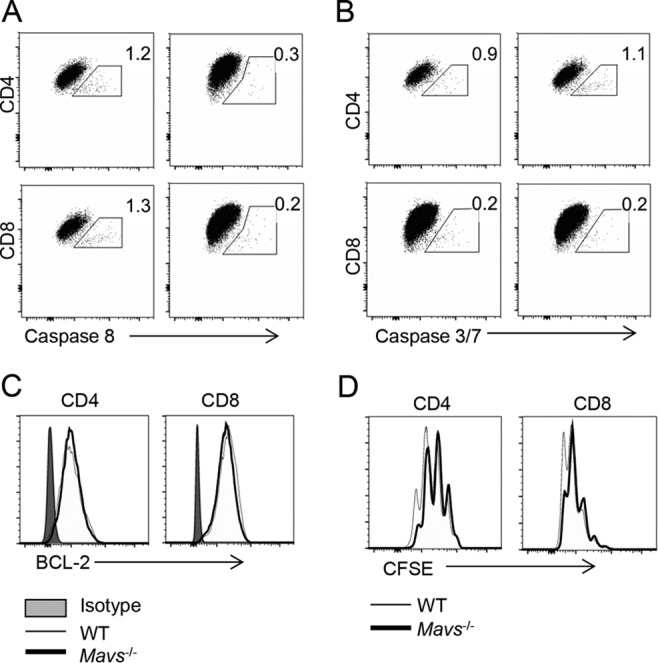
There are no differences in apoptosis or in proliferation in spleen-derived T cells. Splenocytes from naive WT and Mavs−/− mice were harvested, labeled with 2.5 μM CFSE, and cultured in the presence of 1 μg anti-CD3 MAb. After 66 h, cells were harvested and stained for caspase 8 (A), caspase 3/7 (B), BCL-2 (C), and CFSE dilution (D). (A and B) Left panels indicate WT mice; right panels indicate Mavs−/− mice.
Virus-specific T cells are cytolytic in vivo but not protective.
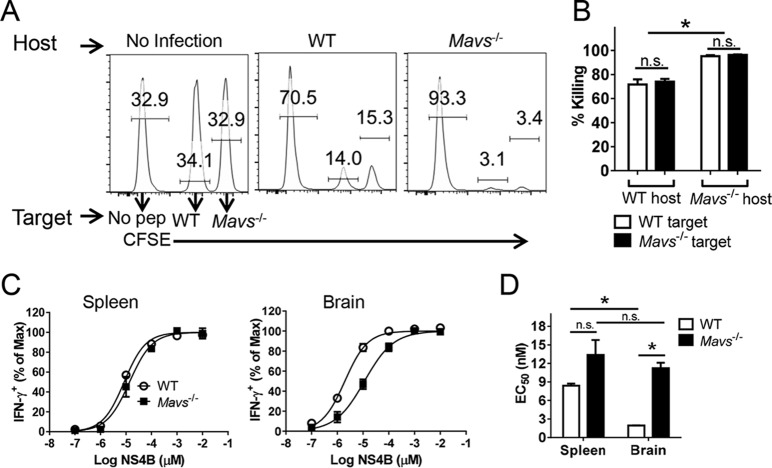
While these results demonstrated high polyfunctionality, they did not assess whether the virus-specific CD8 T cells were equally cytolytic. To address this question, we performed an in vivo cytotoxicity assay, using NS4B peptide-pulsed splenocytes as target cells. To control for differences in MAVS expression in both the host and target cells, we transferred Mavs−/− and WT cells differentially labeled with CFSE to Mavs−/− or WT mice intravenously. As shown in Fig. 4A and B, both targets were killed equivalently in the spleen by 4 h after transfer. Consistent with the greater frequency and numbers of virus-specific CD8 T cells, a higher percentage of target cells were lysed in Mavs−/− mice.
FIG 4.
Virus-specific T cells are functional in vivo. WT and Mavs−/− mice were infected with 100 PFU WNV s.c. (A and B) In vivo cytotoxicity assays were performed on day 7 p.i. using CD8 T cell peptide (pep) NS4B-coated and control splenocytes as described in Materials and Methods. n = 3 mice/group/experiment. *, P < 0.05; n.s., not significant. The data are representative of the results of 2 independent experiments. (C and D) Functional avidity of NS4B-specific CD8 T cells in spleens and brains at day 10 p.i. (C) and the EC50 (D). *, P < 0.05. The data are representative of the results of 4 independent experiments. The error bars indicate SEM.
Another measure of T cell functionality is the ability to respond to small amounts of peptide (functional avidity). NS4B-specific CD8 T cells from the brains of Mavs−/− mice exhibited approximately 5-fold-lower functional avidity than brain cells harvested from WT mice (Fig. 4C and D). There were only modest differences in functional avidity when spleen-derived cells were compared, demonstrating that high-functional-avidity cells preferentially migrated to the brains of WT-infected mice, but not Mavs−/−-infected mice. This decreased functional avidity makes it likely that the cells were less able to efficiently clear virus from infected Mavs−/− brains.
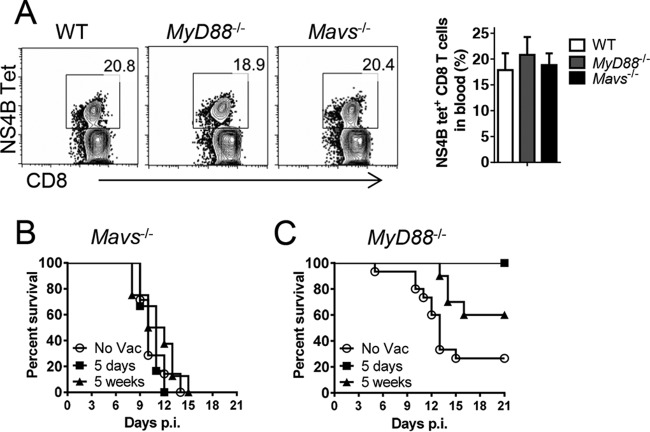
To address whether memory virus-specific CD8 T cells could protect Mavs−/− mice, we performed a prime-boost vaccination strategy, immunizing mice with DCs coated with NS4B peptide, followed by boosting at day 7 with vaccinia virus expressing the same epitope. This regimen effectively and rapidly induces memory T cells (16). We infected Myd88−/− mice as a control, since these mice are deficient in type I IFN induction and also are highly susceptible to WNV (6). This prime-boost strategy induced similar frequencies of NS4B-specific cells in the blood of all three groups (Fig. 5A). However, challenge of Mavs−/− mice with WNV at either 5 days or 5 weeks postboost was not protective (Fig. 5B). In contrast, Myd88−/− mice were either completely (5 days after boosting) or partially (5 weeks after boosting) protected (Fig. 5C). Thus, even preexisting high levels of memory virus-specific CD8+ T cells were unable to protect Mavs−/− mice. Of note, CD8 T cells are required for protection, because most of the unvaccinated WT mice died if these cells were depleted prior to infection, consistent with published data (reference 17 and data not shown).
FIG 5.
Immunization with DC/peptide NS4B complexes did not induce protective CD8 T cell responses. WT, Mavs−/−, and Myd88−/− mice were immunized with BMDCs pulsed with NS4B peptide. Seven days later, the mice were boosted with 1 × 10⁶ PFU rVV-NS4B i.v. (A) Blood samples were harvested at day 5 postboosting and stained with NS4B tetramer. The frequencies of NS4B tetramer+ CD8 T cells are shown. (B and C) Mavs−/− and Myd88−/− mice were infected with 100 PFU WNV s.c. at 5 days or 5 weeks postboosting. (B) Survival in Mavs−/− mice (no vaccination [No Vac], n = 7; 5 days postboost, n = 6; 5 weeks postboost, n = 8). (C) Survival in MyD88−/− mice (No Vac, n = 15; 5 days postboost, n = 6; 5 weeks postboost, n = 10; P = 0.0374 [5-day group compared to No Vac group] and P = 0.0067 [5-week group compared to No Vac group]). The error bars indicate SEM.
Regulatory T cells do not protect Mavs−/− mice from lethal infection.
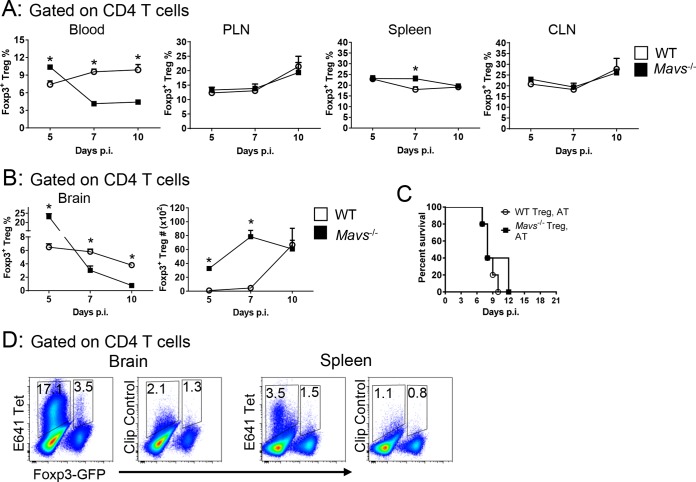
Previous studies demonstrated a lower frequency of Foxp3+ Tregs in the blood of patients with symptomatic (versus asymptomatic) WNV infection and in mice with more severe disease (18). WNV clinical disease was also more severe in Treg-depleted mice, suggesting a role in ameliorating an excessive inflammatory response (18). The frequencies of Tregs in peripheral lymphoid tissue were similar at all times p.i. in Mavs−/− and WT mice; Treg frequency in the blood, however, was greatly decreased in Mavs−/− mice (Fig. 6A). More strikingly, Treg numbers remained largely unchanged in the brain after infection of Mavs−/− mice, resulting in a sharp decrease in frequency, reflecting the increase in total numbers of infiltrating cells. In contrast, Treg frequency decreased only modestly in WT mice while the number of cells increased as the infection progressed (Fig. 6B). Since these results were consistent with an ameliorating effect of Tregs, we transferred 6 × 10⁵ WT or Mavs−/− Tregs to infected Mavs−/− mice. We transferred 6 × 10⁵ Tregs because that number ameliorated disease in mice infected with another neurotropic virus (mouse hepatitis virus, a murine coronavirus) (19) However, in neither case was lethality prevented (Fig. 6C). Of note, approximately 3.5% or 1.5% of Tregs were specific for an epitope in the infected brains or spleens, respectively, of WT mice at day 10 p.i. (Fig. 6D).
FIG 6.
Tregs do not protect Mavs−/− mice from lethal infection. WT and Mavs−/− mice were infected with 100 PFU WNV s.c. Cells from peripheral lymphoid organs (A) or brains (B) were harvested at the indicated time points. The frequencies and numbers of Foxp3+ Tregs are shown. (C) Tregs (6 × 10⁵) were purified from Mavs−/−/Foxp3-IRES-GFP or Mavs+/+/Foxp3-IRES-GFP mice and adoptively transferred into Mavs−/− mice i.v. 1 day before WNV infection. Survival was monitored daily (WT Treg, AT, n = 5; Mavs−/− Treg, AT, n = 5). AT, adoptive transfer. (D) WT mice were infected with WNV. Cells from brains and spleens were harvested at day 10 p.i. The frequencies of E641 tetramer+ cells in Foxp3- CD4 T cells and Foxp3+ Tregs are shown. Cells from 4 to 6 mice were pooled. The data are representative of the results of 3 independent experiments. The error bars indicate SEM.
Large increase in macrophage numbers in Mavs−/− compared to WT brains.
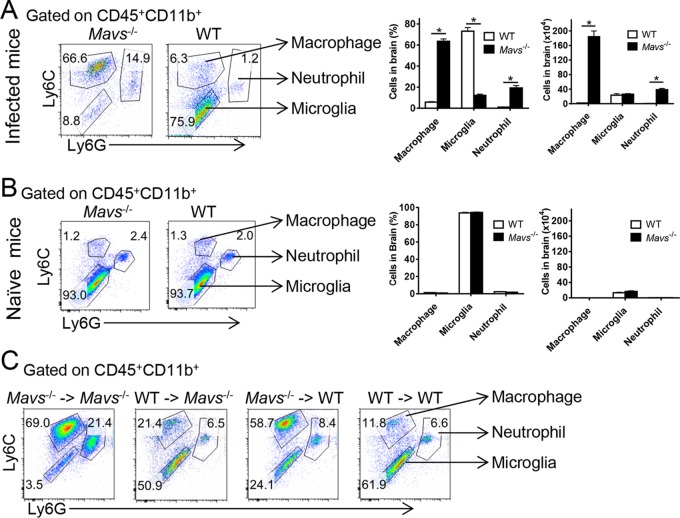
The frequency of brain-infiltrating macrophages increased 10-fold and their number increased 100- to 1,000-fold by day 7 p.i. in Mavs−/− compared to WT mice; similar changes in the frequency and number of neutrophils were also observed (Fig. 7A). No differences in the frequencies and numbers of microglia/macrophages/neutrophils were detected in the uninfected Mavs−/− brain (Fig. 7B). To determine whether augmented macrophage and neutrophil infiltration was dependent upon MAVS expression in hematopoietic cells, we developed bone marrow chimeras, shown in Fig. 1. Recipients of Mavs−/− bone marrow demonstrated higher frequencies of macrophages, independent of whether the host expressed MAVS (Fig. 7C). Numbers of macrophages, as well as neutrophils, were also increased in the brains of these mice, since recipients of Mavs−/− cells showed significantly higher total numbers of infiltrating cells in the brain (Fig. 1D).
FIG 7.
Increase in macrophage numbers in Mavs−/− compared to WT brains. Cells from WNV-infected (day 10 p.i.) (A) or naive (B) brains were harvested and stained for macrophages (CD45+ CD11b+ Ly6C+ Ly6G−), microglia (CD45+ CD11b+ Ly6C− Ly6G−), and neutrophils (CD45+ CD11b+ Ly6C+ Ly6G+). Frequencies and numbers are shown. (C) Bone marrow chimeric mice were infected with 100 PFU WNV s.c. Cells from the brains were harvested at day 10 p.i. and stained for macrophages, microglia, and neutrophils. n = 7 to 9 mice/group/time point. *, P < 0.05. The data were pooled from the results of three independent experiments. The error bars indicate SEM.
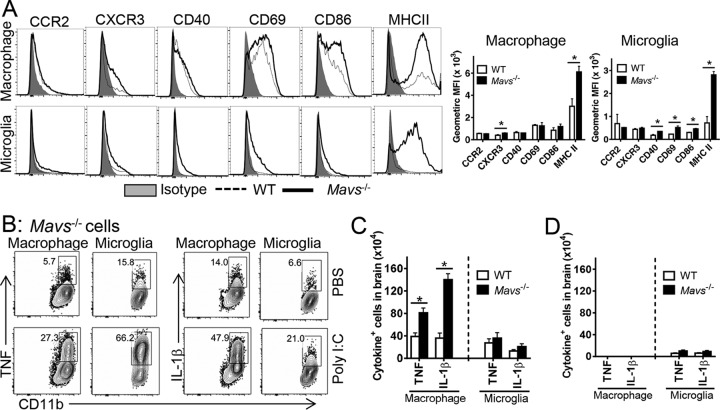
Macrophages and microglia from Mavs−/− brains expressed significantly higher levels of MHC class II antigen, required for antigen presentation and likely critical for propagating the inflammatory process in the brains. In addition, we detected modest but statistically significant increases in activation markers on macrophages (CXCR3) and microglia (CD40, CD69, and CD86) (Fig. 8A). To examine the functional consequences of activation, we assessed cytokine production by brain-derived macrophages and microglia. Similar frequencies of macrophages and microglia isolated from both Mavs−/− and WT mice expressed TNF and IL-1β in the absence of further stimulation, showing that these cells were activated equivalently in vivo (only Mavs−/− mice are shown in Fig. 8B). Direct ex vivo stimulation with poly(I·C) equivalently increased the frequency of cells that expressed TNF and IL-1β in both naive and infected brains. However, there were substantially more macrophages expressing these cytokines in WNV-infected Mavs−/− mice, since the total numbers of macrophages were greater (Fig. 8C). No differences in inflammatory cytokine expression were found in macrophages and microglia in uninfected brains of either Mavs−/− or WT mice (Fig. 8D). Our results thus far showed that there was more infiltration of activated myeloid and T cells in Mavs−/− than in WT brains.
FIG 8.
Enhanced activation of macrophages and microglia in Mavs−/− compared to WT brains. WT and Mavs−/− mice were infected with 100 PFU WNV s.c. (A) Cells from brains were harvested at day 10 p.i. and stained with phenotypic markers. Geometric mean fluorescence intensities (MFI) are shown. *, P < 0.05. The data are representative of the results of 2 independent experiments. n = 3 mice/group/time point/experiment. (B) Macrophages and microglia were stimulated with 20 μg/ml poly(I·C) in the presence of BFA in vitro for 6 h and stained for intracellular TNF and IL-1β expression. (C and D) Cytokine-expressing-cell numbers in infected (C) and naive (D) mice. n = 9 mice/group/time point. *, P < 0.05. The data were pooled from three independent experiments. The error bars indicate SEM.
Increased inflammation in WNV-infected Mavs−/− brains assessed by microarray analysis.
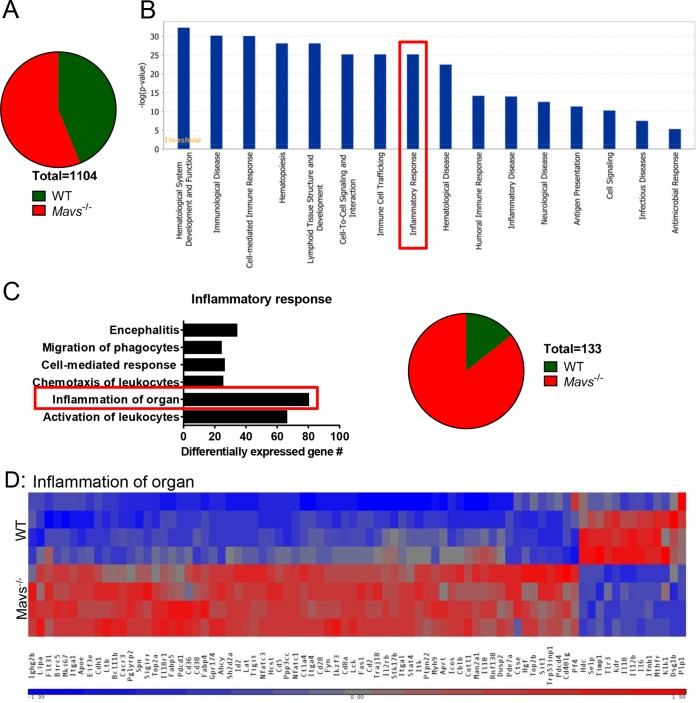
To assess enhanced inflammation more globally, we performed microarray analyses using RNA extracted from brain-derived CD45+ cells harvested from 4 WT and 4 Mavs−/− mice at day 10 p.i. We found that 1,104 genes were differentially regulated when Mavs−/− and WT mice were compared, with 620 genes increased in expression in Mavs−/− mice compared to WT mice and a smaller number (484) reduced in expression compared to WT mice (Fig. 9A). Of note, most of the downregulated genes encode proteins that have not been annotated. Using Ingenuity Pathway Analysis (IPA) to identify gene pathways, we found that 281 genes in the Disease and Function pathway were differentially regulated, with most of them classified in the cellular immune response (Fig. 9B; see Table S1 in the supplemental material). The vast majority of these genes were increased in expression in Mavs−/− mice. In particular, significantly more genes associated with the inflammatory response were expressed at high levels in Mavs−/− than in WT mice (Fig. 9C and D), consistent with the overwhelming amount of inflammation detected in these mice.
FIG 9.
Differential gene expression in CD45+ cells in brains from WT and Mavs−/− mice. RNA was prepared from CD45+ cells harvested from the brains of 4 Mavs−/− and 4 WT mice at day 10 p.i. and analyzed as described in Materials and Methods. (A) Numbers of genes upregulated or downregulated in Mavs−/− compared to WT mice. A total of 1,104 genes were differentially regulated. (B) Expression of genes [−log(P value)] in the disease and function pathways. (C) Differentially expressed genes in the inflammatory response pathway (boxed in panel B). (D) Heat map of selected genes involved in the inflammation of organs pathway.
DISCUSSION
The host immune response functions in WNV-infected animals to limit virus replication in the periphery and to diminish invasion and infection of the central nervous system (2). Here, we show that MAVS, expressed primarily by hematopoietic cells, is critical for both processes. Based on results in this and previous reports (3), MAVS-dependent expression of type I interferon and other inflammatory molecules by macrophages is necessary to orchestrate a balanced innate immune response and a subsequent protective T cell response. In the absence of MAVS expression, type I IFN and other proinflammatory mediators are probably produced by other cells via MAVS-independent pathways, such as through Toll-like receptor (TLR), MyD88, and STING signaling (6, 20–22), resulting in high levels in the blood. Furthermore, prolonged and elevated virus titers elicit a protracted innate immune response in both the periphery and brain (3). TNF, one of the circulating cytokines, has been shown to contribute to breakdown of the blood-brain barrier (BBB) and enhanced entry of WNV and inflammatory cells into the brain (20); other cytokines, such as IL-6, IFN-γ, CXCL10, and type I interferon, are also increased in sera from Mavs−/− mice and may contribute to these processes (3). Some cytokines, such as TNF and IL-1β, are known to be toxic to neurons, which could cause neuronal injury and contribute to WNV encephalitis (23, 24). Together, these data indicate that the relative temporal and spatial expression of viral gene products and inflammatory mediators differs from that observed in WT mice, resulting in a dysregulated immune response in WNV-infected Mavs−/− mice and poor outcomes. Immune dysregulation was not confined to cytokine production, since global gene expression analyses of infected Mavs−/− brains showed extensive upregulation of genes associated with inflammation in general compared to WT mice.
A downstream consequence of increased virus load and overexuberant proinflammatory cytokines is massive infiltration of virus-specific T cells and CD11b+ Ly6C+ myeloid cells into the brain and microglion activation. Elevated numbers of macrophages have been observed in mice infected with WNV and other neurotropic viruses, and this was observed to contribute to worse outcomes (25–28). Macrophages and microglia in the WNV-infected brain expressed high levels of MHC class II, which contributes to in situ activation and proliferation of virus-specific and perhaps bystander T cells. Virus-specific T cell numbers were greatly increased in the spleen and brain, and the cells were functional, as assessed using an in vivo cytotoxicity assay. The relative increase was greater in the brains of Mavs−/− mice than in those of WT mice, likely reflecting differences in the viral antigen burden and levels of cytokines, such as IL-2, which enhance proliferation. There were no intrinsic differences in the ability to proliferate between MAVS−/− and WT T cells because proliferation was approximately the same after CD3 stimulation in vitro (Fig. 3). Most importantly, NS4B-specific cells with high functional avidity migrated to or proliferated in the brains of WT-infected mice, whereas there was no selection for such highly functional cells in Mavs−/− mice. This accumulation of low-avidity antigen-specific T cells in the brain may have contributed to poor virus clearance.
Another possible factor contributory to worse outcomes in Mavs−/− mice is a lack of expansion of regulatory T cells. Tregs modulate the inflammatory response to minimize host damage but also may inhibit effective virus clearance (29). Treg numbers were increased in WNV-infected patients with milder disease (18), and the numbers of Tregs in the brain correlated with better clinical outcomes in mice infected with other neurotropic virus infections (30). Tregs were detected in both Mavs−/− and WT brains at day 5 p.i., but their numbers failed to increase in MAVS−/− mice while they increased in WT mice as infection progressed. Since the total numbers of CD4 T cells continued to increase in the brains of Mavs−/− mice, the Treg frequency decreased substantially. Whether this lack of Treg increase in brains of Mavs−/− mice reflects a specific requirement for a MAVS-dependent gene in myeloid cells or direct inhibition of Treg proliferation by the inflammatory milieu present in these mice requires additional investigation. It is also possible that Tregs may not function optimally in the highly inflamed CNS of WNV-infected Mavs−/− mice. Consistent with this idea, myelin-specific Tregs were suboptimally suppressive in the inflammatory environment present in mice with experimental autoimmune encephalomyelitis (EAE) (31). In these mice, the loss of suppressive capability was mediated by TNF and IL-6.
Collectively, our results demonstrate a complex and multifactorial basis for severe disease in WNV-infected Mavs−/− mice, with MAVS expression in hematopoietic cells being critical for orchestrating a protective immune response. Our experiments also suggest that targeting of myeloid cell subsets may be a useful intervention in enhancing the anti-WNV protective immune response.
Supplementary Material
ACKNOWLEDGMENTS
This research was supported in part by grants from NIAID (5U54AI057160 and WU-14-10/PO 2922303X Am 1 [S.P.] and U19 AI083019, R01 AI104002, and R01 AI074973 [M.S.D. and M.G.]), the Thousand Talents Plan Award of China 2015, and the Municipal Healthcare Joint-Innovation Major Project of Guangzhou (J.Z.).
J.Z. and S.P. designed and coordinated the study. J.Z. and R.V. performed the experiments and analyzed the data. M.G. and M.S.D. provided virus, key reagents, and mice. J.Z. and S.P. wrote the initial draft of the manuscript. We all contributed to the interpretation and conclusions presented and edited the manuscript.
Footnotes
Supplemental material for this article may be found at http://dx.doi.org/10.1128/JVI.00707-16.
REFERENCES
- 1.Malone RW, Homan J, Callahan MV, Glasspool-Malone J, Damodaran L, Schneider Ade B, Zimler R, Talton J, Cobb RR, Ruzic I, Smith-Gagen J, Janies D, Wilson J. 2016. Zika virus: medical countermeasure development challenges. PLoS Negl Trop Dis 10:e0004530. doi: 10.1371/journal.pntd.0004530. [DOI] [PMC free article] [PubMed] [Google Scholar]
- 2.Suthar MS, Diamond MS, Gale M Jr. 2013. West Nile virus infection and immunity. Nat Rev Microbiol 11:115–128. doi: 10.1038/nrmicro2950. [DOI] [PubMed] [Google Scholar]
- 3.Suthar MS, Ma DY, Thomas S, Lund JM, Zhang N, Daffis S, Rudensky AY, Bevan MJ, Clark EA, Kaja MK, Diamond MS, Gale M Jr. 2010. IPS-1 is essential for the control of West Nile virus infection and immunity. PLoS Pathog 6:e1000757. doi: 10.1371/journal.ppat.1000757. [DOI] [PMC free article] [PubMed] [Google Scholar]
- 4.Lazear HM, Lancaster A, Wilkins C, Suthar MS, Huang A, Vick SC, Clepper L, Thackray L, Brassil MM, Virgin HW, Nikolich-Zugich J, Moses AV, Gale M Jr, Fruh K, Diamond MS. 2013. IRF-3, IRF-5, and IRF-7 coordinately regulate the type I IFN response in myeloid dendritic cells downstream of MAVS signaling. PLoS Pathog 9:e1003118. doi: 10.1371/journal.ppat.1003118. [DOI] [PMC free article] [PubMed] [Google Scholar]
- 5.Errett JS, Suthar MS, McMillan A, Diamond MS, Gale M Jr. 2013. The essential, nonredundant roles of RIG-I and MDA5 in detecting and controlling West Nile virus infection. J Virol 87:11416–11425. doi: 10.1128/JVI.01488-13. [DOI] [PMC free article] [PubMed] [Google Scholar]
- 6.Szretter KJ, Daffis S, Patel J, Suthar MS, Klein RS, Gale M Jr, Diamond MS. 2010. The innate immune adaptor molecule MyD88 restricts West Nile virus replication and spread in neurons of the central nervous system. J Virol 84:12125–12138. doi: 10.1128/JVI.01026-10. [DOI] [PMC free article] [PubMed] [Google Scholar]
- 7.Kato H, Sato S, Yoneyama M, Yamamoto M, Uematsu S, Matsui K, Tsujimura T, Takeda K, Fujita T, Takeuchi O, Akira S. 2005. Cell type-specific involvement of RIG-I in antiviral response. Immunity 23:19–28. doi: 10.1016/j.immuni.2005.04.010. [DOI] [PubMed] [Google Scholar]
- 8.Kumar H, Kawai T, Kato H, Sato S, Takahashi K, Coban C, Yamamoto M, Uematsu S, Ishii KJ, Takeuchi O, Akira S. 2006. Essential role of IPS-1 in innate immune responses against RNA viruses. J Exp Med 203:1795–1803. doi: 10.1084/jem.20060792. [DOI] [PMC free article] [PubMed] [Google Scholar]
- 9.Brien JD, Lazear HM, Diamond MS. 2013. Propagation, quantification, detection, and storage of West Nile virus. Curr Protoc Microbiol 31:15D.3.1–15D.3.18. doi: 10.1002/9780471729259.mc15d03s31. [DOI] [PubMed] [Google Scholar]
- 10.Zhao J, Zhao J, Van Rooijen N, Perlman S. 2009. Evasion by stealth: inefficient immune activation underlies poor T cell response and severe disease in SARS-CoV-infected mice. PLoS Pathog 5:e1000636. doi: 10.1371/journal.ppat.1000636. [DOI] [PMC free article] [PubMed] [Google Scholar]
- 11.Zhao J, Zhao J, Perlman S. 2010. T cell responses are required for protection from clinical disease and for virus clearance in severe acute respiratory syndrome coronavirus-infected mice. J Virol 84:9318–9325. doi: 10.1128/JVI.01049-10. [DOI] [PMC free article] [PubMed] [Google Scholar]
- 12.Castro RF, Perlman S. 1995. CD8+ T-cell epitopes within the surface glycoprotein of a neurotropic coronavirus and correlation with pathogenicity. J Virol 69:8127–8131. [DOI] [PMC free article] [PubMed] [Google Scholar]
- 13.Purtha WE, Myers N, Mitaksov V, Sitati E, Connolly J, Fremont DH, Hansen TH, Diamond MS. 2007. Antigen-specific cytotoxic T lymphocytes protect against lethal West Nile virus encephalitis. Eur J Immunol 37:1845–1854. doi: 10.1002/eji.200737192. [DOI] [PubMed] [Google Scholar]
- 14.Brien JD, Uhrlaub JL, Nikolich-Zugich J. 2008. West Nile virus-specific CD4 T cells exhibit direct antiviral cytokine secretion and cytotoxicity and are sufficient for antiviral protection. J Immunol 181:8568–8575. doi: 10.4049/jimmunol.181.12.8568. [DOI] [PMC free article] [PubMed] [Google Scholar]
- 15.Trandem K, Zhao J, Fleming E, Perlman S. 2011. Highly activated cytotoxic CD8 T cells express protective IL-10 at the peak of coronavirus-induced encephalitis. J Immunol 186:3642–3652. doi: 10.4049/jimmunol.1003292. [DOI] [PMC free article] [PubMed] [Google Scholar]
- 16.Badovinac VP, Messingham KA, Jabbari A, Haring JS, Harty JT. 2005. Accelerated CD8+ T-cell memory and prime-boost response after dendritic-cell vaccination. Nat Med 11:748–756. doi: 10.1038/nm1257. [DOI] [PubMed] [Google Scholar]
- 17.Wang Y, Lobigs M, Lee E, Mullbacher A. 2003. CD8+ T cells mediate recovery and immunopathology in West Nile virus encephalitis. J Virol 77:13323–13334. doi: 10.1128/JVI.77.24.13323-13334.2003. [DOI] [PMC free article] [PubMed] [Google Scholar]
- 18.Lanteri MC, O'Brien KM, Purtha WE, Cameron MJ, Lund JM, Owen RE, Heitman JW, Custer B, Hirschkorn DF, Tobler LH, Kiely N, Prince HE, Ndhlovu LC, Nixon DF, Kamel HT, Kelvin DJ, Busch MP, Rudensky AY, Diamond MS, Norris PJ. 2009. Tregs control the development of symptomatic West Nile virus infection in humans and mice. J Clin Invest 119:3266–3277. doi: 10.1172/JCI39387. [DOI] [PMC free article] [PubMed] [Google Scholar]
- 19.Trandem K, Anghelina D, Zhao J, Perlman S. 2010. Regulatory T cells inhibit T cell proliferation and decrease demyelination in mice chronically infected with a coronavirus. J Immunol 184:4391–4400. doi: 10.4049/jimmunol.0903918. [DOI] [PMC free article] [PubMed] [Google Scholar]
- 20.Wang T, Town T, Alexopoulou L, Anderson JF, Fikrig E, Flavell RA. 2004. Toll-like receptor 3 mediates West Nile virus entry into the brain causing lethal encephalitis. Nat Med 10:1366–1373. doi: 10.1038/nm1140. [DOI] [PubMed] [Google Scholar]
- 21.Daffis S, Samuel MA, Suthar MS, Gale M Jr, Diamond MS. 2008. Toll-like receptor 3 has a protective role against West Nile virus infection. J Virol 82:10349–10358. doi: 10.1128/JVI.00935-08. [DOI] [PMC free article] [PubMed] [Google Scholar]
- 22.Schoggins JW, MacDuff DA, Imanaka N, Gainey MD, Shrestha B, Eitson JL, Mar KB, Richardson RB, Ratushny AV, Litvak V, Dabelic R, Manicassamy B, Aitchison JD, Aderem A, Elliott RM, Garcia-Sastre A, Racaniello V, Snijder EJ, Yokoyama WM, Diamond MS, Virgin HW, Rice CM. 2014. Pan-viral specificity of IFN-induced genes reveals new roles for cGAS in innate immunity. Nature 505:691–695. doi: 10.1038/nature12862. [DOI] [PMC free article] [PubMed] [Google Scholar]
- 23.Martinez TN, Chen X, Bandyopadhyay S, Merrill AH, Tansey MG. 2012. Ceramide sphingolipid signaling mediates Tumor Necrosis Factor (TNF)-dependent toxicity via caspase signaling in dopaminergic neurons. Mol Neurodegener 7:45. doi: 10.1186/1750-1326-7-45. [DOI] [PMC free article] [PubMed] [Google Scholar]
- 24.Koprich JB, Reske-Nielsen C, Mithal P, Isacson O. 2008. Neuroinflammation mediated by IL-1beta increases susceptibility of dopamine neurons to degeneration in an animal model of Parkinson's disease. J Neuroinflammation 5:8. doi: 10.1186/1742-2094-5-8. [DOI] [PMC free article] [PubMed] [Google Scholar]
- 25.Tsunoda I, Fujinami RS. 1996. Two models for multiple sclerosis: experimental allergic encephalomyelitis and Theiler's murine encephalomyelitis virus. J Neuropathol Exp Neurol 55:673–686. doi: 10.1097/00005072-199606000-00001. [DOI] [PubMed] [Google Scholar]
- 26.Bennett JL, Elhofy A, Canto MC, Tani M, Ransohoff RM, Karpus WJ. 2003. CCL2 transgene expression in the central nervous system directs diffuse infiltration of CD45(high)CD11b(+) monocytes and enhanced Theiler's murine encephalomyelitis virus-induced demyelinating disease. J Neurovirol 9:623–636. [DOI] [PMC free article] [PubMed] [Google Scholar]
- 27.Trujillo JA, Fleming EL, Perlman S. 2013. Transgenic CCL2 expression in the central nervous system results in a dysregulated immune response and enhanced lethality after coronavirus infection. J Virol 87:2376–2389. doi: 10.1128/JVI.03089-12. [DOI] [PMC free article] [PubMed] [Google Scholar]
- 28.Getts DR, Terry RL, Getts MT, Muller M, Rana S, Shrestha B, Radford J, Van Rooijen N, Campbell IL, King NJ. 2008. Ly6c+ “inflammatory monocytes” are microglial precursors recruited in a pathogenic manner in West Nile virus encephalitis. J Exp Med 205:2319–2337. doi: 10.1084/jem.20080421. [DOI] [PMC free article] [PubMed] [Google Scholar]
- 29.Belkaid Y. 2007. Regulatory T cells and infection: a dangerous necessity. Nat Rev Immunol 7:875–888. doi: 10.1038/nri2189. [DOI] [PubMed] [Google Scholar]
- 30.Zhao J, Zhao J, Perlman S. 2014. Virus-specific regulatory T cells ameliorate encephalitis by repressing effector T cell functions from priming to effector stages. PLoS Pathog 10:e1004279. doi: 10.1371/journal.ppat.1004279. [DOI] [PMC free article] [PubMed] [Google Scholar]
- 31.Korn T, Reddy J, Gao W, Bettelli E, Awasthi A, Petersen TR, Backstrom BT, Sobel RA, Wucherpfennig KW, Strom TB, Oukka M, Kuchroo VK. 2007. Myelin-specific regulatory T cells accumulate in the CNS but fail to control autoimmune inflammation. Nat Med 13:423–431. doi: 10.1038/nm1564. [DOI] [PMC free article] [PubMed] [Google Scholar]
Associated Data
This section collects any data citations, data availability statements, or supplementary materials included in this article.


