Abstract
This paper discusses the properties of flexural waves governed by the biharmonic operator, and propagating in a thin plate pinned at doubly periodic sets of points. The emphases are on the design of dispersion surfaces having the Dirac cone topology, and on the related topic of trapped modes in plates for a finite set (cluster) of pinned points. The Dirac cone topologies we exhibit have at least two cones touching at a point in the reciprocal lattice, augmented by another band passing through the point. We show that these Dirac cones can be steered along symmetry lines in the Brillouin zone by varying the aspect ratio of rectangular lattices of pins, and that, as the cones are moved, the involved band surfaces tilt. We link Dirac points with a parabolic profile in their neighbourhood, and the characteristic of this parabolic profile decides the direction of propagation of the trapped mode in finite clusters.
Keywords: elastodynamics, wave dispersion, trapped waves, Dirac cones, platonic crystals
1. Introduction
There has been an explosion of interest in recent years in the properties and applications of topological insulators. These are naturally occurring materials for which the structures of adjacent bands, associated with electrons obeying the Schrödinger equation, can have the particular property of coming together at a single point called the Dirac point [1]. This band geometry endows materials such as graphene with a range of properties conducive to applications, such as sensitivity to applied electric or magnetic fields and the ability to conduct electrons in surface states free from dissipation or backscattering, even when containing substantial amounts of impurities. These properties pertaining to electrons obeying the Schrödinger equation or particles obeying the Dirac equation can also be encountered in systems governed by Maxwell's equations, and is known as topological photonics, as discussed by Lu et al. [2]. They have also been exhibited for surface acoustic waves [3] and in phononic crystals [4].
Time-harmonic flexural waves in thin plates are generally represented by linear combinations of two groups of fields, which incorporate solutions to the Helmholtz equation as well as evanescent fields that satisfy the modified Helmholtz equation. These fields are coupled via the boundary conditions as well as interface conditions where applicable. The interest in the dynamic response of periodically structured elastic plates is justified by a variety of important engineering applications. In particular, Green's functions for such structures and their dynamic response to an impulsive point loading were studied by Langley [5]. The analysis of vibration of plates on periodically distributed point supports was published by Mace [6], which was also followed by a more recent paper by Evans & Porter [7] modelling penetration of flexural waves through a periodically constrained thin elastic plate. The notion of platonic crystals was introduced by McPhedran et al. [8], which included a study of flexural Bloch waves in the context of dispersion surfaces, sandwiched between dispersion surfaces generated by the Helmholtz operator, followed by the concept of neutrality for flexural Bloch waves and demonstration of exponentially localized flexural vibrations in an unbounded structured plate.
The area of high-frequency homogenization for waves in structured media has been recently developed in the papers by Craster and co-workers [9–14]. These studies include a wide range of formulations for waves in lattices as well as structured continuous media. In particular, the high-frequency homogenization approach has been applied to flexural waves in [12,14], which has provided a valuable insight and analytical description for waves at frequencies in the neighbourhood of stop bands observed on the dispersion diagrams. The high-frequency homogenization approach has also covered the cases of dynamic anisotropy, corresponding to saddle points on the dispersion surfaces, where directional preference is observed along two characteristics constructed for the homogenization approximation [13,14].
Dispersion of flexural Bloch waves in a doubly periodic structure with a honeycomb arrangement of resonators was analysed by Torrent et al. [15] in a recent paper. The authors refer to such a structure as ‘an elastic analogue of graphene’, and present a valuable study of Dirac cones and edge states for flexural waves in honeycomb structured plates. Interesting applications are discussed in this paper in the framework of controlling the propagation of flexural waves in structured plates.
We will present here a discussion of topological platonics, showing how equivalent band geometries can be generated for flexural waves obeying the biharmonic equation. For a particular case of two-dimensional lattices of pinned points, it was shown by Smith et al. [16] that the same topological insulator geometry and band structure could be encountered in the centre of the Brillouin zone. Here, we will exploit the mathematical simplicity of the band structures associated with the biharmonic equation for arrays of pinned points to show how these interesting topologies can be steered along symmetry directions within the Brillouin zone by employing rectangular rather than square or triangular lattices. The ratio of the periods of the rectangular lattice is an extra parameter, which can be employed to steer the Dirac point along a symmetry direction, in a way similar to that used to control the filtering properties of stacked platonic gratings by Haslinger et al. [17]. The steering may be viewed simply, in that as the angle of wave propagation is altered, the separation of grating layers (or Fabry–Perot plates) needs to be adjusted to keep the phase associated with propagation from one layer to the next ‘on resonance’.
The discussion of the topology associated with bands coming together at a single point was initiated by P. A. M. Dirac, who recognized that this geometry arose because the electrons (or particles) near the point propagated like waves in free space, unimpeded by any interaction with the atoms of the lattice (or with the quantum vacuum). This phenomenon for the Dirac equation is expressed concisely by saying the bands near the Dirac point correspond to massless particles. A second way of describing this effect is to use the language of cloaking, and say that there are directions of neutral propagation around the Dirac point, where the wave propagates as if the crystal lattice were cloaked. This property of neutrality for platonic crystals was pointed out by McPhedran et al. [8], and was explained in a simple way in terms of the singular directions of the Green functions for the biharmonic equation.
The discussion of topological insulators distinguishes between Dirac points, where there are two perfect cones coming together at a point, and Dirac-like points, where this ideal geometry is perturbed [18]. In the case of topological platonics, the governing equation is of fourth order, not second order, and we show that, as well as the two cones, there is another dispersion surface passing through the point. This surface corresponds to a wave influenced by interaction with the lattice, i.e. it is associated with a solution with non-zero mass.
In §2, we give the governing equation for flexural waves of the Kirchhoff type, and describe the associated lattice sums and Green's functions arising for two-dimensional lattices. In §3, we discuss the connection between the rectangular lattice and the triangular lattice. For the latter, we describe the first two Dirac points, and the density of state (DOS) functions for flexural waves near each point. These DOSs functions are useful in describing the interaction between sources and flexural waves in the lattice structure. In §4, we explicitly solve the equations under which two plane wave dispersion surfaces intersect for the rectangular lattice, and the equations under which three dispersion surfaces intersect. The latter case gives the possible locations of Dirac points analytically. Section 5 discusses band diagrams and band surfaces for particular ratios of the two periods of the rectangular lattice; it is shown that ratios which are given by the square roots of integers exhibit particularly interesting behaviour. The contrast between massless and massive (non-zero mass) bands is highlighted, with this distinction depending upon the position of the Bloch vector in the Brillouin zone. Section 6 contains a discussion of flexural waves in finite systems (clusters) of pinned points. We show that unidirectionally localized modes of vibration can occur, and establish that their propagation direction corresponds to the single characteristic of a locally parabolic dispersion surface. In the concluding §7, we also discuss a concept of effective mass (as a scalar and tensorial quantity) and its link to the band structure for waves in the structured material. As a long established and useful idea in solid-state physics [19–21], it has now received novel mathematical treatments, mainly owing to the pioneering studies in high frequency homogenization by Craster and colleagues [9–11,14] among others [22,23]. Electronic supplementary material to the paper includes animations showing the evolutions of band surfaces with varying aspect ratios of the rectangular lattice.
2. Governing equation for thin plates
We begin with the biharmonic model for flexural wave propagation in thin plates, which is given by
| 2.1 |
Here we have assumed a time dependence of , where w denotes the out-of-plane displacement of the plate, Δ denotes the two-dimensional Laplacian, ω is the angular frequency and k is the non-dimensionalized wavenumber which satisfies the dispersion relation . For this model (e.g. [24]), D=Eh3/[12(1−ν2)] denotes the flexural rigidity of the plate; E is Young's modulus, ν is Poisson's ratio, h is the thickness of the plate, and ρm is the mass density per unit volume of the plate.
The zero-displacement condition for a pinned array of points is given by
| 2.2 |
where Rp denotes the real-space lattice vector corresponding to the location of the pins. Here we consider a rectangular lattice with periods dx, dy along the x- and y-axes, respectively, which gives rise to the complementary lattice vector pairs
| 2.3a |
and
| 2.3b |
where p=(px,py) and h=(hx,hy) denote multi-indices with integer components, A=dxdy and Kh is the reciprocal lattice vector. For the pinned array problem, we consider the plate displacement which is proportional to the quasi-periodic Green's function for the array. This Green's function is defined in terms of the rectangular lattice sums which can be expressed as
| 2.4a |
and
| 2.4b |
where in the polar form (r,θ) we denote Rp=(Rp,Θp). The lattice sum is only conditionally convergent and a suitable method of acceleration is required for effective numerical evaluation. Subsequently, we use the threefold integrated expressions [25]
| 2.5a |
and
| 2.5b |
Here, ζ is an arbitrary vector lying inside the Wigner–Seitz cell (WSC) with length . We define Qh=k0+Kh=(Qh,Φh) in polar form, and A=dxdy for the rectangular array. In terms of these lattice sums, the quasi-periodic Green's function is given by
| 2.6 |
where r=(r,θ) in polar form. From this representation we can recover [25] the dispersion equation via
| 2.7 |
This elegant dispersion equation is a consequence of the assumption of zero radius for the pins constituting the periodic array. If we were to consider finite circular inclusions, the dispersion equation would then be evaluated as the determinant of a block matrix [25,26].
As described in [8], the flexural wave bands of platonic crystals may be ‘sandwiched’ between light lines in reciprocal space which arise from singularities in the lattice sum (2.5a) (when Qh=k). In the case of rectangular arrays they take the particular form
| 2.8 |
for integers hx, hy. The sandwiching property refers to points where light lines constrain the dispersion curves of flexural waves in reciprocal space.
3. Equivalences between lattice geometries: triangular and rectangular lattices
In the following sections, we explore the rectangular pinned lattice for various aspect ratios ρ=dy/dx. Conical dispersion surfaces at finite frequencies are observed for high symmetry structures, and the vertices of such cones are related to multiple roots of the corresponding dispersion equation. For example, such conical surfaces are clearly visible in figure 9a,b. These cones are referred to as Dirac cones, and correspondingly their vertices are Dirac points. The Dirac cones that we observe include those for the square and triangular (hexagonal) lattices. The fact that we see the Dirac cones for the triangular lattice follows from the correspondence between a subset of the points of the triangular lattice and those of the rectangular lattice for . That is, if we take a triangular lattice and form a sublattice by taking every even value of py (3.1a), the result is equivalent to a rectangular lattice with aspect ratio . This equivalence is straightforward to observe if we numerically evaluate (2.3a) and the array vectors for the triangular lattice which are given by
| 3.1a |
Consequently, the modes for the triangular lattice may be viewed as the modes of two interlaced rectangular lattices. Given this equivalence between the rectangular and triangular arrays, we begin with an investigation of the Dirac points of a triangular lattice. Note that the triangular lattice is distinct from the honeycomb lattice, the latter not being a Bravais lattice and being generated by superposing two triangular arrays, i.e. where
| 3.1b |
Using the subscript T to denote the triangular lattice, the dispersion equation for a triangular lattice of pinned points is
| 3.2 |
with AT being the area of the Wigner–Seitz cell of the triangular lattice. Here the quasi-periodic reciprocal lattice vectors for the triangular lattice are given in Cartesian form by
| 3.3 |
for integers hT1, hT2.
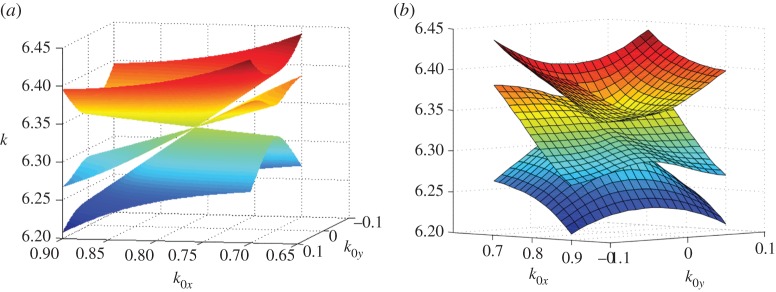
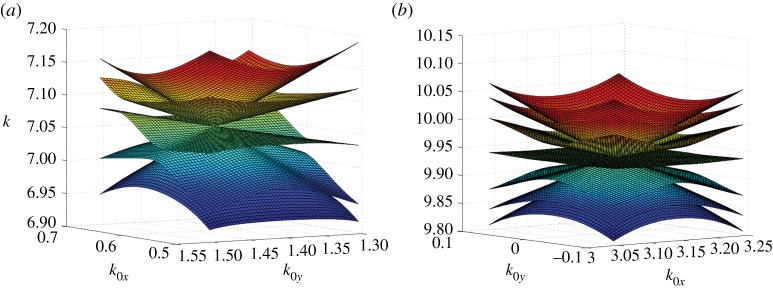
Figure 9.
Two views of the dispersion surfaces near the Dirac point at k= 6.3320 located between the symmetry points Γ and X at (k0x,k0y)=(0.7828,0), corresponding to an aspect ratio of ρ=2. The central band is sloped at the Dirac point in contrast to Dirac points of high symmetry. (Online version in colour.)
We can also consider the analogous expression corresponding to two shifted and superposed rectangular arrays
| 3.4a |
where . In the second term, the exponent simplifies to −icT⋅Kh, or −iπ(hx+hy), so that (3.4a) becomes
| 3.4b |
The sum in (3.4b) is thus restricted to integers hx and hy such that hx+hy is even. Given that
| 3.5 |
the solutions to (3.4b) and (3.2) are consistent, provided that
| 3.6 |
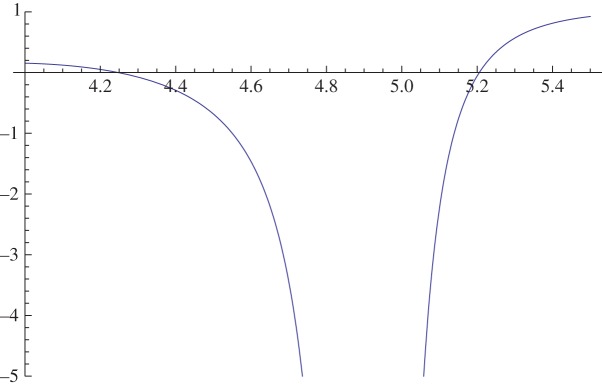
In figure 1, we show the form of the dispersion line coming from equation (2.7) as a function of k. In this case, there are two zeros near k=4.24743 and k=5.20563. In the former case, the Bloch condition for η is satisfied, whereas in the second it has a sign minus that required by the Bloch condition. Thus, only the former zero gives a solution of the dispersion equation consistent with the Bloch condition for the triangular lattice.
Figure 1.
The function G(0;k,k0) as a function of k for a triangular lattice (3.1a) where d=1, k0x=k0y=0. Note the two zeros near k=4.2 and k=5.2. (Online version in colour.)
(a). The first Dirac point
Interesting Dirac cone topologies occurring near the origin in reciprocal space (k0x,k0y)=(0,0) were investigated by Smith et al. [16]. For their case, the first Dirac point has . Figure 2 shows the intersection points of the relevant light lines in the neighbourhood of the Dirac point. It can be seen that the light lines given by equation (2.8) are well approximated by straight lines in the vicinity of the Dirac point. The intersection point of the light lines defined by the indices (1,1) and (−1,1) is given by
| 3.7a |
which when expanded about kD1 becomes
| 3.7b |
This gives the value 2 for the radius of the outer Dirac cone (figure 3). The intersection point of the light lines (1,1) and (0,2) is
| 3.8a |
which when expanded about kD1 gives
| 3.8b |
Thus, the radius of the inner Dirac cone is (figure 3). As can be seen from figure 2, the six light lines (±1,±1) and (0,±2) are all involved in defining the inner and outer Dirac cones.
Figure 2.
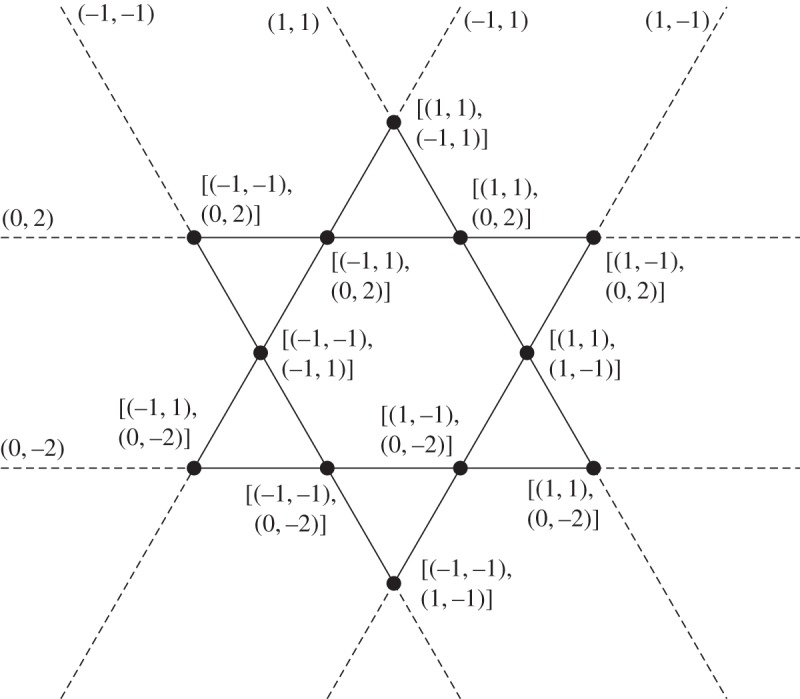
Light lines labelled by the integers (hx,hy) are shown in the vicinity and above the first Dirac point at . The dots at the intersection points define an outer and an inner Dirac cone, which decrease in radius towards zero as k tends to its value at the Dirac point.
Figure 3.
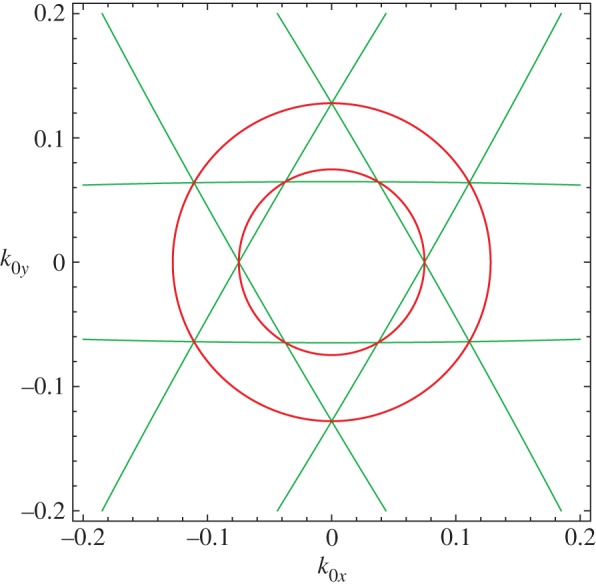
Light lines are shown in the vicinity of the first Dirac point at . The circular curves have the radii 2(k−kD1), , and they coincide to numerical accuracy with the isofrequency contours for the triangular lattice for kdx=7.32. (Online version in colour.)
(b). The second Dirac point
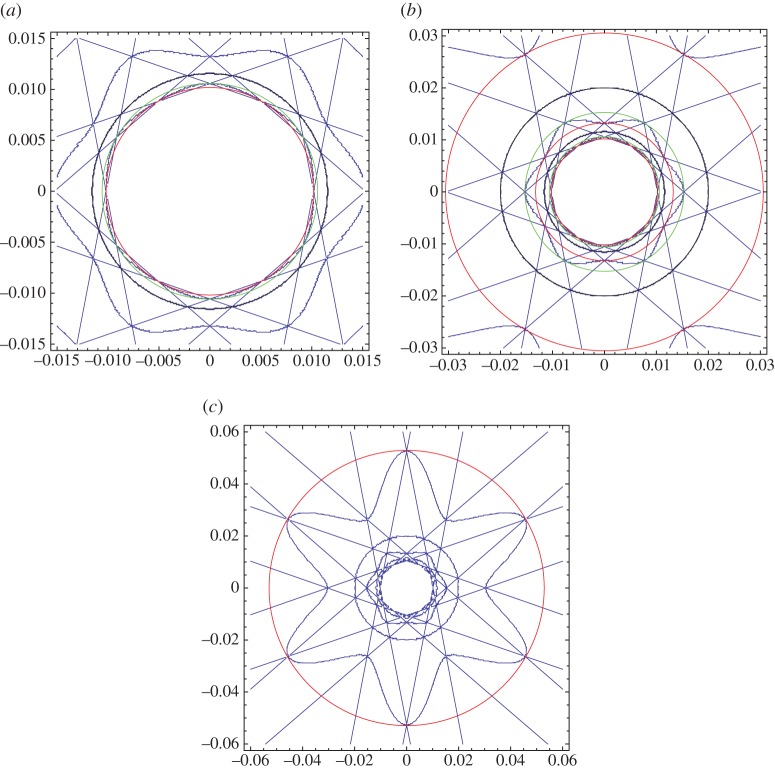
The second Dirac point at k0x=k0y=0 has . It is constructed by the intersection of 12 light lines rather than the six of the first Dirac point. These are defined by (hx,hy) taking the values (3,2), (−3,−2), (3,1), (−3,−1), (2,3), (−2,−3), (2,−1), (−2,1), (1,3), (−1,−3), (1,−2) and (−1,2). Constructing the intersection points of each pair of light lines and choosing the root of smaller magnitude, we arrive at 48 pair intersections, from which their distances from the Dirac point are calculated. Also expanding the distance in terms of Δk=k−kD2 in the form
| 3.9 |
we arrive at eight sets of coefficients, given in table 1. The first two of these give in symbolic and numeric form the connection between the radius in the space of (k0x,k0,y) and Δk. The third gives the curvature of the cone structure, whose sign is always such as to make the cone curve towards smaller radius. As can be seen in figure 4, the structure surrounding the second Dirac point consists of three distorted circles, with two intervening circles. The former are characterized by inner and outer radii, and the latter by 12 intersection points all lying at the same radius. If we define a proportionate distortion as the difference between the outer and inner radii, divided by their mean, then the proportionate distortion increases by the ratio between the first and second distorted circles, and also between the second and third.
Table 1.
The coefficients α, giving the cone radius, and β, giving the curvature, for the eight elements of the structure around the second Dirac point at (k0x,k0y)= (0,0). The fourth column denotes whether the cone is a bounding cone (inner or outer) for a non-circular contour, or an actual conical band surface (cone). The final column gives the coefficient of |k−kD2| in the contribution to the DOS from each cone.
| α | ≃α | β | description | γi |
|---|---|---|---|---|
| 1.01835 | inner | |||
| 1.05830 | outer | |||
| 1.15470 | cone | |||
| 1.32288 | inner | |||
| 1.52753 | outer | |||
| 2 | 2.00000 | cone | ||
| 3.05505 | inner | |||
| 5.29150 | outer |
Figure 4.
Light lines are shown in the vicinity of the Dirac point at with k−kD2= 0.01. The isofrequency contours for the triangular lattice correspond to kdx=19.20. The circular contours are of radius 0.01γi, with γi given in table 1, and bound the isofrequency contours. (a–c) Correspond to increasing ranges of Δk. (Online version in colour.)
(c). Density of states near the first Dirac point
The conical band surfaces above and below the first Dirac point are sandwiched by light lines along certain directions in reciprocal space. This fact allows us to obtain the group velocity for the band analytically, and therefore the DOS. The light lines for a triangular lattice are given by
| 3.10 |
In particular, the inner cone below the first Dirac point is sandwiched along ΓK, or along the path between the light lines given by (m,n)=(−1,−1) and (m,n)=(0,−1). Using this parametrization and either of these index pairs, we can establish that the slope of the cone is given by
| 3.11a |
From [27], it is known that |vg|=2k|∂tk|, and so at t=0, . The outer cone below the Dirac point is sandwiched between the light lines with indices (−1,−1) and (1,0) along the path ΓM or k0=(0,t), which admits
| 3.11b |
with a corresponding group velocity at t=0, |vg|=k. It has been shown previously that the leading coefficient for the radius of the outer circle near the first Dirac point is given by r1=2|k−kD1|, and that for the inner circle we have . From [27], the DOS can be expressed as
| 3.12 |
and, as the product of the areas of the Wigner Seitz cell and the Brillouin zone is 4π2 in two dimensions,
| 3.13 |
where γi represents the contribution to the DOS from the ith band surface. These are given by . The central flat band (trapped between the light lines with indices (−1,0) and (1,0) along ΓK) has
| 3.14 |
and |vg|=0 at t=0; however, the DOS is not unbounded as the length of the isofrequency contour at k=kD1 is zero. A careful examination of this limit shows that the central band contributes a Heaviside step function at k=kD1.
(d). Density of states at the second Dirac point
We now proceed to an investigation of the DOS near the second Dirac point of the triangular lattice at , where we have 11 degenerate bands collapsing to a single point. For this point, only some of these bands are perfect cones. By carefully examining the light line surfaces about this point, it can be shown that the non-circular contours are bound by circles as we approach the Dirac point. This can be seen in figure 4, with radii and curvatures listed in table 1.
If we assume that the contribution to the DOS from each curved surface is equal to the contribution from their bounding cones, we can repeat the procedure used above for the first Dirac point, to obtain an analytical expression for the DOS as we approach the second Dirac point. For example, for the lowest band surface (which is non-conical) we have an inner radius given by a light line crossing in the direction involving the indices (m,n)=(−1,−3) and (−2,−3). At this point the slope of either light line is given by
| 3.15a |
with a corresponding group velocity at t=0, . This inner circle has a radius of and thus the leading-order contribution to the DOS is given by
| 3.15b |
The outer cone has a light line crossing in the direction k0=(t,0) involving the indices (−1,−3) and (1,−2), giving rise to the slope
| 3.15c |
and at t=0, , with a radius giving rise to the leading-order contribution
| 3.15d |
4. Dispersion and degenerate light lines
We illustrate solutions of the dispersion equation G(0;k,k0)=0 for the rectangular lattice, and in particular, we will be interested in the conditions required to create degenerate light lines for the rectangular lattice. The light line equation for the mode (n,m) is
| 4.1 |
We define rescaled, dimensionless quantities: κx=k0xdx/(2π), κy=k0ydy/(2π), with corresponding to the first quadrant of the Brillouin zone. If K=(kdx)/(2π) and ρ=dy/dx, then the light line equation (4.1) becomes
| 4.2 |
The condition for the light line for mode (n,m) to coincide with that for mode (n′,m′) is then
| 4.3 |
This is a straight line in the reciprocal space, which is only of interest if it lies within the Brillouin zone. The straight line is independent of the value of K or k, but given the point (κx,κy) on it, K and k can be determined from equation (4.2) or equation (4.1). Note the special case m=m′, for which
| 4.4a |
Allowed solutions in this special case are
| 4.4b |
There is a second special case, n=n′, in which
| 4.5a |
Allowed solutions in this second special case are
| 4.5b |
As an example of the use of (4.4a), we show in figure 5 degenerate light line trajectories corresponding to five integer quartets. Note the triple intersection at the top of the plot. It corresponds to , and . The numerical value of k is approximately 2.00308π. We next find the intersection of the degenerate light lines corresponding to the quartets (n,m,n′,m′) and (n,m,n′′,m′′). These intersect at a point in the Brillouin zone for which
| 4.6a |
with
| 4.6b |
and
| 4.6c |
Also,
| 4.7a |
with
| 4.7b |
and
| 4.7c |
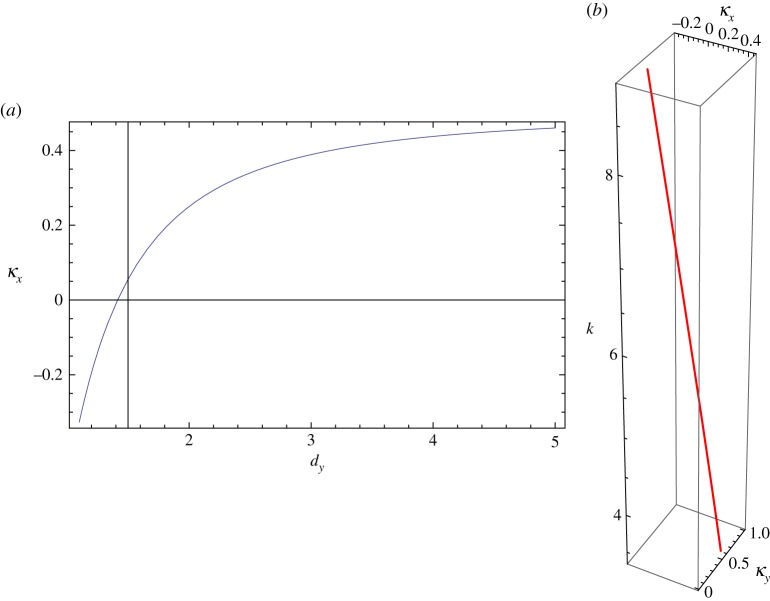
At such points at least three light lines (and possibly more) intersect, with the latter possibility easily verified given the knowledge of (κx,κy,k). Figure 6 shows two plots generated using the expressions (4.6a), (4.7a). The first gives κx as a function of dy, with for the case in question independent of dy. The value of dy for which κx is zero is . The second plot is a parametric curve along which the parameter dy changes from 1.1 to 5, with κx, κy and k all varying according to dy.
Figure 5.
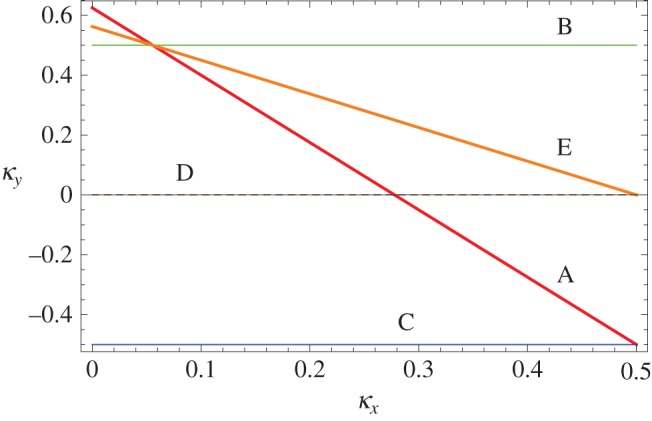
Degenerate light line trajectories in the first quadrant of the Brillouin zone for dx=1, . The line labels correspond to the following integer quartets (n,m,n′,m′): A (−1, 0, 0, 1); B (−1,0,−1,−1); C (−1,0,−1,1); dashed D (and obscured by the central line) (−1,−1,−1,1); E (−1,−1,0,1). (Online version in colour.)
Figure 6.
(a) κx as a function of dy with dx=1 for the triple intersection of light lines specified by the sextet (n,m,n′,m′,n′′,m′′)=(−1,0,0,1,−1,−1). (b) A parametric plot giving k as a function of κx and κy, the parameter being dy, which ranges from 1.1 to 5. (Online version in colour.)
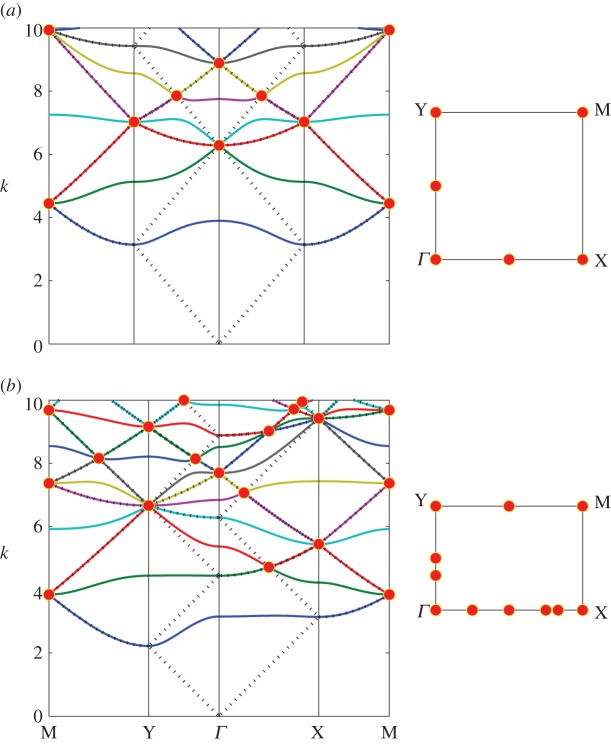
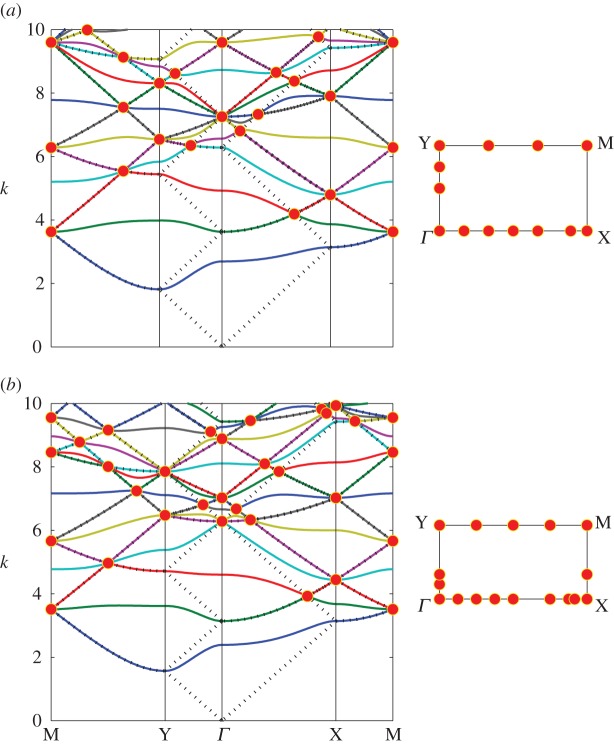
A selection of band diagrams for different aspect ratios is presented in figures 7 and 8. The aspect ratios chosen are square roots of integers, resulting in large numbers of triple intersections (not all at points of high symmetry in the Brillouin zone).
Figure 7.
The band diagrams for (a) ρ=1, and (b) , as we trace a path around the edge of the Brillouin zone for a rectangular array geometry. The points of light line triple intersections, given by (a) and (a), are highlighted with small discs, and inset is the top-down projection of these discs to the edges of the zone. (Online version in colour.)
Figure 8.
The band diagrams for (a) , and (b) , along the edges of the Brillouin zone for a rectangular array geometry. (Online version in colour.)
5. Inertia of the elastic structure at Dirac points
The physics of flexural waves differs from that of solutions to the Helmholtz or Schrödinger equations. The latter are important in solid states physics and quantum mechanics, and in the literature, two types of structures associated with Dirac points are encountered.
The first of these is said to correspond to ‘massless particles’, pertaining to solutions which correspond to an ‘empty lattice’. These band surfaces have the geometry of perfect cones.
The second type of solution corresponds to perturbed cones, where the neighbourhood of the vertex appears to be regularized and the surface is rounded, with the associated particles being said to be ‘massive’, acquiring their mass through their interaction with the lattice. The mass being referred to here is the effective mass, also mentioned in §7, see in particular expression (7.1). It is interesting that the band surfaces in the vicinity of the Dirac point are essentially given by the singularities of the Helmholtz equation (which are termed light lines in the photonic crystal literature), except for the one surface for which the flexural wave equation must be taken into account. Of course, the flexural wave equation involves both solutions of the Helmholtz equation and the modified Helmholtz equation. The coupling between these two equations gives rise to a Green's function which is finite at the source point [28,7], rather than being singular as in the case of the Helmholtz equation (a profound mathematical difference). A related phenomenon can occur in graphene physics and phononics [4,29,30] which requires a tuning of a physical parameter, for example the radius of the inclusions, whereas the massive band discussed here occurs in a perfect crystal with no tuning parameter present (a systematic rather than accidental effect). The effects of dynamic anisotropy, with the special emphasis on standing modes excited inside the Brillouin zone, away from its edges, were highlighted in [13,14].
For the solutions of the biharmonic equation considered in this paper, a different geometry occurs. The cone structures correspond to solutions sandwiched between light lines, and are associated with neutral lines, i.e. there is no interaction with the lattice. Once again, these may be described as massless. However, between the massless solutions converging to a perfect point, there exists a solution governed by the dispersion equation for flexural waves in the lattice (2.7). This is the massive solution. To distinguish this geometry for flexural waves, we will refer to the massless Dirac cones as being augmented by the massive solution. Note that the massive solution has a dispersion equation which guarantees that it intersects points of high symmetry in the Brillouin zone.
When viewed on a three-dimensional diagram, the surfaces corresponding to massive solutions, such as those in figures 9 and 10, have at least one vanishing derivative of ω with respect to components of the Bloch vector at the points of intersection (this property is not readily visible on conventional dispersion diagrams confined purely to lines of high symmetry). In essence, the group velocities of the massive bands go to zero, with the finite values for the DOS functions for Dirac cones given in table 1 (see equation (3.13) for a discussion of the impact of this on the DOS). In summary, the topology of what we term an augmented Dirac point for flexural waves has at least one massive central band and massless bands with frequencies above and below. This topology is present for flexural waves as they obey a fourth-order differential equation, rather than the second order Schrödinger or Helmholtz equations. An interesting feature of the massless and massive bands is that the distinction between them is directionally dependent in the Brillouin zone. For example, in figure 7b corresponding to an aspect ratio of at k(Y)≈6.8 we have reading from bottom to top in k for the segment MY the bands being: neutral, massive, neutral, massive and neutral. Reading in the same order along YΓ the bands are massive, neutral, massive, neutral and massive. The manner of construction for this typical band diagram makes this change of order appear to be sudden, whereas if viewed on a three-dimensional band surface, it is of course, gradual. In table 2, we summarize the key data describing the movement of Dirac cones along symmetry lines in the Brillouin zone for aspect ratios of the rectangular lattice varying from to .
Figure 10.
Three-dimensional band surfaces in the vicinity of (a) for , demonstrating a double Dirac-like cone away from a point of symmetry and (b) a triple Dirac-like cone at k0=X for ρ=2. (Online version in colour.)
Table 2.
A summary of aspect ratios corresponding to the start of Dirac cone transits along the edge of the Brillouin zone for k<10. Note that ‘double’ refers to a double Dirac cone at the starting point which gives rise to a single Dirac cone transit, and similarly ‘triple’ (triple Dirac cones) coincides with four Dirac cone transits. Futhermore, AB denotes a transit from the symmetry point A to the symmetry point B.
| ρ | k0 | k | ≃k | trajectories | cone type |
|---|---|---|---|---|---|
| M | 9.9346 | one along MX | double | ||
| Y | 6.6643 | one along YM | double | ||
| X | 3π | 9.4248 | one along XM | double | |
| Γ | 7.2552 | one along ΓX | double | ||
| M | 9.5977 | two along MX and two along MY | triple | ||
| X | 9.9346 | two along XM and two along XΓ | triple | ||
| Y | 7.8540 | one along YM | double | ||
| Γ | 8.4298 | one along ΓX | double | ||
| special case: double at k=7.0529 between MY at | |||||
| M | 9.5116 | two along MY and two along MX | triple | ||
| Y | 6.4127 | one along YM | double | ||
| Y | 8.9778 | one along YM | double | ||
| Γ | 9.4993 | one along ΓX | double | ||
| special case: double at k=7.8146 between MY at | |||||
| Γ | 6.6643 | one along ΓX | double | ||
| Y | 9.9965 | one along YM | double | ||
| X | 3π | 9.4248 | one along XΓ | double | |
| M | 9.9346 | two along MX and two along MY | triple | ||
| M | 9.4770 | two along MY and two along MX | triple | ||
6. Unidirectionally localized vibration modes in platonic clusters
According to Craster et al. [9], the notion of high-frequency homogenization is introduced with reference to a critical point on the dispersion surface where the group velocity is equal to zero. Given a standing wave frequency, both the Bloch vector and the frequency are perturbed and an asymptotic solution is written in the form of a product of the rapidly oscillating standing wave and a smooth envelope function, which satisfies a partial differential equation, referred to as an homogenized equation. It was also noted in [13,14,31] that this equation does not have to be elliptic. In other words, the homogenized solution may exhibit localization along some preferred directions. In particular, in [32] such solutions are referred to as star-shaped wave forms and correspond to a hyperbolic homogenized equation for the envelope function. Furthermore, the preferred directions are aligned with the characteristics of this hyperbolic equation.
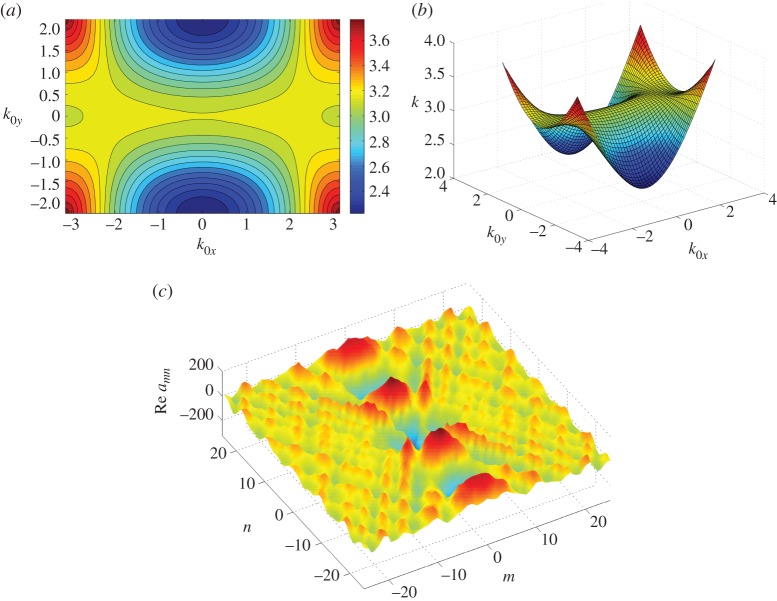
In the framework of the approach presented here, we have discovered a new phenomenon for flexural elastic waves, corresponding to envelope functions that satisfy homogenized equations of the parabolic type. This effect has never been addressed before for flexural plate structures (however, such behaviour, referred to as the ‘line-defect’ effect, has been observed previously in metamaterials [11]). There is also an apparent connection with the position of Dirac cones. Namely, a parabolic cylindrical profile of the dispersion surface occurs in close proximity to Dirac cone points. The corresponding wave forms can propagate freely along the direction of the generator of the cylinder and are localized in the orthogonal direction. To illustrate this finding, we refer to the dispersion diagram in figure 7b, where Dirac cone points are clearly identified, as well as stationary points where the group velocity of Bloch waves in an infinite periodic structure is equal to zero. First, an accurate study of the full three-dimensional dispersion surface in the first pass band reveals a parabolic profile at the frequency of k=3.1538. This surface is displayed in figure 11, and is also accompanied by the contour line diagram on the inset of the same figure. An independent test has been performed for a sufficiently large but finite cluster, which has been ‘cut out’ of the doubly periodic system. A frequency response problem has been studied for the case when a finite time-harmonic displacement has been applied to the central pin of the cluster, whereas the remaining pins of the cluster remain fixed. The solution method for finite pinned platonic crystals or platonic clusters [8,33,34] is as follows. For the problem of a plate which is constrained at a set of points, where the pin at x00 is forced, we can express the displacement in the form
| 6.1 |
where xmn=(mdx,ndy). The free-space Green's function for the biharmonic operator is given by
| 6.2 |
which satisfies
| 6.3 |
We then specify the boundary conditions w(xpq)=δp0δq0 to obtain the linear system
| 6.4 |
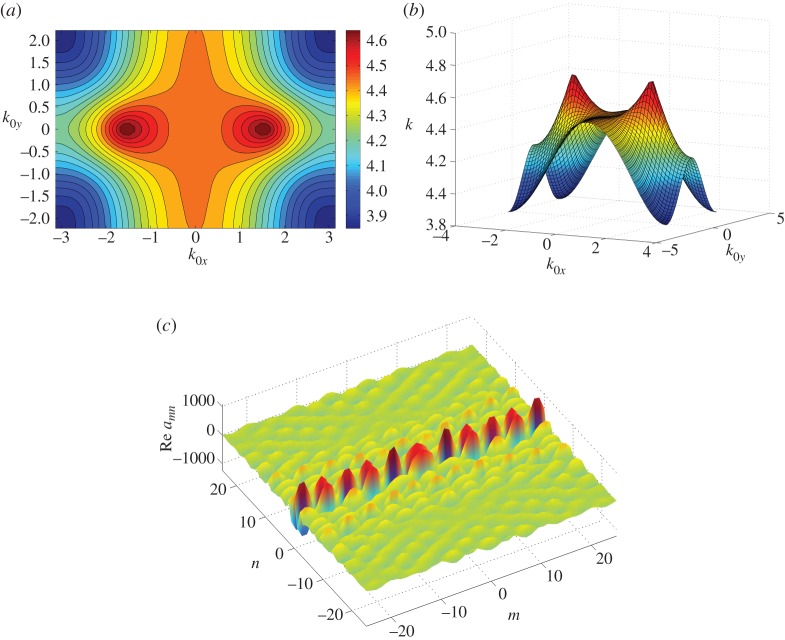
where Aij=g(xi,xj) which refers to the index pairs (m,n) and (p,q) and fj=δp0δq0 for the unknown amn coefficients. Using (6.1), we are able to generate displacement fields for different finite clusters which possess an interior rectangular lattice geometry. For a suitably chosen geometry and size, we are able to demonstrate the features of an infinite array of pinned points. Thus, the forces amn have been computed and then plotted at every pin of the structure, as shown in figure 11c. For the case of a unidirectional localization, the spikes of the force values are concentrated along a single line. The orientation of localized modes depends on the position of the neighbouring Dirac points in reciprocal space. The form of the localized modes does not depend on the choice of the source point positioned properly within that cluster. The above statement becomes evident when we refer to figure 12, which contains a dispersion surface and a unidirectional localized mode at the frequency of k=4.4. The locally parabolic surface occurs between two conical regions, and the corresponding frequency of the unidirectional mode is just below the frequency value identified for the vertex of the Dirac cone. The corresponding localized mode is also shown on the inset of the same figure. It is worth mentioning that the orientations of the unidirectional modes in figures 11 and 12 are mutually orthogonal to each other. It will be interesting to investigate the correspondence between unidirectional modes in finite clusters and surface waves on semi-infinite flexural structures.
Figure 11.
(a) Contour and (b) surface plot for the first dispersion surface corresponding to over the entire Brillouin zone. The amn coefficients showing the forces imposed (to enforce pinned conditions) at k=3.069 are given in (c) and correspond to a localized mode along the y axis. (Online version in colour.)
Figure 12.
(a) Contour and (b) surface plot for the second dispersion surface corresponding to over the entire Brillouin zone. The amn coefficients showing the forces imposed (to enforce pinned conditions) at k=4.4000 are given in (c) and correspond to a localized mode along the x axis. (Online version in colour.)
7. Concluding remarks
If one looks for a design of a doubly periodic structure leading to Dirac cones on the dispersion surfaces for Bloch waves, then rectangular lattices would generally be considered inferior compared with triangular systems that possess high symmetry. On the contrary, a ‘steering algorithm’ has been given here to tune a doubly periodic rectangular system of pins to obtain multiply nested Dirac cones for flexural Bloch waves. Consequently, ‘parabolic’ unidirectionally localized vibration modes have been also identified for flexural vibrations in large clusters of rectangular arrays of rigid pins.
The regimes corresponding to band gap edges, as well as neighbourhoods of Dirac cones are especially important, and we acknowledge the work by Craster and colleagues [9–14] that has developed the high-frequency homogenization approach leading to an evaluation of the effective properties of structured materials in such dynamic regimes. This represents a substantial generalization of long-established homogenization theory, which, however, only applies for low frequencies. The mathematical treatment, not surprisingly, yields expressions involving entities strongly related to the effective mass (scalar or tensor), emanating from a separation of the governing equation into a function varying rapidly with spatial position, multiplied by an envelope function, varying on a much larger scale. This procedure has been developed to both the Helmholtz and the biharmonic equations [9–11] and [14] with the last being highly relevant to this paper.
For comparison, in the study of the behaviour of electrons governed by the Schrödinger equation in crystal lattices, a key idea is that of effective mass, both as a scalar and as a tensor quantity [19]. The notion of effective mass comes from a transformation of the Schrödinger equation in the vicinity of a band edge into a form reminiscent of Newton's second law
| 7.1 |
where F is the applied force acting on the electron; , the scaled Planck's constant; vg, the group velocity; ϵ, the electron energy in the crystal and k0, a Bloch parameter. Since ∂vg/∂t can be interpreted as an acceleration of the electron wave, the analogy with Newton's second law leads to the interpretation of the term in brackets as an effective mass. The effective mass concept is most useful for electrons in crystals near band edges and the effective mass is thus reciprocally related to the curvature of the band structure at the edge. The quantity is amenable to both theoretical treatments and experimental measurements. It can be extended to other types of waves; for example, it has recently been applied to defects in photonic crystals by Mahmoodian et al. [21].
Acknowledgements
We are grateful to the anonymous referees for their helpful and constructive feedback. We would like to thank Prof. R. V. Craster for reading the manuscript of the paper and for valuable suggestions.
Appendix A. Description of the animations
(i) Animation 1 (doi:10.6084/m9.figshare.1186824). In this animation, we observe the evolution of the band diagram as we alter the aspect ratio ρ of our rectangular array of pinned points through the range . Also presented here are the the light line surfaces along the edges of the Brillouin zone. It is clearly apparent that there are Dirac point transits along the edges of the zone, which come together when ρ takes square root integer values. One other interesting feature observed include the closing of the low frequency band gap with increasing aspect ratio.
(ii) Animation 2 (doi:10.6084/m9.figshare.1186825). In this animation, we present the same band diagram evolution as in Animation 1, except over the shorter interval 1<ρ<3. Here we superpose the triple point intersections given in (4.6a) and (4.7a) and accompany the diagram with the top-down projection of these points along the edges of the Brillouin zone. This animation follows the style of figures 7 and 8, and a summary of the evolution of these Dirac points is given in table 2.
(iii) Animation 3 (doi:10.6084/m9.figshare.1186826). In this animation, we present the first few three-dimensional band surfaces for a rectangular array of pinned points corresponding to the aspect ratio . This movie presents the dynamic and ever-changing behaviour of the slowness surfaces (isofrequency contours for ) as we move through increasing wavenumber k (as observed through the cut plane advancing through k in the right-hand side figure).
(iv) Animation 4 (doi:10.6084/m9.figshare.1186827). This animation tracks the tilting of a single Dirac cone (with central flat band) as it transits between symmetry points for increasing aspect ratio values between . This cone starts at a double Dirac cone at M and terminates at at X to form a double Dirac point, of which we see the central and two upper bands in the final moments of the simulation (see table 2 for further details).
Data accessibility
The work does not use any experimental data. All computational findings presented in the paper are reproducible from the analytical formulae included in the manuscript. Illustrative animations for steering of Dirac cones are accessible via DOI codes included in appendix A.
Funding statement
A.B.M. gratefully acknowledges support from the U.K. Engineering and Physical Sciences Research Council Programme grant EP/L024926/1. R.C.M., N.V.M. and M.B. gratefully acknowledge financial support from the European Community's Seven Framework Programme under contract numbers PIAP-GA-2011-286110-INTERCER2, PIAPP-GA-28544-PARM-2 and PIEF-GA-2011-302357-DYNAMETA. M.J.A.S. would like to acknowledge the support of Dr Sebastien Guenneau and resources provided through his ERC starting grant ANAMORPHISM.
Authors contributions
All authors of the paper have provided substantial contributions to conception and design of the model, analysis and interpretation of the results, writing the article and revising it following helpful and constructive suggestions of the referees. All authors of the paper have given final approval of the version to be published. R.C.M., M.J.A.S. have developed an evolution algorithm for tracing Dirac cone steering. The animations included in the supplementary material to the paper were produced by M.J.A.S. Comparative analysis of Dirac cone structures for rectangular and triangular lattices was performed by R.C.M. and M.B. The concept of parabolic trapped modes and their connection to Dirac cones systems was introduced by A.B.M., N.V.M. and M.B. Simulation and analysis of unidirectional localized modes was performed by M.B., A.B.M. and N.V.M. Important verifications for the dispersion surfaces were performed by M.J.A.S.
Conflict of interests
The authors of the paper have no competing interests.
References
- 1.Hasan MZ, Kane CL. 2010. Colloquium: topological insulators. Rev. Mod. Phys. 82, 3045 (doi:10.1103/RevModPhys.82.3045) [Google Scholar]
- 2.Lu L, Joannopoulos JD, Soljačić M. 2014. Topological photonics. (http://arxiv.org/abs/1408.6730. )
- 3.Torrent D, Sánchez-Dehesa J. 2012. Acoustic analogue of graphene: observation of Dirac cones in acoustic surface waves. Phys. Rev. Lett. 108, 174301 (doi:10.1103/PhysRevLett.108.174301) [DOI] [PubMed] [Google Scholar]
- 4.Liu F, Lai Y, Huang X, Chan CT. 2011. Dirac cones at k=0 in phononic crystals. Phys. Rev. B. 84, 224113 (doi:10.1103/PhysRevB.84.224113) [Google Scholar]
- 5.Langley RS. 1997. The response of two-dimensional periodic structures to impulsive point loading. J. Sound Vib. 201, 235–253. (doi:10.1006/jsvi.1996.0542) [Google Scholar]
- 6.Mace BR. 1996. The vibration of plates on two-dimensionally periodic point supports. J. Sound Vib. 192, 629–643. (doi:10.1006/jsvi.1996.0211) [Google Scholar]
- 7.Evans DV, Porter R. 2007. Penetration of flexural waves through a periodically constrained thin elastic plate in vacuo and floating on water. J. Eng. Math. 58, 317–337. (doi:10.1007/s10665-006-9128-0) [Google Scholar]
- 8.McPhedran RC, Movchan AB, Movchan NV. 2009. Platonic crystals: Bloch bands, neutrality and defects. Mech. Mater. 41, 356–363. (doi:10.1016/j.mechmat.2009.01.005) [Google Scholar]
- 9.Craster RV, Kaplunov J, Pichugin AV. 2010. High-frequency homogenization for periodic media. Proc. R. Soc. A 466, 2341–2362. (doi:10.1098/rspa.2009.0612) [Google Scholar]
- 10.Antonakakis T, Craster RV, Guenneau SG. 2013. High-frequency homogenization of zero-frequency stop band photonic and phononic crystals. New J. Phys. 15, 103014 (doi:10.1088/1367-2630/15/10/103014) [Google Scholar]
- 11.Antonakakis T, Craster RV, Guenneau S. 2013. Asymptotics for metamaterials and photonic crystals. Proc. R. Soc. A 469, 20120533 (doi:10.1098/rspa.2012.0533) [DOI] [PMC free article] [PubMed] [Google Scholar]
- 12.Antonakakis T, Craster RV. 2012. High-frequency asymptotics for microstructured thin elastic plates and platonics. Proc. R. Soc. A 468, 1408–1427. (doi:10.1098/rspa.2011.0652) [Google Scholar]
- 13.Craster RV, Antonakakis T, Makwana M, Guenneau S. 2012. Dangers of using the edges of the Brillouin zone. Phys. Rev. B 86, 115130 (doi:10.1103/PhysRevB.86.115130) [Google Scholar]
- 14.Antonakakis T, Craster RV, Guenneau SG. 2014. Moulding and shielding flexural waves in elastic plates. Europhys. Lett. 105, 54004 (doi:10.1209/0295-5075/105/54004) [Google Scholar]
- 15.Torrent D, Mayou D, Sánchez-Dehesa J. 2013. Elastic analog of graphene: Dirac cones and edge states for flexural waves in thin plates. Phys. Rev. B 87, 115143 (doi:10.1103/PhysRevB.87.1151431) [Google Scholar]
- 16.Smith MJA, McPhedran RC, Meylan MH. 2014. Double Dirac cones at k=0 in pinned platonic crystals. Wave Random Complex 24, 35–54. (doi:10.1080/17455030.2013.862351) [Google Scholar]
- 17.Haslinger SG, Movchan AB, Movchan NV, McPhedran RC. 2014. Symmetry and resonant modes in platonic grating stacks. Wave Random Complex 2, 126–148. (doi:10.1080/17455030.2014.884733) [Google Scholar]
- 18.Mei J, Wu Y, Chan CT, Zhang Z. 2012. First-principles study of Dirac and Dirac-like cones in phononic and photonic crystals. Phys. Rev. B 86, 035141 (doi:10.1103/PhysRevB.86.035141) [Google Scholar]
- 19.Kittel C. Introduction to solid state physics. New York, NY: John Wiley & Sons. [Google Scholar]
- 20.Luttinger JM, Kohn W. 1955. Motion of electrons and holes in perturbed periodic fields. Phys. Rev. 97, 869–883. (doi:10.1103/PhysRev.97.869) [Google Scholar]
- 21.Mahmoodian S, McPhedran RC, de Sterke CM, Dossou KB, Poulton CG, Botten LC. 2009. Single and coupled degenerate defect modes in two-dimensional photonic crystal band gaps. Phys. Rev. A 79, 013814 (doi:10.1103/10.1103/PhysRevA.79.013814) [Google Scholar]
- 22.Papanicolau F, Bensoussan A, Lions JL. Asymptotic analysis for periodic structures. New York, NY: Elsevier. [Google Scholar]
- 23.Maz'ya VG, Nazarov S, Pamenevskii B. Asymptotic theory elliptic boundary value problems in singularly perturbed domains. New York, NY: Springer. [Google Scholar]
- 24.Graff KF. 1975. Wave motion in elastic solids. New York, NY: Dover Publications. [Google Scholar]
- 25.Movchan AB, Movchan NV, McPhedran RC. 2007. Bloch–Floquet bending waves in perforated thin plates. Proc. R. Soc. A 463, 2505–2518. (doi:10.1098/rspa.2007.1886) [Google Scholar]
- 26.Poulton CG, McPhedran RC, Movchan NV, Movchan AB. 2010. Convergence properties and flat bands in platonic crystal band structures using the multipole formulation. Wave Random Complex 20, 702–716. (doi:10.1080/17455030903203140) [Google Scholar]
- 27.Smith MJA, McPhedran RC, Meylan MH. 2014. Density of states for platonic crystals and clusters. SIAM J. Appl. Math. 74, 1551–1570. (doi:10.1137/130950501) [Google Scholar]
- 28.Norris AN, Vemula C. 1995. Scattering of flexural waves on thin plates. J. Sound Vib. 181,115–125. (doi:10.1006/jsvi.1995.0129) [Google Scholar]
- 29.Sakoda K. 2012. Proof of the universality of mode symmetries in creating photonic Dirac cones. Opt. Express 20, 25 181–25 194. (doi:10.1364/OE.20.025181) [DOI] [PubMed] [Google Scholar]
- 30.Huang X, Lai Y, Hang ZH, Zheng H, Chan CT. 2011. Dirac cones induced by accidental degeneracy in photonic crystals and zero-refractive-index materials. Nat. Mater. 10, 582–586. (doi:10.1038/nmat3030) [DOI] [PubMed] [Google Scholar]
- 31.Movchan AB, Slepyan LI. 2014. Resonant waves in elastic structured media: dynamic homogenisation versus Green's functions. Int. J. Solids Struct. 51, 2254–2260. (doi:10.1016/j.ijsolstr.2014.03.015) [Google Scholar]
- 32.Ayzenberg-Stepanenko MV, Slepyan LI. 2008. Resonant-frequency primitive waveforms and star waves in lattices. J. Sound Vib. 313, 812–821. (doi:10.1016/j.jsv.2007.11.047) [Google Scholar]
- 33.Meylan MH, McPhedran RC. 2011. Fast and slow interaction of elastic waves with platonic clusters. Proc. R. Soc. A 467, 3509–3529. (doi:10.1098/rspa.2011.0234) [Google Scholar]
- 34.Smith MJA, McPhedran RC, Poulton CG, Meylan MH. 2012. Negative refraction and dispersion phenomena in platonic clusters. Wave Random Complex 22, 435–458. (doi:10.1080/17455030.2012.711495) [Google Scholar]
Associated Data
This section collects any data citations, data availability statements, or supplementary materials included in this article.
Data Availability Statement
The work does not use any experimental data. All computational findings presented in the paper are reproducible from the analytical formulae included in the manuscript. Illustrative animations for steering of Dirac cones are accessible via DOI codes included in appendix A.


