

Abstract
Background: Breast milk iodine concentration (BMIC) may be an indicator of iodine status during lactation, but there are few data comparing different analytical methods or timing of sampling. The aims of this study were: (i) to optimize a new inductively coupled plasma mass spectrometry (ICP-MS) method; and (ii) to evaluate the effect of analytical method and timing of within-feed sample collection on BMIC.
Methods: The colorimetric Sandell–Kolthoff method was evaluated with (a) or without (b) alkaline ashing, and ICP-MS was evaluated using a new 129I isotope ratio approach including Tellurium (Te) for mass bias correction (c) or external standard curve (d). From iodine-sufficient lactating women (n = 97), three samples were collected within one breast-feeding session (fore-, mid-, and hind-feed samples) and BMIC was analyzed using (c) and (d).
Results: Iodine recovery from NIST SRM1549a whole milk powder for methods (a)–(d) was 67%, 24%, 105%, and 102%, respectively. Intra- and inter-assay coefficients of variation for ICP-MS comparing (c) and (d) were 1.3% versus 5.6% (p = 0.04) and 1.1% versus 2.4% (p = 0.33). The limit of detection (LOD) was lower for (c) (0.26 μg/kg) than it was for (d) (2.54 μg/kg; p = 0.02). Using (c), the median [95% confidence interval (CI) obtained by bootstrap] BMIC (μg/kg) in foremilk (179 [CI 161–206]) and in mid-feed milk (184 [CI 160–220]) were not significantly different (p = 0.017), but were higher than in hindmilk (175 [CI 153–216]; p < 0.001). In foremilk using (d), BMIC was 199 ([CI 182–257]; p < 0.001 vs. (c)). The variation in BMIC comparing (c) and (d) (13%) was greater than variation within feeding (5%; p < 0.001).
Conclusions: Because of poor recoveries, (a) and (b) should not be used to measure BMIC. Compared with (d), (c) has the advantages of higher precision and a lower LOD. In iodine-sufficient women, BMIC shows low variation within a breast-feeding session, so timing of sampling is not a major determinant of BMIC.
Introduction
Iodine deficiency during infancy may impair growth and development (1–4). Infants have low thyroidal iodine stores and are dependent on iodine in breast milk or infant formula to meet their requirements (2,5). However, there is no scientific consensus on optimal dietary iodine intake during infancy or on optimal breast milk iodine concentration (BMIC) (1,2,6–8). BMIC is influenced by maternal iodine status (1,9–11), recent maternal iodine intake (12), duration of lactation (13–17), and maternal fluid intake (17). Sampling procedures may also be important. One study found differences in BMIC between fore- and hind-milk samples (17) while another did not (18). Broad ranges of BMIC have been reported in iodine-sufficient countries (9–11,19), but comparing BMIC across studies is difficult because of differences in study design, analytical methods, and the lack of external quality control (9,17,20–24).
Breast milk is a complex sample matrix (20,21,25), and inductively coupled plasma mass spectrometry (ICP-MS) is considered the standard method for iodine determination in such matrices, providing high levels of accuracy and precision and low detection limits (20–23,26). However, obtaining accurate measurements using ICP-MS requires optimization of sample preparation and measurement parameters (20–23,26). Isotope dilution analysis (IDA) for ICP-MS uses the determination of isotope intensity ratios for quantification and is a promising approach for improving iodine measurements in breast milk. This is because, compared with conventional standard curve applications, IDA allows for correction for losses, matrix effects, and instrumental drifts (20,21,25–28).
The European Committee for Standardization and the AOAC International have adopted ICP-MS-based methods for the determination of iodine content in foods, infant formula, and nutritional products (22,26,29,30), but no reference analytical method has been recommended for BMIC. Thus, the aim of this study was to evaluate differences in BMIC by analytical method and timing of sample collection within a feeding session. Specifically, (i) two methods for measurement of BMIC were compared: the spectrophotometric Sandell–Kolthoff method and ICP-MS analysis; (ii) an ICP-MS method based on IDA with 129I and Tellurium (Te) for mass bias correction was optimized to quantify BMIC, and then this ICP-MS 129I isotope ratio method was compared with an ICP-MS procedure using external iodine calibrators for quantification; and (iii) breast milk samples were collected from an iodine-sufficient population and BMIC was compared between fore-, mid-feed, and hind-milk samples.
It was hypothesized that:
H1: The spectrophotometric method will not obtain reliable BMIC results.
H2: The new ICP-MS method based on IDA with 129I and Te for mass bias correction will improve precision of BMIC analysis compared with conventional ICP-MS approaches.
H3: Differences in BMIC by sampling time point within a breast-feeding session will be negligible in iodine-sufficient women.
Subjects and Methods
Subjects
Breast milk samples were obtained as part of a cross-sectional study conducted in the Potchefstroom municipal area of the North-West Province, South Africa. Briefly, a convenience sample of lactating women (n = 100) was recruited at local health centers during a routine infant polio vaccination visit. Inclusion criteria were: (i) apparently healthy lactating women; (ii) no history of thyroid disease; (iii) currently breast-feeding a singleton infant; and (iv) not consuming iodine-containing dietary supplements. Trained study assistants explained the study protocol to the women in the local language (Setswana or Afrikaans). Written informed consent was obtained from the participating women. The Health Research Ethics Committee of the Faculty of Health Sciences of the North-West University, South Africa, approved the study protocol (NWU-00016-13-S1). Permission was also granted from the Provincial and District Health Departments, South Africa. South Africa has a long-standing salt iodization program with mandatory table salt iodization at 35–65 ppm (31). The median urinary iodine concentration (UIC) of the participating women was 118 μg/L (interquartile range 67–179 μg/L), indicating adequate iodine intake.
Study design
The subjects provided three consecutive breast milk samples from one feeding session by manual expression, following a sample collection scheme adapted from Neville et al. (32). After cleaning the breast with a wet cloth, mothers expressed a 5 mL milk sample before breast-feeding to obtain a foremilk sample. The baby was then put to the breast to suckle for 2–2.5 min after letdown, judged as the time when the baby began to swallow actively. Another 5 mL of breast milk was then collected to obtain a mid-feed sample. The baby then suckled on the breast until fully satisfied, and a third 5 mL sample (the hindmilk sample) was collected when the feeding was finished. When sample volume allowed, a pooled milk sample was generated from equal parts of the fore-, mid-, and hind-feed samples. All breast milk samples were collected between 8:00 am and 12:00 am. The breast milk samples were frozen within an hour after collection, shipped frozen to the Human Nutrition Laboratory of the ETH Zurich, and stored at −25°C until analysis.
BMIC analysis: Sandell–Kolthoff methods
The milk iodine concentration was analyzed using the colorimetric Sandell–Kolthoff procedure (33) with and without prior alkaline ashing. Alkaline ashing was applied to remove interfering substances using modified procedures from Jones et al. (34) and Aumont and Tressol (35).
Reagents
Analytical grade reagents were used for all analyses: potassium hydroxide pellets (Merck, Darmstadt, Germany), ammonium persulfate (Riedel de Haën; Sigma-Aldrich, St. Louis, MO), sodium hydroxide pellets (Sigma-Aldrich), arsenic trioxide (Fluka; Sigma-Aldrich), sulfuric acid 95–97% (Sigma-Aldrich), sodium chloride (Sigma-Aldrich), ammonium cerium(IV) sulfate dihydrate (Sigma-Aldrich), and potassium iodate (Fluka; Sigma-Aldrich). Water (18 MΩ cm) was generated by an ultrapure water purification system (Barnstead E-Pure; Thermo Scientific, Waltham, MA).
Ashing
For the ashing procedure, 0.5 mL of milk was pipetted into a ceramic crucible, and 0.5 mL of 4 M potassium hydroxide solution was added. The samples were dried in a heat cabinet at 105°C for 20 h. Then, the samples were placed in a muffle furnace and heated at 150°C for 30 min. The temperature was raised to 600°C and maintained for 1 h. After cooling, the ash was dissolved in 1 mL of ultrapure water by putting the ceramic crucibles into an ultrasonic bath for 10 min. The solution was filtered into microtubes using 3 mL syringes and microfilters (Chromafil MV, A-45/25; Macherey-Nagel, Dueren, Germany). The calibration blanks were prepared using ultrapure water.
Sandell–Kolthoff procedure
The iodine content in the untreated milk samples and in the dissolved ash samples was measured using the modification by Pino et al. of the Sandell–Kolthoff reaction with spectrophotometric detection (33). For each sample, 250 μL was pipetted in duplicate into Pyrex tubes. The samples were digested by adding 1 mL of 1 M ammonium persulfate solution to all tubes and by heating them on a heating block for 60 min at 95°C. After cooling, 50 μL of each sample was pipetted onto a flat-bottom 96-well PS microplate (Greiner Bio-One, Kremsmuenster, Austria), and 100 μL of arsenious acid solution (0.05 M) was added. The plate was placed on a microplate shaker for 15 min. Then, 50 μL of ceric ammonium solution (0.019 M) was added to all wells, and the plate was shaken for another 28 min before the absorbance was measured at 405 nm using a microplate reader (PowerWave HT; BioTek, Winooski, VT).
The authors' laboratory routinely uses the described modification by Pino et al. of the Sandell–Kolthoff method for UIC analysis. The laboratory is certified by the Program to Ensure the Quality of Urinary Iodine Procedures (EQUIP; Centers for Disease Control and Prevention, Atlanta, GA), and participates successfully in its quarterly external validation.
Calculations
Iodine calibrators for a concentration range between 0 and 600 μg/L were prepared for each Sandell–Kolthoff run from a 1 g/L iodine stock solution using potassium iodate and ultrapure water. The calibration curve was established by linear regression of the iodine concentrations of the standards versus the logarithm of the absorbance at 405 nm. The iodine concentrations in the milk samples were calculated using the calibration curve obtained for each run and the dilution factors for each milk sample.
ICP-MS methods
The BMIC was analyzed using a two-step procedure. First, iodine was extracted from the breast milk samples using tetramethylammonium hydroxide (TMAH) with a procedure modified from Fecher et al. (22) and Andrey et al. (36). Then, the iodine content in the TMAH extracts was measured using multicollector (MC) ICP-MS. The quantification was done using two different approaches based on: (i) ICP-MS IDA using 129I, and (ii) ICP-MS standard curve analysis using external potassium iodide calibrators in an aqueous 0.25% TMAH solution. Instrumentation, operation, reagents, and sample preparation procedure were identical for both ICP-MS methods under study.
Instrumentation and operation
A Finnigan NEPTUNE high-resolution double focusing MC-ICP-MS (Thermo Scientific) equipped with an ASX-520 Autosampler (Cetac, Omaha, NE), a Perimax pump (Spetec, Erding, Germany) for sample introduction, a Scott Style combined cyclonic-double-pass high-stability quartz Spray Chamber for NEPTUNE (Thermo Scientific), and a MicroFlow PFA-ST self-aspirating or pumped nebulizer, 50 μL/min uptake version (Epond, Vevey, Switzerland), were used for the analysis. The MC-ICP-MS was operated with the conditions listed in Table 1. Signals were measured in volts (V). The low-resolution mode was used in order to obtain higher ICP-MS signals. The instrument was tuned before each run using iodide standards in 0.25% TMAH.
Table 1.
MC-ICP-MS Operating Conditions for the Analysis
| Settings | |
| Operation power | 1.3 kW |
| Auxiliary gas flow rate | 0.4 L/min |
| Cooling gas flow rate | 16.2 L/min |
| Sample gas flow rate | 0.9 L/min |
| Sample uptake | 50 μL/min |
| Vacuum conditions | |
| Plasma interface | 10e-004 mbar |
| Electrostatic analyzer (ESA) | 10e-008 mbar |
| Ion getter press | 10e-009 mbar |
| Data acquisition | |
| Monitored ions (m/z) | 124 (Te), 125 (Te), 126 (Te), 127 (I) |
| 128 (Te), 129 (I), 130 (Te), 131 (Xe) | |
| Mode | Low resolution (m/Δm ≈ 2000) |
| Measurement cycles per sample | 20 |
| Time per measurement cycle | 4 s |
| Take-up time | 105 s |
| Wash time | 10 s |
MC-ICP-MS, multicollector inductively coupled plasma mass spectrometry.
Reagents
Tama pure-AA TMAH 25% (Tama, Kawasaki, Japan) and argon with a purity grade of 99.998% (Carbagas, Guemligen, Switzerland) were used. Water (18 MΩ cm) was generated by an ultrapure water purification system (Barnstead E-Pure; Thermo Scientific).
Sample preparation
To assure homogeneity of the frozen breast milk samples, the samples were defrosted on a Speci-Mix mixer for 1 h. Any coagulates were dissolved by placing the defrosted samples in a 40°C oven for 15–30 min. After cooling, the samples were thoroughly homogenized by using a vortex mixer immediately before pipetting. For the sample preparation procedure, 1.5 mL of each milk sample was pipetted into a graduated disposable 50 mL PP-tube with a screw cap (Sarstedt, Nuembrecht, Germany), and the exact weight was noted. Further, 0.5 mL of 25% TMAH was added to each tube. After mixing, the screw caps of the tubes were closed, and the samples were put in the heat cabinet for 3 h at 90 ± 3°C for iodine extraction. The samples were shaken carefully by hand from time to time during the extraction. After cooling to room temperature, the tubes were filled to 50 mL with ultrapure water, resulting in a TMAH concentration of 0.25%. The tubes were closed, mixed, and left for sedimentation at room temperature overnight. The next day, 10 mL aliquots of the extract were taken from the middle of the tubes, and they were filled into graduated disposable 15 mL PP-tubes with screw caps (Semadeni, Ostermundigen, Switzerland). Sediments from the bottom or parts of the fat fraction floating on the top of the extract were avoided. The calibration blanks were prepared using ultrapure water.
ICP-MS 129I isotope ratio method
Standards
The NIST SRM 4949C 129I radioactivity standard (Standard Reference Material 4949C; National Institute of Standards and Technology, Gaithersburg, MD) was used for IDA. The specific activity of the solution was certified at 3451 Bq/g (RSD 0.6%), which is equal to a concentration of 528 μg/g 129I. A 129I stock solution was prepared with a concentration of 174 μg/g 129I, corresponding to a specific activity of 1136 Bq/g, by diluting the NIST SRM 4949C 129I radioactivity standard in a 0.01 M NaOH solution. The stock solution was used to prepare a 129I spike solution in a 0.01% TMAH solution with a concentration of 1.3 μg/g 129I, corresponding to a specific activity of 9 Bq/g. Then, 50 μL of the 129I spike solution was added to each 10 mL extracted sample. The concentration of 127I in NIST SRM 4949C 129I radioactivity standard was not certified by the producer. By doing standard additions of 127I, an isotopic fraction of 14% 127I and 86% 129I was obtained, corresponding to a 127I/129I ratio Riso true of 0.16, in agreement with Platzner (37). For each ICP-MS run, 50 μL 129I spike solution was added to 10 mL 0.25% TMAH solution and the 127I/129I intensity ratio Riso was measured at the beginning, middle, and end of each run, and was used for the IDA calculations.
Te was used for mass bias correction, and the spike solution (10 mg/L) was prepared from a 1000 mg/L standard solution for ICP (AppliChem, Darmstadt, Germany). Te isotope ratios in the standard solution were not specified by the producer and were assumed to be equivalent to the relative abundances of naturally occurring isotopes (38). A total of 50 μL of the 10 mg/L Te spike solution was added to each 10 mL sample.
Calculations
The 127I/129I intensity ratio Rmeas was measured for all samples. Solvent blanks (0.25% TMAH) were analyzed before and after each sample, and were used for respective blank correction of the acquired sample ICP-MS intensities. Microsoft Excel 2010 (Microsoft, Redmond, WA) was used for all calculations. Rmeas results from the 127I in the milk samples and the 129I and 127I added with the 129I spike solution. It can be described as:
 |
with nn representing the number of moles of 127I in the milk samples and ns representing the number of moles of 129I respectively 127I added with the spike solution. The isotopic abundance in the spike solution is described by hs. By substituting the number of moles for the respective m/M terms and rearranging equation 1, the unknown mass of 127I in the milk samples can be calculated as:
 |
with m129I representing the mass of added 129I, M representing the molar masses of 127I respectively 129I, and Riso representing the 127I/129I intensity ratio measured for the 50 μL 129I spike solution that was added to 10 mL 0.25% TMAH solution.
The Russell's law model was applied for mass bias correction. A calibrator with known isotope ratio (Te) is measured. From the difference between the known isotope ratios and the measured isotope ratios, a correction factor f(t) is calculated, and this correction factor f(t) is then applied to correct the measured isotope ratios of the measurand (iodine). For the present instrumental settings, Russell's law was found to be suitable to correct for mass bias of the 126Te/128Te intensity ratio, and it was used further to correct the measured 127I/129I intensity ratios (39). Using MC-ICP-MS, the 126Te/128Te intensity ratio was measured simultaneously to the 127I/129I ratio. It was thus not susceptible to variation in the magnitude of bias. The mass bias correction factors f were calculated as:
 |
with mTe representing the mass of 126Te respectively of 128Te added with the Te spike solution, RTe meas being the experimentally measured 126Te/128Te intensity ratio, and RTe true being the true 126Te/128Te intensity ratio obtained from the relative abundances of naturally occurring isotopes (38). Then, the correction factors were applied to calculate the mass bias corrected 127I/129I intensity ratios Rcorr from the measured 127I/129I intensity ratios Rmeas:
 |
Then, the mass bias corrected 127I/129I intensity ratios Rcorr were applied to calculate the unknown mass of 127I in the milk samples corresponding to:
 |
The iodine concentration in the milk samples was calculated using the dilution factors applied to each sample.
ICP-MS standard curve method
Standards
A 1000 μg/g iodide stock solution was prepared from analytical grade potassium iodide (Riedel de Haën; Sigma-Aldrich). A 1 μg/g iodine spike solution was prepared from the stock solution, and it was used to prepare iodine standards of 0, 5, 10, 20, and 40 ng/g in 0.25% TMAH solutions. Te was used for continuous monitoring of the ICP-MS signal, and it was prepared from a 1000 mg/L standard solution for ICP (AppliChem). Then, 50 μL of the 10 mg/L Te spike solution was added to each 10 mL iodine standard. All standards were prepared gravimetrically, and the concentrations were verified using ICP-MS IDA. To account for possible variations and drifts during an ICP-MS run consisting of 40 milk samples, the set of iodine standards were measured at the beginning, middle, and end of each run. The same standard solutions were used for all ICP-MS measurements reported.
Calculations
The calibration curve was established by linear regression of the iodine concentrations of the three measurements of the set of iodine standards for each ICP-MS run versus the measured intensity at m/z 127. The standard curve was linear and the correlation coefficient was consistently >0.978. If required, the samples were diluted so that the measured BMIC fell within the calibration range of the calibration curve. Solvent blanks (0.25% TMAH) were analyzed before and after each sample and were used for respective blank correction of the acquired sample ICP-MS intensities. Microsoft Excel 2010 was used for all calculations. The BMIC in the samples were calculated using the calibration curve obtained for each ICP-MS run and the dilution factors obtained for each milk sample.
Validation of analytical methods for BMIC analysis
Accuracy and precision of the four methods described above were determined by analyzing the iodine content in NIST SRM1549a whole milk powder (Standard Reference Material 1549a; National Institute of Standards and Technology). The reference milk powder was dissolved in ultrapure water according to instructions, and the iodine content was analyzed using (i) the Sandell–Kolthoff method after alkaline ashing, (ii) the Sandell–Kolthoff method without alkline ashing, (iii) the ICP-MS 129I isotope ratio method, and (iv) the ICP-MS standard curve method. The intra-assay variability was determined by analyzing the NIST SRM1549a sample four times or more in a single assay. The inter-assay variability was determined by analyzing the reference sample two times or more in at least two separate assays on two different days. The NIST SRM1549a reference material was used as quality control sample and analyzed with each run for all methods and all samples.
The limit of detection (LOD) of the four methods was calculated as the mean concentration ±3 standard deviations (SD) of the iodine concentration of a calibration blank measured at least seven times in different assays.
Statistical analysis
Microsoft Excel 2010 and IBM SPSS Statistics for Windows v22 (IBM Corp., Armonk, NY) were used for data processing and analysis. Normally distributed data were expressed as mean±SD; non-normally distributed data were expressed as median±confidence interval (CI) obtained by 1000 bootstrapped samples. Differences between the ICP-MS isotope ratio and the ICP-MS standard curve method were tested using Wilcoxon signed-rank test, and the correlation was tested using linear regression. Differences between the three sampling time points were tested using Friedman's analysis of variance (ANOVA) followed by Wilcoxon signed-rank tests with Bonferroni correction of the significance level. A p-value of <0.05 was considered significant.
Results
Fore-, mid-, and hind-feed milk samples were obtained from 97, 95, and 94 women, respectively, and the samples were analyzed using the ICP-MS isotope ratio and the ICP-MS standard curve method. A pooled breast milk sample was generated from 66 women.
Evaluation of analytical methods for BMIC analysis: Sandell–Kolthoff methods
The mean±SD iodine content obtained in the NIST SRM1549a reference sample was 2236 ± 313 μg/kg (n = 12) with prior alkaline ashing, and 790 ± 253 μg/kg (n = 11) without prior ashing, both below the certified acceptable range (3040–3640 μg/kg), equaling to recoveries of 67% and 24%, respectively (Table 2). The intra-assay coefficient of variation (CV) for the iodine content of the NIST SRM1549a whole milk sample was 3.6% (n = 4) with and 8.5% (n = 4) without prior ashing. The inter-assay variability was 9.3% (n = 4) with and 28.7% (n = 4) without prior ashing. The LOD for the method was 10.22 μg/kg (n = 7) with and 10.18 μg/kg (n = 10) without prior ashing. Because of incomplete recovery using the Sandell–Kolthoff method, with or without prior alkaline ashing, this method was not used in further experiments.
Table 2.
Precision, Accuracy, and LOD of the Sandell–Kolthoff Method with Prior Alkaline Ashing, the Sandell–Kolthoff Method Without Ashing, the ICP-MS 129I Isotope Ratio Method, and the ICP-MS Standard Curve Method
| Sandell–Kolthoff | ICP-MS | |||
|---|---|---|---|---|
| With ashing | Without ashing | 129I isotope ratio | Standard curve | |
| Iodine content of NIST SRM1549a whole milk samplea | ||||
| Mean±SD (μg/kg) | 2236 ± 313 | 790 ± 253 | 3502 ± 89 | 3396 ± 370 |
| Range (μg/kg) | 1934–3061 | 413–1150 | 3321–3655 | 2617–4377 |
| Total assay variability (%) | 14.0 | 32.1 | 2.6 | 10.9 |
| Inter-assay variability (%) | 9.3 | 28.7 | 1.1 | 2.4 |
| Intra-assay variability (%) | 3.6 | 8.5 | 1.3 | 5.6 |
| LOD | ||||
| LOD (μg/kg) | 10.22 | 10.18 | 0.26 | 2.54 |
Precision and accuracy of the methods was determined by analyzing NIST SRM1549a whole milk powder sample. The LOD was determined by analyzing calibration blanks.
Certified iodine content 3340 μg/kg (range 3040–3640).
LOD, limit of detection; SD, standard deviation.
Evaluation of analytical methods for BMIC analysis: ICP-MS methods
The mean±SD iodine content for the NIST SRM1549a reference sample was 3502 ± 89 μg/kg (n = 16) for the 129I isotope ratio method and 3396 ± 370 μg/kg (n = 16) for the standard curve method, both well within the certified acceptable range (3040–3640 μg/kg) and equaling to recoveries of 105% and 102%, respectively (Table 2).
The 129I isotope ratio method quantified the iodine content with higher precision than the standard curve method; the intra-assay variability (n = 14) was 1.3% for the 129I isotope ratio method and 5.6% for the standard curve method (p = 0.04). The inter-assay variability (n = 16) was comparable for the two methods: 1.1% for the 129I isotope ratio method and 2.6% for the standard curve method (p = 0.33). The LOD (n = 10) was lower for the 129I isotope ratio method (0.26 μg/kg) than it was for the standard curve method (2.54 μg/kg; p = 0.02).
Influence of choice of analytical method and of within-feed sampling time on BMIC
The BMIC measured by the two different ICP-MS methods in the fore-, mid-, and hind-feed milk samples are shown in Figure 1. The median BMIC obtained by the ICP-MS 129I isotope ratio method was 179 μg/kg [CI 161–206] in the foremilk, 184 μg/kg [CI 160–220] in the mid-feed milk, and 175 μg/kg [CI 153–216] in the hindmilk (p < 0.001). The measured iodine content in the hindmilk was lower than that in the foremilk (p < 0.001) and in mid-feed milk (p < 0.001). The iodine content in the foremilk did not differ significantly from the mid-feed milk (p = 0.017). The pooled milk samples (n = 66) yielded a median BMIC of 183 μg/kg [CI 158–257], higher than the iodine content in the hindmilk (p < 0.001) and in the foremilk (p < 0.01), but not different from the mid-feed samples (p = 0.297). In a sub-analysis, the three sampling time points for BMIC concentrations <150 μg/kg (n = 28) were compared. The significant difference between the hind- and the fore- (p < 0.001) and the hind- and the mid-feed samples (p < 0.001) remained. The median BMIC obtained by the ICP-MS standard curve method in the fore-, mid-, and hind-milk samples were 199 μg/kg [CI 182–257], 236 μg/kg [CI 206–264], and 225 μg/kg [CI 192–273], respectively (p = 0.47). The pooled milk samples (n = 25) yielded a median BMIC of 245 μg/kg [CI 189–364].
FIG. 1.
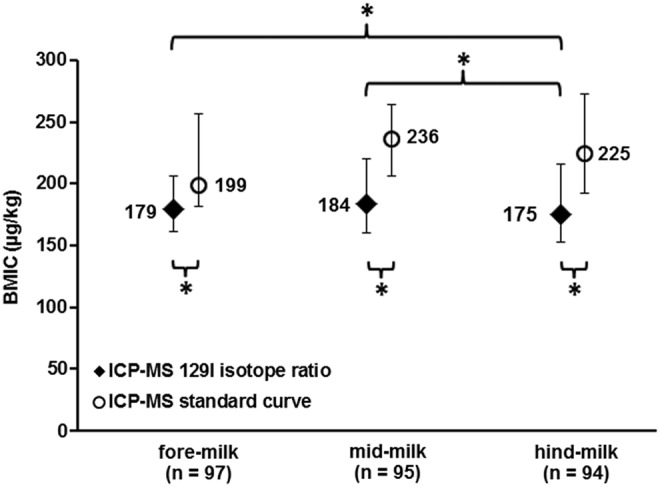
Breast milk iodine concentration (BMIC, μg/kg) of fore-, mid-, and hind-milk samples obtained by the inductively coupled plasma mass spectrometry (ICP-MS) 129I isotope ratio method and the ICP-MS standard curve method. Data are medians, and error bars are 95% confidence intervals obtained by 1000 bootstrapped samples. *Significant at p < 0.05.
The 129I isotope ratio method and the standard curve method strongly correlated (R2 = 0.855, p < 0.001; β = 18.3 μg/kg, p = 0.009), but the median BMIC measured by the ICP-MS standard curve method in the fore-, mid-, and hind-milk samples, and in the pooled samples, were significantly higher than the median BMIC obtained by the ICP-MS 129I isotope ratio method (p < 0.001) for all time points and pooled samples.
The mean relative standard deviation (RSD) for BMIC (n = 286) between the ICP-MS 129I isotope ratio method and the ICP-MS standard curve method was 13% (Fig. 2A). The mean RSD for BMIC between the three within-feed sampling time points (n = 94) was 5% (Fig. 2B). The variation in BMIC for the two different ICP-MS methods was significantly higher than the variation in BMIC between the three different within-feed sampling time points (p < 0.001).
FIG. 2.

The relative standard deviation (RSD, %) for BMIC. (A) RSD between the ICP-MS 129I isotope ratio method and the ICP-MS standard curve method (n = 286). (B) RSD between the three different within-feed sampling time points (n = 94) using the ICP-MS 129I isotope ratio method. The dashed line shows the mean RSD of the BMIC obtained by the two methods and for the three sampling time points.
Discussion
The Sandell–Kolthoff method is a standard method for measurement of UIC and is used for this analysis in more than 100 laboratories worldwide (40). It has also been applied and reported for iodine analysis of breast milk samples (12,17,41). However, with the Sandell-Kolthoff method, we were unable to retrieve iodine concentrations within the acceptable range for the whole milk reference sample; the iodine recovered, with and without prior alkaline ashing, was only 67% and 24% of the certified iodine content. Possible reasons may be losses during the ashing procedure, incomplete dissolution of the ash, inadequate mineralization, and interferences with the catalytic effect of iodide on the Sandell–Kolthoff reaction (23,42). Because volatile iodine species may be formed at low pH, alkaline ashing to prevent losses and an ultrasonic bath to allow complete dissolution of the ash were used, but without success. The sensitivity and repeatability of the analysis were also low. Taken together, these data do not support the use of the Sandell–Kolthoff method, with or without prior alkaline ashing, for BMIC analysis. Studies reporting BMIC using the Sandell-Kolthoff method without reporting information on external quality control should be interpreted cautiously.
ICP-MS is the gold standard for determination of low-iodine concentrations in complex matrices (21,22,26,29,30) and the preferred method for BMIC. The data demonstrate the importance of the choice of ICP-MS quantification procedure for BMIC. Although both ICP-MS methods measured satisfactory iodine concentrations in the NIST reference sample, the BMIC differed by 13% between the two methods. The ICP-MS standard curve method measured on average 18 μg/kg higher BMIC than the ICP-MS 129I isotope ratio method. While the standard curve method quantification was done using external iodine calibrators in aqueous TMAH solution, the 129I isotope ratio method is based on IDA, which allowed for correction of analyte losses, matrix effects, and instrumental drifts (27). The simultaneous isotope measurement provided by MC-ICP-MS further allowed for continuous and simultaneous corrections of the acquired ratios. Due to processes in the ICP-MS instrument that favor the transmission of heavier isotopes, measured isotope ratios can defer from the true values by up to 25% (37). To achieve accurate isotope ratios, it is therefore essential to correct the ratios acquired with ICP-MS for this instrumental mass discrimination (37). In the present 129I isotope ratio method, Te and Russell's law model was used for continuous and simultaneous mass bias correction (39). The 129I isotope ratio method showed a higher precision and a lower LOD compared with the standard curve method.
In this study, samples were extracted at elevated temperatures using TMAH, a procedure previously validated for several foods including milk and infant formula (22,25,29). Other ICP-MS methods proposed for BMIC determination include digestion with ammonia (25) and quantification procedures using different internal standards, such as rhodium (Rh) (25), antimony (Sb) (21), or Te (21). The authors prefer to use TMAH for sample preparation, as it has been validated and documented to perform complete iodine extractions from breast milk (21). The high recovery rates of iodine in the NIST SRM1549a reference sample (105% for the 129I isotope ratio method and 102% for the standard curve method) confirm complete iodine extraction using TMAH. Further digestion procedures such as ashing or filtration are likely superfluous and would rather increase the risk for iodine losses. Huynh et al. (21) recently proposed a method for BMIC determination using external iodine calibrators in aqueous TMAH solution for quantification and Sb as internal standard, and report a precision and accuracy similar to the present 129I isotope ratio method. However, the current findings show that when using the same instrumental setup, quantification using IDA with 129I and Te for mass bias correction provides more precise results than an external standard curve approach. Dyke et al. (28) tested several internal standards for milk iodine determination by ICP-MS and found that the iodine isotope 129I is the preferred standard. The half-life of 129I is 15.7 million years, and the radiation hazard during analysis is negligible (27,28,43). In many countries, including Switzerland, use of 129I for ICP-MS IDA does not require radiological controls.
The present data show only small differences in BMIC between the within-feed sampling time points. Although the iodine content was statistically lower in the hindfeed samples compared with the fore- and mid-feed milk samples, the differences could only be detected by the more precise ICP-MS 129I isotope ratio method. The lower BMIC in the hind-milk samples may be explained by the physiological change in breast milk composition during feeding: as the fat content of breast milk increases toward the end of the feed, the iodine-containing water phase may decrease (32). However, these small differences are unlikely to be physiologically relevant. The present findings are consistent with a small study in 13 borderline iodine deficient lactating women (BMIC 83 μg/L and median urinary iodine concentration 72 μg/L) that found a small (4 μg/L) but statistically significant difference between the iodine content of fore- and hind-milk samples (17). Another study of three lactating women did not observe a difference in BMIC between fore- and hind-milk; the average BMIC of participating women was 142 μg/kg (18). Neither of the two studies measured BMIC using ICP-MS. The present results suggest that BMIC from studies using the same analytical method and using breast milk from fore-, mid-, or pooled milk samples can be compared. However, data are limited, and because maternal iodine status and the prevailing BMIC concentration may play a role, the findings need confirmation in other populations with varying iodine status. The results also indicate that the ICP-MS 129I isotope ratio method with Te for mass bias correction may be preferable to detect small differences in BMIC, which may not be discriminated by conventional ICP-MS methods that do not offer simultaneous and continuous correction of ICP-MS signals.
For iodine status monitoring in population-based studies, the World Health Organization recommends reference methods along with reference ranges for the determination of iodine in urine and salt (44), but not for BMIC. BMIC is a promising indicator for monitoring iodine nutrition in lactating women and breastfed infants. However, to establish reference ranges for BMIC, standardized procedures for sample collection and timing of collection, as well as the optimal analytical method, need to be defined. If future studies in populations with varying iodine status confirm the findings that the BMIC of foremilk samples does not differ significantly from mid-feed samples or pooled samples, collection of foremilk samples may be preferable in population-based studies; foremilk samples are easy to collect and do not interfere with the mother–infant interaction. The present findings also suggest that for BMIC analysis, the method described in this paper, based on extraction with TMAH followed by ICP-MS IDA using 129I and Te for mass bias correction, may have advantages over other available methods.
Acknowledgments
We thank all the mothers who participated in the study. We are grateful to Chrissie Ledding, Olivia van der Reijden, and all nurses and fieldworkers who assisted with the breast milk sample collection. We thank Ani Meltonyan for assistance with laboratory analysis. The study was funded by the ETH Zurich, Zurich, Switzerland.
Author Disclosure Statement
No competing financial interests exist.
References
- 1.Zimmermann MB. 2009. Iodine deficiency. Endocr Rev 30:376–408 [DOI] [PubMed] [Google Scholar]
- 2.Zimmermann MB, Jooste PL, Pandav CS. 2008. Iodine-deficiency disorders. Lancet 372:1251–1262 [DOI] [PubMed] [Google Scholar]
- 3.Zimmermann MB. 2012. The effects of iodine deficiency in pregnancy and infancy. Paediatr Perinat Epidemiol 26:108–117 [DOI] [PubMed] [Google Scholar]
- 4.Bougma K, Aboud FE, Harding KB, Marquis GS. 2013. Iodine and mental development of children 5 years old and under: a systematic review and meta-analysis. Nutrients 5:1384–1416 [DOI] [PMC free article] [PubMed] [Google Scholar]
- 5.Brown RS. Disorders of the thyroid gland in infancy, childhood and adolescence. Available at: www.thyroidmanager.org (accessed April20, 2015)
- 6.Swanson CA, Pearce EN. 2013. Iodine insufficiency: a global health problem? Adv Nutr 4:533–535 [DOI] [PMC free article] [PubMed] [Google Scholar]
- 7.Trumbo PR. 2013. Evidence needed to inform the next dietary reference intakes for iodine. Adv Nutr 4:718–722 [DOI] [PMC free article] [PubMed] [Google Scholar]
- 8.Swanson CA, Zimmermann MB, Skeaff S, Pearce EN, Dwyer JT, Trumbo PR, Zehaluk C, Andrews KW, Carriquiry A, Caldwell KL, Egan SK, Long SE, Bailey RL, Sullivan KM, Holden JM, Betz JM, Phinney KW, Brooks SP, Johnson CL, Haggans CJ. 2012. Summary of an NIH workshop to identify research needs to improve the monitoring of iodine status in the United States and to inform the DRI. J Nutr 142:1175S–1185S [DOI] [PMC free article] [PubMed] [Google Scholar]
- 9.Semba RD, Delange F. 2001. Iodine in human milk: perspectives for infant health. Nutr Rev 59:269–278 [DOI] [PubMed] [Google Scholar]
- 10.Azizi F, Smyth P. 2009. Breastfeeding and maternal and infant iodine nutrition. Clin Endocrinol 70:803–809 [DOI] [PubMed] [Google Scholar]
- 11.Dorea JG. 2002. Iodine nutrition and breast feeding. J Trace Elem Med Biol 16:207–220 [DOI] [PubMed] [Google Scholar]
- 12.Leung AM, Braverman LE, He XM, Heeren T, Pearce EN. 2012. Breastmilk iodine concentrations following acute dietary iodine intake. Thyroid 22:1176–1180 [DOI] [PMC free article] [PubMed] [Google Scholar]
- 13.Mulrine HM, Skeaff SA, Ferguson EL, Gray AR, Valeix P. 2010. Breast-milk iodine concentration declines over the first 6 mo postpartum in iodine-deficient women. Am J Clin Nutr 92:849–856 [DOI] [PubMed] [Google Scholar]
- 14.Ares S, Quero J, Duran S, Presas MJ, Herruzo R, Morreale de Escobar G. 1994. Iodine content of infant formulas and iodine intake of premature babies: high risk of iodine deficiency. Arch Dis Child Fetal Neonatal Ed 71:F184–191 [DOI] [PMC free article] [PubMed] [Google Scholar]
- 15.Johnson LA, Ford HC, Doran J, Richardson VF. 1990. A Survey of the iodide concentration of human-milk. New Zeal Med J 103:393–394 [PubMed] [Google Scholar]
- 16.Younes B, Almeshari A, Alhakeem A, Alzamil F, Alsaleh S, Alattas O. 1994. Iodine level in breast-milk of nursing mothers living in Riyadh City. Med Sci Res 22:675–676 [Google Scholar]
- 17.Andersen SL, Moller M, Laurberg P. 2014. Iodine concentrations in milk and in urine during breastfeeding are differently affected by maternal fluid intake. Thyroid 24:764–772 [DOI] [PubMed] [Google Scholar]
- 18.Bruhn JC, Franke AA. 1983. Iodine in human milk. J Dairy Sci 66:1396–1398 [DOI] [PubMed] [Google Scholar]
- 19.Andersson M, Aeberli I, Wust N, Piacenza AM, Bucher T, Henschen I, Haldimann M, Zimmermann MB. 2010. The Swiss iodized salt program provides adequate iodine for school children and pregnant women, but weaning infants not receiving iodine-containing complementary foods as well as their mothers are iodine deficient. J Clin Endocrinol Metab 95:5217–5224 [DOI] [PubMed] [Google Scholar]
- 20.Haldimann M, Eastgate A, Zimmerli B. 2000. Improved measurement of iodine in food samples using inductively coupled plasma isotope dilution mass spectrometry. Analyst 125:1977–1982 [DOI] [PubMed] [Google Scholar]
- 21.Huynh D, Zhou SJ, Gibson R, Palmer L, Muhlhausler B. 2015. Validation of an optimized method for the determination of iodine in human breast milk by inductively coupled plasma mass spectrometry (ICPMS) after tetramethylammonium hydroxide extraction. J Trace Elem Med Biol 29:75–82 [DOI] [PubMed] [Google Scholar]
- 22.Fecher PA, Goldmann I, Nagengast A. 1998. Determination of iodine in food samples by inductively coupled plasma mass spectrometry after alkaline extraction. J Anal At Spectrom 13:977–982 [Google Scholar]
- 23.Shelor CP, Dasgupta PK. 2011. Review of analytical methods for the quantification of iodine in complex matrices. Anal Chim Acta 702:16–36 [DOI] [PubMed] [Google Scholar]
- 24.Pearce EN, Leung AM, Blount BC, Bazrafshan HR, He X, Pino S, Valentin-Blasini L, Braverman LE. 2007. Breast milk iodine and perchlorate concentrations in lactating Boston-area women. J Clin Endocrinol Metab 92:1673–1677 [DOI] [PubMed] [Google Scholar]
- 25.Fernandez-Sanchez LM, Bermejo-Barrera P, Fraga-Bermudez JM, Szpunar J, Lobinski R. 2007. Determination of iodine in human milk and infant formulas. J Trace Elem Med Biol 21:10–13 [DOI] [PubMed] [Google Scholar]
- 26.Pacquette LH, Levenson AM, Thompson JJ. 2012. Determination of total iodine in infant formula and nutritional products by inductively coupled plasma/mass spectrometry: single-laboratory validation. J AOAC Int 95:169–176 [DOI] [PubMed] [Google Scholar]
- 27.Haldimann M, Zimmerli B, Als C, Gerber H. 1998. Direct determination of urinary iodine by inductively coupled plasma mass spectrometry using isotope dilution with iodine-129. Clin Chem 44:817–824 [PubMed] [Google Scholar]
- 28.Dyke JV, Dasgupta PK, Kirk AB. 2009. Trace iodine quantitation in biological samples by mass spectrometric methods: the optimum internal standard. Talanta 79:235–242 [DOI] [PubMed] [Google Scholar]
- 29.European Committee for Standardization 2007 Foodstuffs—determination of trace elements—determination of iodine by ICP-MS (inductively coupled plasma mass spectrometry), Brussels
- 30.Pacquette LH, Levenson AM, Thompson JJ, Dowell D. 2013. Total iodine in infant formula and nutritional products by inductively coupled plasma/mass spectrometry: First Action 2012.14. J AOAC Int 96:798–801 [DOI] [PubMed] [Google Scholar]
- 31.Jooste PL, Zimmermann MB. 2008. Progress towards eliminating iodine deficiency in South Africa. S Afr J Clin Nutr 21:8–14 [Google Scholar]
- 32.Neville MC, Keller RP, Seacat J, Casey CE, Allen JC, Archer P. 1984. Studies on human lactation. I. Within-feed and between-breast variation in selected components of human milk. Am J Clin Nutr 40:635–646 [DOI] [PubMed] [Google Scholar]
- 33.Pino S, Fang SL, Braverman LE. 1996. Ammonium persulfate: a safe alternative oxidizing reagent for measuring urinary iodine. Clin Chem 42:239–243 [PubMed] [Google Scholar]
- 34.Jones GB, Belling GB, Buckley RA. 1979. Recovery of iodine as I-125 from biological-materials prior to assay. Analyst 104:469–471 [Google Scholar]
- 35.Aumont G, Tressol JC. 1986. Improved routine method for the determination of total iodine in urine and milk. Analyst 111:841–843 [DOI] [PubMed] [Google Scholar]
- 36.Andrey D, Zbinden P, Wah MK, Lee W. 2001. A routine quality control method for the determination of iodine in human and pet food by ICP-MS. At Spectrosc 22:299–305 [Google Scholar]
- 37.Platzner IT. 1997. Modern Isotope Ratio Mass Spectrometry. Wiley, Chichester, England [Google Scholar]
- 38.Henderson W, McIndoe JS. 2005. Mass Spectrometry of Inorganic and Organometallic Compounds: Tools, Techniques, Tips. Wiley, Chichester, England [Google Scholar]
- 39.Meija J, Yang L, Mester Z, Sturgeon RE. 2012. Correction of instrumental mass discrimination for isotope ratio determination with multi-collector inductively coupled plasma mass spectrometry. In: Vanhaecke F, Degryse P. (eds) Isotopic Analysis: Fundamentals and Applications Using ICP-MS. Vol 1 Wiley, Weinheim, Germany, pp 113–137 [Google Scholar]
- 40.Caldwell KL, Makhmudov A, Jones RL, Hollowell JG. 2005. EQUIP: a worldwide program to ensure the quality of urinary iodine procedures. Accred Qual Assur 10:356–361 [Google Scholar]
- 41.Laurberg P, Nohr SB, Pedersen KM, Fuglsang E. 2004. Iodine nutrition in breast-fed infants is impaired by maternal smoking. J Clin Endocrinol Metab 89:181–187 [DOI] [PubMed] [Google Scholar]
- 42.May W, Wu D, Eastman C, Bourdoux P, Maberly G. 1990. Evaluation of automated urinary iodine methods: problems of interfering substances identified. Clin Chem 36:865–869 [PubMed] [Google Scholar]
- 43.Santamaria-Fernandez R, Evans P, Wolff-Briche CSJ, Hearn R. 2006. A high accuracy primary ratio method for the determination of iodine in complex matrices by double isotope dilution using MC-ICPMS and I-129 spike. J Anal At Spectrom 21:413–421 [Google Scholar]
- 44.World Health Organization, United Nations Children's Fund, International Council for the Control of Iodine Deficiency Disorders 2007 Assessment of Iodine Deficiency Disorders and Monitoring Their Elimination. Third edition. World Health Organization, Geneva, Switzerland [Google Scholar]