

Abstract
Objective
As a T cell-mediated disease of the colonic epithelium, ulcerative colitis (UC) is likely to share pathogenic elements with other T cell-mediated inflammatory diseases. Recently microarray analysis revealed large scale molecular changes in T cell-mediated rejection (TCMR) of kidney and heart transplants. We hypothesized that similar disturbances might be operating in UC and could provide insights into responsiveness to therapy.
Methods
We studied 56 colon biopsies from patients with colitis characterizing the clinical and histological features and using microarrays to defined the mRNA phenotype. We expressed the microarray results using previously defined pathogenesis-based transcript sets (PBTs). We also studied 48 published microarray files from human colon biopsies downloaded from the Gene Expression Omnibus (GEO) database, classified by response to infliximab therapy, to examine if the molecular measurements derived from our studies correlated with non-responsiveness to treatment.
Results
UC biopsies manifested coordinate transcript changes resembling rejecting transplants, with effector T cell, IFNG-induced, macrophage, and injury transcripts increasing while parenchymal transcripts decreased. The disturbance in gene expression, summarized as principal component 1 (PC1), correlated with conventional clinical and histologic assessments. When assessed in microarray results from published studies, the disturbance (PC1) predicted response to infliximab: patients with intense disturbance did not achieve clinical response, although quantitative improvement was seen even in many clinical non-responders. Similar changes were seen in Crohn's colitis.
Conclusions
The molecular phenotype of UC manifests a large scale coordinate disturbance reflecting changes in inflammatory cells and parenchymal elements that correlates with conventional features and predicts response to infliximab.
Keywords: T cell-mediated rejection, ulcerative colitis, microarrays, infliximab, dedifferentiation
Introduction
As a chronic T cell-mediated inflammatory disease of the colonic epithelium, ulcerative colitis (UC) represents a continuing challenge to mechanistic understanding and clinical management. The treatment of UC, once dominated by steroids, mesalamine and immune modulators, has evolved with the introduction of biologic agents. Anti-tumor necrosis factor (α-TNF) therapies such as infliximab have proven to be effective for induction and maintenance of remission in moderate to severe UC1-3. Despite their success, these biological agents are expensive, often ineffective and associated with adverse events4,5. Prediction of resistance to infliximab and other biological drugs would improve management and potentially outcomes6,7, as would an earlier delineation of true non-response from partial primary response. Molecular assessment of the disease state in the mucosa offers potential in this regard, as illustrated by the work of Arijs et al using microarrays to elucidate which genes are associated with response to infliximab in both Crohn's disease(CD) and UC8-10.
While the molecular studies of UC have usually taken the form of studies of specific molecules in relationship to paradigms such as TH1/TH211-13 and TH1714, a new approach is to define the large scale organization using methods that reveal the internal structure and interrelationships of the molecular changes. Inflammatory diseases have unique disease specific features but also share many elements that reflect the stereotyped responses to injury in the tissue. Notwithstanding the importance of discovering the disease-specific mechanisms, insights in UC may be derived from studying the elements that are shared with other T cell-mediated human diseases, particularly T cell-mediated rejection(TCMR) of organ transplants. The molecular phenotype of human TCMR in kidney and heart transplants has been deconstructed as a large scale coordinate biologic disturbance in the expression of thousands of genes15,16. The trigger is the cognate interaction of effector T cells with antigen-presenting cells, leading to a massive recruitment and activation of infiltrating cells such as effector T cells, macrophages, and dendritic cells, IFNG-induced transcripts, microcirculation changes, and the injury-repair responses of the parenchyma. Injury-repair is represented by of increased transcripts and loss of the transcripts associated with the normal differentiated epithelium. This large-scale molecular disturbance, like the classic signs of “inflammation” and wound repair, is not disease- or organ-specific, instead reflecting a general structured response within which specific features of diseases and organ-specific elements can be mapped. It is similar in heart and kidney transplants with rejection but can also be seen in organ injury and recurrent disease15,16. In this coordinate process, the increase in burden of inflammation, the increase in parenchymal injury-repair genes, and the loss of transcripts associated with parenchymal metabolism and function such as expression of solute carriers (SLC)15,17,18 are strongly correlated.
The present study examined how the extent of these general disturbances described in other organ diseases could offer a useful new dimension for assessing UC. The hypothesis was, that the general disturbance in UC would correlate with clinical and histological state and provide an accurate predictor of response to therapy. We summarized the microarray changes as scores for gene sets which had been worked out in experimental systems to measure biological changes that might be shared between TCMR and UC – pathogenesis-based transcript sets (PBTs) (http://www.atagc.med.ualberta.ca). These had been derived largely in mouse systems and in culture, and verified and refined in human organ transplant biopsies. We assembled a cohort of biopsies from consented patients; characterized their conventional phenotype - clinical findings, laboratory medicine, and histology; compared these features with the molecular changes in UC biopsies using the predefined PBT measurements of biological changes; and determined the potential of such quantitative measurements for predicting and measuring response to therapy. In particular, we studied whether this approach would provide insights into response to treatment in the dataset developed by Arijs et al. Given that the changes should be conserved between diseases, we also examined whether the findings in UC would be conserved in Crohn's disease of the colon (CDc).
Methods
Data Collection
The patient cohort was derived from populations at the Center of Excellence for Gastrointestinal Inflammation and Immunity Research (CEGIIR), University of Alberta Hospital, Edmonton, Canada, and the F. Widjaja Foundation, Inflammatory Bowel & Immunobiology Research Institute, Cedars-Sinai Medical Center (CSMC), Los Angeles, CA. Thirty-four patients were selected from the CEGIIR biobank and 25 from the F. Widjaja Inflammatory Bowel Disease Center, all collected under approved IRB protocol #3358 and full consent was obtained from all patients at the time of enrollement. All UC patients have a verified diagnosis based on accepted criteria. The following data was collected: demographics (sex, age at biopsy, age at disease diagnosis, disease duration at time of biopsy), disease activity (determined by the Mayo score19,20, current medications, endoscopic data (gross disease extent, Mayo score at biopsy site and endoscopic mayo score), and biochemical data (CBC, Albumin, CRP). Of note, the reason that endoscopic mayo score and endoscopic mayo score at the biopsy site were recorded as separate categories was that the two were not always the same (ie the mayo score at the biopsy site was less that the mayo score in the worst portion of colitis.).
All biopsies have been analyzed by a gastrointestinal pathologist with interest in inflammatory bowel disease (IBD). A model for histologic score was developed based on the typical inflammatory features observed in IBD with the specific goal of quantifying the changes and correlating with gene expression. The histologic score represented the most severely affected area of the available biopsies of a particular patient. The score contained eight different parameters: number of intraepithelial neutrophils per high power field, number of crypt abscess, number of ulcers, number of neutrophils within the lamina propria per high power filed, lymphoplasmacytic inflammatory infiltrate within the lamina propria, number of branched crypts, number of short crypts and number of spaced crypts. The only categorical parameter was the lymphoplasmacytic inflammatory infiltrate that was categorized as normal, mild and extensive.
Once data had been collected, patients were reclassified to screening/no major abnormalities (NOMOA), IBD unclassified (IBDU) or UC. Six biopsies previously labeled as UC were switched to IBDU after review, but kept in the study for analysis.
Pathogenesis-based transcript sets (PBTs)
We used the previously developed set of PBTs to permit biological interpretation of microarray results from biopsies (Table 1) (http://atagc.med.ualberta.ca/Research/GeneLists/). PBTs represent biological processes during rejection and other types of injury in renal allografts16,21. The PBTs include cytotoxic T cell associated transcripts (QCAT)22; interferon-γ inducible transcripts (GRIT1)23; macrophage transcripts (QCMAT)18,24, alternative macrophage activation transcripts (AMAT1)25, injury and repair transcripts (IRRAT)26; and kidney parenchymal transcripts (KT1, KT2)27. We also included a PBT derived from analysis of TCMR28.
Table 1. PBTs.
| Transcript set | Biologic descriptiona | Interpretation |
|---|---|---|
| QCAT | Quantitative cytotoxic T cell – associated transcripts | Burden of effector T cells |
| GRIT | IFNG – induced transcripts induced in rejecting tissue | Burden of IFNG effects |
| Top 30 TCMR transcripts | Transcripts most specific for TCMR in human kidney transplants | Transcripts best reflecting cognate interactions between effector T cells and antigen-presenting cells in tissue |
| QCMAT | Quantitative constitutive macrophage associated transcripts | Burden of macrophages |
| IRRAT | Injury- and repair-induced transcripts in acutely injured parenchyma | Parenchymal response to acute injury with epithelial repair and remodeling. |
| KT1 | Kidney parenchymal transcripts | Normal kidney parenchymal functions |
| CT1 | Colon parenchymal transcripts | Normal colon parenchymal functions |
| KT2 | Kidney parenchymal solute carrier transcripts | Normal kidney parenchymal solute transport |
| CT2 | Colon parenchymal solute carrier transcripts | Normal colon parenchymal solute transport |
See Materials and Methods for references to transcript sets
New sets of colon parenchymal transcripts (CT1, CT2) were derived as colon-specific analogous to the previously defined kidney transcript sets KT1 and KT2. Using the rationale that KT1 and KT2 were anti-correlated with the injury-repair transcripts (IRRAT), we identified the probesets that were anti-correlated with the IRRAT in colon biopsies from GSE16879, ranked by Spearman correlation and p-value. Solute carrier genes were removed from CT1 and defined as a separate set, CT2. The top 1333 probe sets negatively correlated with IRRAT were selected as CT1 because the kidney counterparts, KT1, has 1333 probe sets, and the top 64 SLC probesets were selected for CT2 because KT2 has 64 probe sets. The top 30 CT1 and CT2 are listed in Table, Supplemental Digital Content 1, http://links.lww.com/IBD/A641. CT1 shared 148/1333 probesets with KT1, and CT2 shared 19/64 probesets with KT2.
Abbreviations for all genes conform to the gene names at http://www.ncbi.nlm.nih.gov/sites/entrez. Standardized PBT scores were calculated (geometric mean of the standardized expression of the individual scores) across all the biopsies.
Microarray processing and analysis
Microarray processing was previously described.28 For analysis, we used robust multiarray averaging (RMA) as implemented in the Bioconductor “RefPlus” package. All expression values are in log2 units. All analyses and graphics were done using the “R” software package, version 2.13.1 (64-bit), with various libraries from Bioconductor 2.8.4. The details of microarray expression data will be posted on the GEO website (http://www.ncbi.nlm.nih.gov/geo/; accession number GSE51785).
Statistical Analysis
PBT scores were calculated as the mean of the log2 values across transcripts for a particular PBT set. The standardized PBT scores were calculated by subtracting the mean PBT score across all samples in a set from the PBT score of a given sample and dividing by the standard deviation of the PBT scores for the set. Unsupervised PCA was performed on the PBT scores for the populations of colon biopsies.
Correlations between PBTs or genes were calculated using Spearman correlation. Statistical analysis of the mean PBT signals and PC1 in responders and non-responders was performed using paired and unpaired Student's t-tests.
Studies of CEL files from GEO
We downloaded CEL files from 48 human colon biopsy microarrays from the GEOs database (http://www.ncbi.nlm.nih.gov/geo/; accession number GSE16879). Colonic biopsies were obtained from 24 patients with treatment-refractory UC, one week before and four-to-six weeks post-initial treatment with infliximab10. Response to infliximab was defined as Mayo score of 0 or 1 with complete mucosal healing. The microarrays were analyzed using the previously established gene sets (Table 1). Statistical analysis of the principal component 1 (PC1) and of the mean TCMR, injury-repair, and colon transcript signals in responders and non-responders were performed using paired and unpaired Student's t-tests.
For the CDc analysis, we downloaded the files for GEO as for the UC biopsies.
Ethical Considerations
Full IRB approval was obtained for studies at both the Univesity of Alberta and Cedars Sinai Medical Center. All patients were fully consented at the time of tissue and data collection, and all procedures were done as per standard clinical care. All data was de-identified at the time of collection.
Results
Demographics of the UC populations
The demographics and clinical characteristics of the 52 patients from two centers whose colon biopsies are included in this analysis are shown in Table 2. The populations at the two centers were similar, including 43 UC, and for comparison six with IBDU and seven with NOMOA. The therapies used were similar in the two centers, except that 5 patients from CSMC were receiving anti-TNF therapy, while none of the patients from UA were on biologics.
Table 2. Demographics.
| Patient demographics | All (n = 56) | University of Alberta (n = 31) | Cedars-Sinai Medical Center (n =25) | P valuea |
|---|---|---|---|---|
| Age at diagnosis in years; mean (range) | 30 (7 - 64) | 29 (7 - 64) | 31 (12 - 57) | 0.67 |
| Age at biopsy in years; mean (range) | 43 (20 - 74) | 44 (20 - 66) | 42 (24 - 74) | 0.67 |
| Disease duration in years; mean (range) | 12 (0 - 38) | 15 (1 - 38) | 8 (0 - 29) | 0.03 |
| Total Mayo Score | ||||
| Remission (0-2) | 27 | 17 | 10 | 0.42 |
| Mild (3-5) | 10 | 4 | 6 | |
| Moderate (6-10) | 18 | 10 | 8 | |
| Severe (11-12) | 1 | 0 | 1 | |
| Mayo Score at biopsy site | ||||
| Remission (0-2) | 19 | 11 | 8 | 0.62 |
| Mild (3-5) | 19 | 9 | 10 | |
| Moderate (6-10) | 15 | 10 | 5 | |
| Severe (11-12) | 3 | 1 | 2 | |
| Disease extent | ||||
| Left Sided Colitis | 18 | 8 | 10 | 0.52 |
| Pancolitis | 19 | 13 | 6 | |
| Proctitis | 4 | 2 | 2 | |
| None | 15 | 8 | 7 | |
| Diagnosis | ||||
| IBDU | 6 | 4 | 2 | 0.31 |
| UC | 43 | 25 | 18 | |
| NOMOA/screening colonoscopy | 7 | 2 | 5 | |
| Drug Therapy | ||||
| 5-ASA | 33 | 21 | 12 | 0.01 |
| 6-MP/Aza/mtx | 11 | 7 | 4 | |
| TNF | 5 | 0 | 5 | |
| Steroid | 16 | 5 | 11 | |
| Antibiotics | 1 | 0 | 1 | |
Chi-square test
The age at biopsy correlated with duration of disease (P=0.003), and both anti-correlated with the disease severity/total Mayo score (Table, Supplemental Digital Content 2, http://links.lww.com/IBD/A642), indicating an association between younger age, shorter disease duration, and more active disease. The total Mayo score correlated with the histology features, the highest correlation being with lamina propria neutrophilic infiltrate. The lamina propria lymphoplasmacytic infiltrate and to a lesser extent the neutrophil infiltrate correlated with the distribution of disease.
The CRP results were not assessable because they were performed by different methods at University of Alberta(UA) vs. CSMC.
Assessing the large-scale disturbance in colon biopsies
We used microarray analysis of the transcripts expressed in the colon biopsies to study the disturbance in gene expression previously defined in kidney and heart transplant biopsies, summarizing the microarray results as the means of predefined transcripts sets, the PBTs15 (Figure 1). The PBT disturbance in the 56colon biopsies is visualized by aligning each biopsy on the x axis in order of increasing injury-repair transcript (IRRAT) scores. The biopsies with low expression of the injury-repair transcripts (left side) had also low expression of the inflammation related transcript sets representing the top transcripts in TCMR, as well as transcripts annotated in effector T cells (QCAT), macrophages (QCMAT), alternative macrophage activation (AMAT), and IFNG-inducible transcript sets (GRIT) and high expression of parenchymal transcripts annotated in colon(CT1, CT2) and kidney (CT1, CT2, KT1, KT2). The biopsies with highest injury-repair transcripts had high expression of the inflammation- and injury-repair related transcripts and had dereased expression of parenchymal transcripts. This is similar to the disturbance previously described in rejecting kidney and heart transplants, reflecting the derivation of most of these transcript sets in experimental conditions independent of these tissues.
Figure 1. PBTs in UC Biopsies.
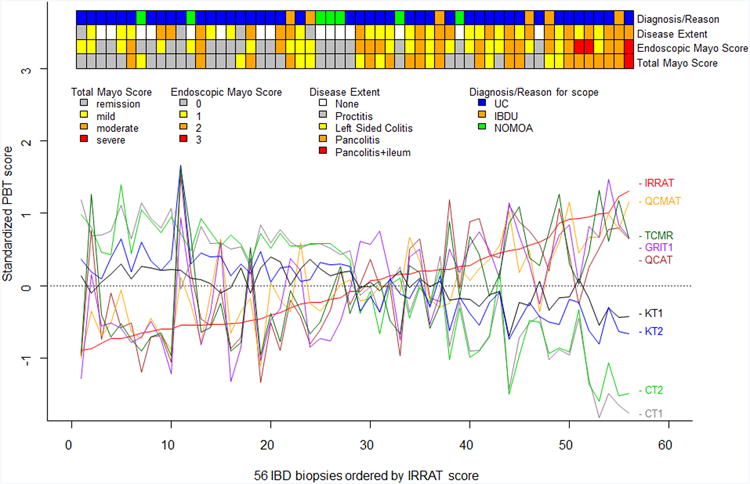
A) The molecular phenotype in colon biopsies lined up in order of increasing acute injury-repair (IRRAT) score to visualize correlation among PBTs. The ribbons at the top show the total and endoscopic Mayo score and disease extent.
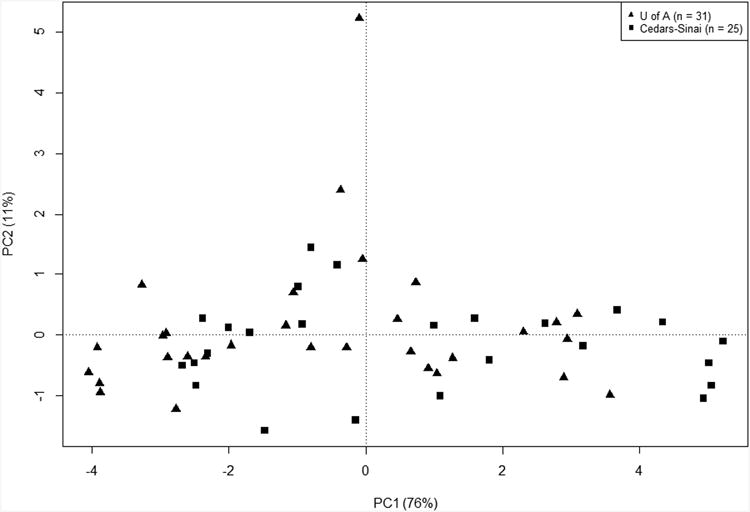
B) PCA of 56 colonic biopsies in sample space using the nine IQR filtered PBTs, showing principal components, PC1 and PC2.
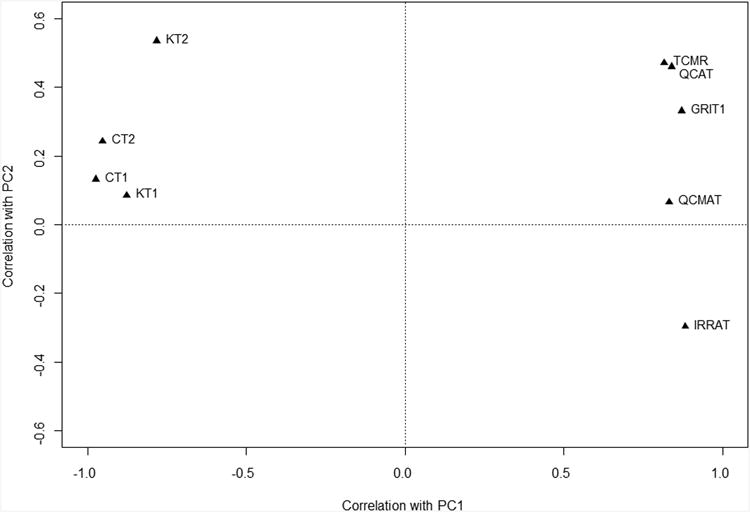
C) PCA in PBT space using the nine IQR filtered PBTs, showing PC1 and PC2.
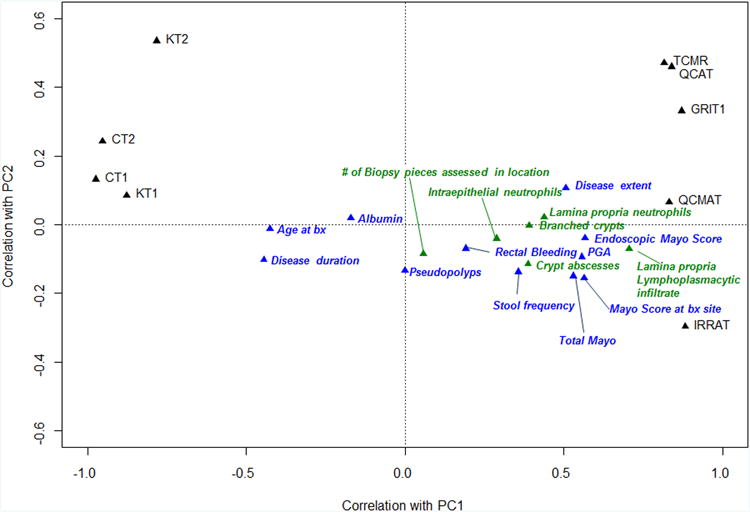
D) PCA in PBT space using the nine IQR filtered PBTs, showing PC1 and PC2. Clinical, endoscopic (blue) and histologic (green) scores were then superimposed onto the PCA plot to show their relative correlation with PBT scores.
The change in the colon transcripts (CT1 and CT2) was similar to the change in the kidney transcripts (KT1 and KT2) originally derived in experimental mouse kidney transplants, despite many differences in the transcripts summarized in each tissue.
The ribbons at the top of Figure 1A show that the biopsies with highest disturbance in transcript sets (right side) also had more disease activity as judged by extent of disease and by endoscopic and total Mayo scores in general.
Thus in each biopsy the mean expression each PBT (y axis) was related to the changes in all other PBTs.
Principal component analysis (PCA) of the transcript set scores
PCA is a method for summarizing the main changes in large data sets. The large-scale disturbance in the PBTs was translated into an overall score by PCA in “sample space” (Figure 1B). PC1 accounted for 76% of the variance in the PBT scores across the samples (x axis) and PC2 accounted for 11% (y axis). (The outlier with maximum PC2 is unexplained but included. Its exclusion had no major effect on the results.) The samples from both centers are evenly distributed, indicating no major differences between the UA and CSMC biopsies.
The individual transcripts sets correlated with PC1 and PC2 as shown in Figure 1C, with the inflammation-related and injury-repair transcript sets positively correlated (left side) and the normal parenchyma transcripts negatively correlated (right side). Thus the positive correlations with inflammation-related and injury-related transcripts and the anti-correlation with normal parenchymal transcripts, represents the majority of variance across the samples and can be summarized by PC1.
In addition to the individual transcript sets, the mean clinical, endoscopic and histologic scores across the samples PBT scores are plotted on the PCA to visualize their relationship to the molecular changes shown in Figure 1D. (These measurements were not included in the calculation of the PCA.) The markers of disease activity and the histologic features of disease activity and disease extent correlated with the extent of the disturbance as expressed by PC1. Measures of disease activity such as endoscopic Mayo score and lamina propria lymphoplasmacytic infiltrate correlated positively, while age at biopsy, disease duration, and albumin correlated negatively i.e. greater disturbance was observed in biopsies from younger patients with shorter disease duration and lower serum albumin. The number of biopsies assessed showed no correlation with PC1, nor did the presence of pseudopolyps, providing an internal control.
Correlations of molecular scores and principal components with clinical, endoscopic, laboratory, and histology changes
We calculated the Spearman's correlation coefficients of the PBT scores plus PC1 and PC2 across all biopsies (Table 3). The strongest correlations in each column are in bold and the correlations significant at P<0.01 are marked with an asterisk. PC1 and all the individual molecular measurements correlated with the clinical features and selected histology features. PC2, which by definition is orthogonal to PC1, showed no correlations and is not shown.
Table 3. Spearman correlation.
| Type of data | Feature studied | PC1 | TCMR | QCAT | GRIT1 | QCMAT | IRRAT | KT1 | CT1 |
|---|---|---|---|---|---|---|---|---|---|
| Clinical and endoscopic | Mayo Score at biopsy site | 0.74a | 0.59a | 0.56a | 0.70a | 0.55a | 0.72a | -0.57a | -0.73a |
| Endoscopic Mayo Score | 0.70a | 0.54a | 0.55a | 0.68a | 0.49b | 0.69a | -0.55a | -0.70a | |
| Total Mayo Score | 0.70a | 0.56a | 0.57a | 0.72a | 0.49a | 0.60a | -0.55a | -0.67a | |
| Disease extent | 0.68a | 0.71a | 0.67a | 0.69a | 0.44 | 0.58a | -0.58a | -0.60a | |
| Physicians' Global Assessment | 0.65a | 0.43b | 0.45 | 0.58a | 0.41b | 0.67a | -0.50b | -0.67a | |
| Stool frequency | 0.61a | 0.47b | 0.59a | 0.64a | 0.40b | 0.50a | -0.40b | -0.53a | |
| Rectal Bleeding | 0.35 | 0.29 | 0.36 | 0.43b | 0.35 | 0.22 | -0.26 | -0.32 | |
| Pseudopolyps | -0.20 | -0.25 | -0.22 | -0.11 | -0.08 | -0.13 | 0.16 | 0.12 | |
| Age at biopsy | -0.46 | -0.35 | -0.36 | -0.39b | -0.44b | -0.41b | 0.39 | 0.46 | |
| Disease duration | -0.58a | -0.56a | -0.56a | -0.45b | -0.39 | -0.51a | 0.42b | 0.53a | |
| Albumin | -0.67a | -0.53a | -0.57a | -0.65a | -0.69a | -0.58a | 0.54a | 0.62a | |
| Histology | Lamina propria lymphoplasmacytic infiltrate | 0.81a | 0.82a | 0.78a | 0.72a | 0.47 | 0.69a | -0.79a | -0.80a |
| Lamina propria neutrophils | 0.59a | 0.52a | 0.56a | 0.57a | 0.43b | 0.49b | -0.46b | -0.52a | |
| Intra epithelial neutrophils | 0.44 | 0.46b | 0.54a | 0.40b | 0.26 | 0.33 | -0.40b | -0.37 | |
| Crypt absesses | 0.40 | 0.40b | 0.44b | 0.40b | 0.27 | 0.38 | -0.40b | -0.42 | |
| Branched crypts | 0.30 | 0.30 | 0.26 | 0.14 | 0.03 | 0.32 | -0.25 | -0.33 | |
| Biopsy pieces assessed in location | 0.08 | 0.05 | 0.02 | 0.05 | 0.27 | 0.11 | -0.07 | -0.11 |
P value<0.01;
P value<0.05
Bold indicates highest correlations within each type of data.
The total Mayo score and its components, the endoscopic Mayo score and PGA, and disease extent were strongly correlated with PC1 and with the positive and negative PBT changes. Rectal bleeding and pseudopolyps were not significantly correlated with PC1. PC1 anti correlated with duration of disease, albumin, and age at biopsy.
The histologic feature that correlated most strongly with the molecular phenotype/PC1 was lamina propria lymphoplasmacytic infiltrate, and to a lesser extent the neutrophilic infiltrate. Focal epithelial injury (intraepithelial neutrophils and crypt abscess) and chronic epithelial archictechtural changes (branched crypts) did not correlate with PC1.
Thus PC1summarizes the transcript set changes in UC biopsies, and correlates with many clinical, endoscopic, and histology features of each biopsy.
Relating the disturbance in PBTs to the response to infliximab
We studied the relationship of the molecular disturbance to response to therapy in the microarray files from the biopsies from the published Arijs et al studies10. U133 2.0 microarray results from 48 human colon biopsies from 24 patients, taken in two different cohorts pre and post infliximab treatment and classified by response to therapy, were downloaded from the Gene Expression Omnibus (GEO) database (http://www.ncbi.nlm.nih.gov/geo/; accession number GSE16879).
The molecular disturbance in the PBT scores for the IQR-filtered transcripts in biopsies with UC before treatment (Figure 2A) was similar to that described in the our biopsy set, with increasing loss of parenchymal transcripts (CT1, CT2) as inflammation and injury transcripts increased (QCMAT, QCAT, IRRAT, GRIT1, TCMR). Six control biopsies from this set are shown at the left. The ribbon in Figure 2A labels the pre-treatment sample by the patient response to treatment, showing that greater pre-treatment disturbance was associated with resistance to treatment.
Figure 2. Microarray analysis of Crohn's and UC colonic biopsies pre and post infliximab therapy.
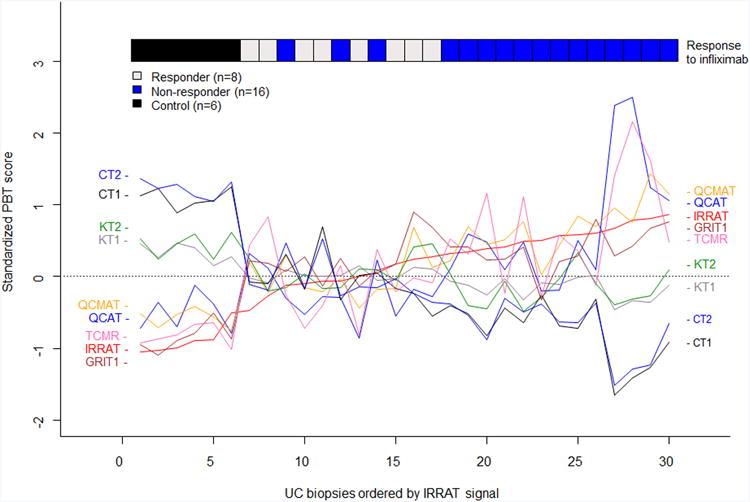
A) The molecular phenotype in pre-treatment UC biopsies lined up in order of increasing acute injury-repair (IRRAT) score to visualize correlation among PBTs. The ribbon at the top shows response or non-response to infliximab as determined by clinical and endoscopic parameters.
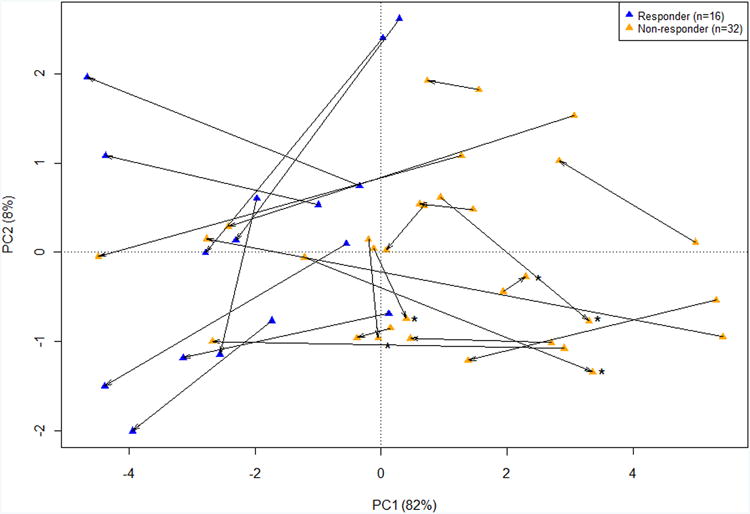
B) PCA in pre and post treatment UC biopsies from patients using the nine IQR filtered PBTs, showing PC1 and PC2. Blue triangles are responders and orange triangles are non-responders. The arrow points towards the post-treatment biopsy. Samples which had increasing disturbance (PC1) post-infliximab therapy are labeled with asterisks.
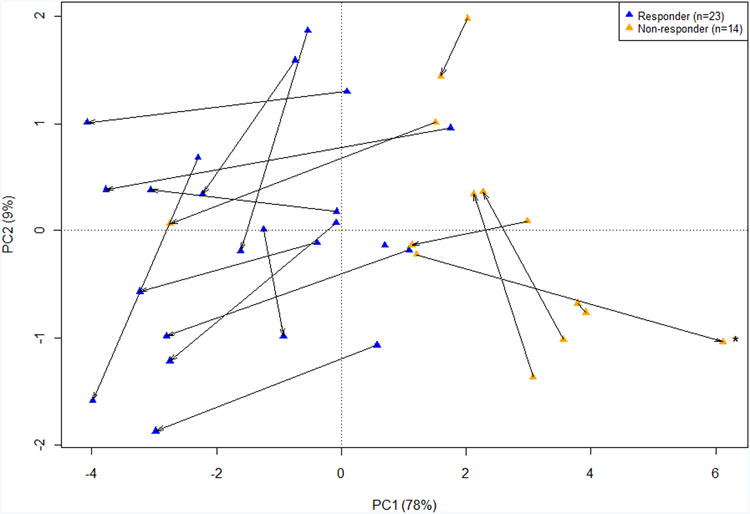
C) PCA in pre and post treatment Crohn's colitis biopsies from patients using the nine IQR filtered PBTs, showing PC1 and PC2. Blue triangles are responders and orange triangles are non-responders. The arrow points towards the post-treatment biopsy. Samples which had increasing disturbance (PC1) post-infliximab therapy are labeled with asterisks.
Table 4 analyzes the differences between UC biopsies from eight responders and 16 non-responders (clinically defined), pre treatment and post treatment. Response was defined as total Mayo score of 0 or 1, and the post treatment biopsies were taken at week 6 or 8 depending on the cohort. PC1 and three representative PBTs (TCMR, injury-repair score, and colon transcripts) showed similar patterns. The disturbance was higher in the non-responder patients before treatment than in the responders (P<0.03). The biopsies taken after treatment showed improvement in PC1in responders (P<0.004) but also in non-responders (P<0.05). However, the disturbance in the non-responders was so great before treatment that it was still higher after treatment (PC1=0.16±2.30) than it was in the responders pre treatment (PC1 =-0.65 ± 0.85).
Table 4. Ulcerative colitis biopsies (n = 48).
| Test (P value) | Mean ± standard deviation | |||
|---|---|---|---|---|
| PC1 | TCMR transcripts | IRRAT | CT1 | |
| Pre-treatment responders (n = 8) | -0.65 ± 0.85 | -0.12 ± 0.56 | -0.03 ± 0.26 | -0.07 ± 0.35 |
| Post-treatment responders (n = 8) | -3.52 ± 0.93 | -0.60 ± 0.34 | -0.44 ± 0.21 | 0.82 ± 0.28 |
| P value(pre-treatment vs. post-treatment) (Paired Student's t-test) | <0.001 | 0.004 | <0.001 | <0.001 |
| Pre-treatment non-responders (n = 16) | 1.92 ± 2.02 | 0.59 ± 0.72 | 0.45 ± 0.30 | -0.62 ± 0.51 |
| Post-treatment non-responders (n = 16) | 0.16 ± 2.30 | 0.08 ± 0.63 | 0.11 ± 0.47 | -0.16 ± 0.59 |
| P value(pre-treatment vs. post-treatment) (Paired Student's t-test) | 0.051 | 0.041 | 0.042 | 0.045 |
| P value(pre-treatment responders vs. non-responders) (Student's t-test) | 0.002 | 0.023 | 0.001 | 0.013 |
| P value(post-treatment responders vs. non-responders) (Student's t-test) | <0.001 | 0.010 | <0.001 | <0.001 |
The results for individual patients (Figure 2B) showed the movement to the left (lower PC1/disturbance) in most patients following infliximab therapy. Before treatment, the responders (green symbols) generally began with less disturbance than the non-responders (red symbols) i.e. higher PC1 scores). After treatment (arrow head), the non-responders generally showed improvement but only into the range where the responders began. Only five of 18 samples (marked with asterisk) in the non-responders worsened, and many labelled clinically as non-responders markedly improved following infliximab.
Thus greater disturbance in the biopsy before treatment was associated with non-response as defined clinically, but many non-responders actually showed improvement in molecular features during treatment, whether summarized as PC1 or expressed by individual PBT scores.
Crohn's colitis manifests disturbance changes and responses to infliximab therapy
Since our hypothesis was that the disturbance was stereotyped across disease states, we examined colon biopsies from 19 patients with CDc from the Arijs et al data8. As in the UC biopsies, the disturbance was greater in the pre treatment biopsies of non-responders (P<0.001) and was reduced in the post treatment biopsies of responders (P<0.001) (Table 5). Unlike the observations in UC, the CDc non-responders did not consistently manifest molecular improvement (P=0.605), but the number of patients was small (n=7). Most individuals manifested some numerical improvement (Figure 2C). Thus the molecular disturbance in CDc is similar to that in UC, and is associated with clinical non-responsiveness to treatment.
Table 5. Crohn's colitis (n = 37).
| Test (P value) | Mean ± standard deviation | |||
|---|---|---|---|---|
| PC1 | TCMR transcripts | IRRAT | CT1 | |
| Pre-treatment responders (n = 12) | -0.10 ± 1.08 | 0.15 ± 0.40 | 0.08 ± 0.23 | -0.09 ± 0.19 |
| Post-treatment responders (n = 11) | -2.85 ± 0.97 | -0.60 ±0.32 | -0.40 ± 0.25 | 0.52 ±0.27 |
| P value(pre-treatment vs. post-treatment) (Paired Student's t-test) | <0.001 | <0.001 | <0.001 | <0.001 |
| Pre-treatment non-responders (n = 7) | 2.61 ± 1.04 | 0.71 ± 0.50 | 0.68 ± 0.30 | -0.75 ± 0.47 |
| Post-treatment non-responders (n = 7) | 2.04 ± 2.69 | 0.62 ± 0.68 | 0.45 ± 0.45 | -0.62 ± 0.77 |
| P value(pre-treatment vs. post-treatment) (Paired Student's t-test) | 0.605 | 0.815 | 0.065 | 0.495 |
| P value(pre-treatment responders vs. non-responders) (Student's t-test) | <0.001 | 0.016 | <0.001 | <0.001 |
| P value(post-treatment responders vs. non-responders) (Student's t-test) | <0.001 | <0.001 | <0.001 | <0.001 |
Ethical Considerations
Full IRB approval was obtained for studies at both the Univesity of Alberta and Cedars Sinai Medical Center. All patients were fully consented at the time of tissue and data collection, and all procedures were done as per standard clinical care. All data was de-identified at the time of collection.
Discussion
The present study examined how a general structure of an inflammatory disorder in tissue previously mapped in human kidney and heart transplants with TCMR is found in UC tissues and correlates with clinical and histologic features. This approach is based on analysis of previously defined “meta-genes”: transcript sets derived to reflect a biologic change within a tissue, mainly in experimental systems. As a complement to the focus on individual molecules, this approach studies the global change in the mRNA landscape within which the individual molecular changes can be interpreted. We selected a group of patients undergoing assessment for UC at two centers. We found that summarizing microarray results from UC biopsies using previously defined PBTs reflecting inflammation, tissue injury, and de-differentiation mapped a large scale organization in UC biopsies that correlated with the clinical, endoscopic, and histologic parameters. This disturbance was also present in the microarray results from UC biopsies in a published study of infliximab therapy, and that the extent of the disturbance (summarized as PC1) was greater in pretreatment biopsies from patients who were resistant to therapy. The extent of the disturbance showed improvement during therapy in both groups (responders and non-responders). However, after therapy, the disturbance in the non-responders had only reached the levels found in the responders before therapy. The disturbance was similar in CDc, and also was greater in patients' resistant to therapy and improved after therapy. The results suggest that the large-scale changes in mucosal biopsies from colons of patients with inflammatory bowel diseases can provide objective information that may permit a more personalized approach to the prediction and management of patients with these conditions, particularly in predicting response to expensive therapies such as infliximab.
The emergence of genome-wide transcript assessment in biopsies permits study of disease not only at the single gene level but also at the level of the large scale organization of disease-driven changes that reflect biological programs that cross disease states, tissue differences, and patient groups. While research tends to focus on disease-specific and organ/tissue specific features, the sharing of features across disease types and tissues and organs is also a fundamental concept rooted in studies of wound healing and inflammation, originating in classical descriptions of the features of inflammation that transcend diseases and tissues. For example, the old concept of “functio laesa” (loss of function) is a feature of inflammatory diseases across all tissues, and corresponds with the loss of the transcripts associated with the functions of differentiated tissues, and in some cases shared between tissues, like the sharing between the CT and KT transcripts in the present study. Studying the shared features of the tissue responses to injury – the rules that all tissues tend to obey when threatened with injury and disease – offers a new dimension that complements and contextualizes the disease and organ/tissue specific changes.
Our initial data set, selected to reflect the generality of the disturbance independent of local differences, showed that the tissues from UC manifest a structure disturbance that, as represented by PC1, correlated well with several clinical and histopathology features. The groups did not separate in terms of centre, clinical phenotype and distributed similarly in PCA of their PBT scores. The structure of the disturbance in UC biopsies was similar to that in kidney transplants and in heart transplants: injury-repair transcripts were accompanied by inflammatory features - an increase in effector T cell, macrophage, and IFNG-induced transcripts, and a decrease in expression of parenchymal transcripts, including SLCs. While the strongest correlates were seen with the endoscopic mayo scoring and the total mayo score, all of the other components of the mayo score correlated with PC1, except for rectal bleeding. It is possible rectal bleeding is unreliably reported or is less reliable in partially treated patients. In addition, 6 of the 49 patients included were felt to be indeterminant colitis when re-phenotyping for this study. This blended phenotype of UC and CD may have also played a role in bleeding not correlating with the molecular signal.
The strongest histologic correlation with PC1 was the lamina propria lymphoplasmacytic infiltrate, and to a lesser degree neutrophilic lamina propria infiltrate, consistent with recent publications of Feagin et al.29 where lymphoplasmacytosis was an important predictor of relapse in UC patients while acute findings of inflammation were not useful. This substantiated similar results from Bitton et al.30 The objectivity and quantitation of PC1 measurements may prove to be an advantage of the microarray approach, particularly in the context of clinical trials, correlating well with clinical and histologic features but offering a more granular assessment.
By assessing the disturbance in microarray results from the ACT trials and a second cohort from Leuven1,10, we were able apply the system to a more severe disease phenotype and to demonstrate the ability of this system to predict and to measure response to therapy in biopsies from UC and CDc patients. Both responders and non-responders showed a significant decrease in the tissue disturbance. Strikingly, the disturbance was greater in the pre- and post infliximab non-responders compared to responders, indicating that the inflammatory burden and the parenchymal injury and dedifferentiation plays a major role in predicting resistance to anti-TNF therapy. Moreover, despite a demonstrable response to therapy, the mean signals in the non-responders post-treatment did not reach the pre-treatment mean signal in the responders: the post-treatment non-responders were still more inflamed and injured than the pre-treatment responders.
These results provide a basis for developing molecular phenotyping to help assess IBD biopsies, particularly in relationship to resistance to biologic therapy, but also provide opportunities for understanding the organization of the response to injury in the tissue affected by these diseases and illustrate how general features can complement disease and tissue specific features. In our analysis of the the Arjis UC cohort, molecular non-response (no improvement in PC1 following therapy) was far less frequent than clinically indicated (5 in 16pts), opening the possibility of a new definition of response and resistance, potentially identifying “resistant” patients for whom therapy should be initiated at higher dose and/or escalated rapidly rather than abandoned. Conversely, those which truly showed no clinical improvement in their disturbance during induction can be checked to see if in fact they are undergoing a partial response at the molecular level before making the decision to switch them to other therapy.
Our findings are consistent with current literature which shows that mucosal healing and decreased inflammatory markers are both associated with better outcomes in IBD treatment.6,31,32. Arjis et al showed restoration of abberant mucosal function by infliximab.33 The ability to potentially quantitate mucosal disturbance would allow for evaluation of all patients with quantitative measurements, and as mucosal healing is now an established important endpoint, using a “treat-to-target” paradigm, biopsy procurement is very feasible.34
The strength of our study is that it takes a well established diagnostic system developed in experiemtal systems and applies it to a well characterized and varied patient cohort. We examine a group of patients that is diverse in its disease phenotype, activity and geographic location, then characterized by a single gastroenterologist and pathologist prior to molecular analysis. Correlation with the Mayo score validated the relevance of the molecular findings. All patients included were biopsied for clinical cause without “cherry picking”, and the use of unsupervised analysis allows for the examination of large scale change within the tissue without “over-training”.
The limitations of our study include the retrospective nature of the data collection for the patients gathered from the UA and CSMC cohorts, and the fact that limited data was available for the cohorts from Arijs et al. We did not have data on fecal calprotectin because it is not currently standard of care at UA and not being done routinely on all patients at CSMC. CRP data was inconsistently collected and used a number of different assays and could not be analyzed. Furthermore, our initial cohort was comprised of largely mild disease phenotype. For future studies, a carefully phenotyped, larger patient group with full inflammatory parameters and long term follow-up will provide greater insights into prognostic factors and into molecular phenotyping.
Like many areas of medicine, therapies for IBD currently are applied in a “trial and error” strategy that would be improved by the greater predictability by quantitative molecular “theranostic” tests. Predicting and assessing with greater accuracy, response to therapy can avoid costly and wasteful biologic therapy, with unnecessary risks to the patient, and can direct expensive therapies to patients with high chance of benefit. Understanding the basis of resistance can guide trials of new strategies for the resistant patients. Our studies speak to the possibility that many patients with clinical non-response to infliximab may actually benefit from extended therapy or more intense therapy, even if a subgroup shows complete non-response. True molecular non-response was uncommon in this population but detectable by our assay.
Although it is may seem surprising that tissues share many features of their large scale organization, including their parenchymal transcript changes, it is actually expected given the great overlap in the genes expressed in most tissues. Tissue studies tend to focus on the differences, but the conserved features are also of interest e.g. related to DNA repair, metabolism, electrolyte transport, and internal structures and organelles. The injured parenchyma manifests a response to wounding program that aims to mitigate harm, taking the damaged tissue out of service and attempting to restore homeostasis, including activation and recruitment of innate immunity and preparation for an adaptive immune response, clearance of damaged cells, and remodelling of the matrix and microcirculation. By reading these changes, the clinician can quantitate the functional disturbances that ultimately translate into symptoms.
If the present results can be confirmed in larger prospective studies, the therapeutic implications of the disturbance measurement are considerable as a step toward personalized medicine in IBD. Reliable prediction of response of individuals to therapy has the potential to help all patients, leading to better and more cost effective protocols for the sensitive and avoiding the resistant. For the resistant, who are improving and moving toward remission, a trial of longer courses would be reasonable, with assessment of durability and net benefit afterwards. Alternatively another dimension of therapy might be added to bring the resistant patient into the therapeutic range for response. For both the sensitive and the resistant, monitoring of the molecular phenotype could be a guide for when to reduce therapy (and risk and expense). Being able to say 90% responsiveness vs. 90% resistance would be a major step in the clinical trial process – separate trials by risk group - and ultimately in management. The goal of defining precisely the patient phenotype and delivering and monitoring therapy in relation to that phenotype hold strong promise for better care for all patients.
Study Highlights.
- What is current knowledge
- Ulcerative colitis (UC) is a T-cell mediated disease of chronic inflammation affecting the colonic mucosa
- Current practice of assessing the severity of disease is based around clinical and endoscopic scores, such as the Mayo score, with no reliable way to quantitate mucosal inflammation or tissue damage
- Infliximab (IFX) has been shown to be an effective therapy in the induction and maintenance of remission in UC, although an understanding of what determines response to therapy is currently lacking
- Our previous work has established that microarray-based molecular phenotyping is useful in detecting and stratifying global disturbance in in cardiac and renal transplant biopsies that extends the interpretation of biopsies beyond what histology alone can offer
- What is new here?
- The molecular phenotype system applied to UC reveals a global disturbance in colonic biopsies, similar to that in the previously studied T-cell mediated disease prototype, T-cell mediated rejection, and provides quantitative assessment of this disturbance
- The molecular phenotype correlates with the endoscopic Mayo score and with certain pathologic features, particularly the lamina propria lymphoplasmacytic infiltration
- The molecular phenotype applied to a cohort of severe UC patients pre- and post- treatment with infliximab indicates that increased tissue disturbance predicts clinical non-response, because the non-responders have a much higher burden of injury;
- Treatment of “non-responders” is associated with significant molecular improvement in the majority of samples, suggesting that response to therapy may be more widespread than previously reported
Acknowledgments
This research has been supported in part by funding and/or resources from Novartis Pharma AG, and in the past by Genome Canada, the University Of Alberta Hospital Foundation, Roche Molecular Systems, Hoffmann-La Roche Canada Ltd., the Alberta Ministry of Advanced Education and Technology, the Roche Organ Transplant Research Foundation, and Astellas. DQS and Cedars-Sinai biopsies are supported by the F. Widjaja Foundation, Inflammatory Bowel & Immunobiology Research Institute. Dr. Halloran held a Canada Research Chair in Transplant Immunology until 2008 and currently holds the Muttart Chair in Clinical Immunology.
Abbreviations
- UC
ulcerative colitis
- α-TNF
anti-tumor necrosis factor
- CD
Crohn's disease
- TCMR
T cell-mediated rejection
- PBT
pathogenesis-based transcript set
- SLC
solute carriers
- CDc
Crohn's disease of the colon
- CEGIIR
Center of Excellence for Gastrointestinal Inflammation and Immunity Research
- CSMC
Cedars-Sinai Medical Center
- IBD
inflammatory bowel disease
- NOMOA
no major abnormalities
- IBDU
inflammatory bowel disease unclassified
- QCAT
cytotoxic T cell associated transcripts
- GRIT1
interferon-gamma inducible transcripts
- QCMAT
macrophage transcripts
- AMAT1
alternative macrophage activation transcripts
- IRRAT
injury and repair transcripts
- KT1, KT2
kidney parenchymal transcripts
- CT1, CT2
colon parenchymal transcripts
- RMA
robust multiarray averaging
- GEO
Gene Expression Omnibus
- UA
University of Alberta
- PCA
principal component analysis
- PC1
principal component 1
- PC2
principal component 2
Footnotes
Competing interests: P F Halloran holds shares in Transcriptome Sciences Inc, a company with an interest in molecular diagnostics. The other authors have no competing financial interests.
References
- 1.Rutgeerts P, Sandborn WJ, Feagan BG, et al. Infliximab for induction and maintenance therapy for ulcerative colitis. N Engl J Med. 2005;353:2462–2476. doi: 10.1056/NEJMoa050516. [DOI] [PubMed] [Google Scholar]
- 2.Jarcho JA, Nielsen OH, Ainsworth MA. Tumor Necrosis Factor Inhibitors for Inflammatory Bowel Disease. N Engl J Med. 2013;369:754–762. doi: 10.1056/NEJMct1209614. [DOI] [PubMed] [Google Scholar]
- 3.Järnerot G, Hertervig E, Friis-Liby I, et al. Infliximab as Rescue Therapy in Severe to Moderately Severe Ulcerative Colitis: A Randomized, Placebo-Controlled Study. Gastroenterology. 2005;128:1805–1811. doi: 10.1053/j.gastro.2005.03.003. [DOI] [PubMed] [Google Scholar]
- 4.van der Valk ME, Mangen MJJ, Leenders M, et al. Healthcare costs of inflammatory bowel disease have shifted from hospitalisation and surgery towards anti-TNF therapy: results from the COIN study. Gut. 2013;63:72–79. doi: 10.1136/gutjnl-2012-303376. [DOI] [PubMed] [Google Scholar]
- 5.Dretzke J, Edlin R, Round J, et al. A systematic review and economic evaluation of the use of tumour necrosis factor-alpha (TNF-α) inhibitors, adalimumab and infliximab, for Crohn's disease. Health Technol Assess. 2011;15:1–244. doi: 10.3310/hta15060. [DOI] [PMC free article] [PubMed] [Google Scholar]
- 6.Colombel JF, Rutgeerts P, Reinisch W, et al. Early Mucosal Healing With Infliximab Is Associated With Improved Long- term Clinical Outcomes in Ulcerative Colitis. YGAST. 2011;141:1194–1201. doi: 10.1053/j.gastro.2011.06.054. [DOI] [PubMed] [Google Scholar]
- 7.Danese S, Colombel JF, Peyrin-Biroulet L, et al. Review article: the role of anti-TNF in the management of ulcerative colitis - past, present and future. Alimentary Pharmacology & Therapeutics. 2013;37:855–866. doi: 10.1111/apt.12284. [DOI] [PubMed] [Google Scholar]
- 8.Arijs I, Quintens R, Van Lommel L, et al. Predictive value of epithelial gene expression profiles for response to infliximab in Crohn's disease‡. Inflamm Bowel Dis. 2010;16:2090–2098. doi: 10.1002/ibd.21301. [DOI] [PubMed] [Google Scholar]
- 9.Arijs I, De Hertogh G, Lemaire K, et al. Mucosal Gene Expression of Antimicrobial Peptides in Inflammatory Bowel Disease Before and After First Infliximab Treatment. In: Timmer A, editor. PLoS ONE. Vol. 4. 2009. p. e7984. [DOI] [PMC free article] [PubMed] [Google Scholar]
- 10.Arijs I, Li K, Toedter G, et al. Mucosal gene signatures to predict response to infliximab in patients with ulcerative colitis. Gut. 2009;58:1612–1619. doi: 10.1136/gut.2009.178665. [DOI] [PubMed] [Google Scholar]
- 11.Fuss IJ, Heller F, Boirivant M, et al. Nonclassical CD1d-restricted NK T cells that produce IL-13 characterize an atypical Th2 response in ulcerative colitis. J Clin Invest. 2004;113:1490–1497. doi: 10.1172/JCI19836. [DOI] [PMC free article] [PubMed] [Google Scholar]
- 12.Heller F, Florian P, Bojarski C, et al. Interleukin-13 Is the Key Effector Th2 Cytokine in Ulcerative Colitis That Affects Epithelial Tight Junctions, Apoptosis, and Cell Restitution. Gastroenterology. 2005;129:550–564. doi: 10.1016/j.gastro.2005.05.002. Available at: http://www.sciencedirect.com/science/article/pii/S0016508505008723. [DOI] [PubMed] [Google Scholar]
- 13.Fuss IJ, Neurath M, Boirivant M, et al. Disparate CD4+ lamina propria (LP) lymphokine secretion profiles in inflammatory bowel disease. Crohn's disease LP cells manifest increased secretion of IFN-gamma, whereas ulcerative colitis LP cells manifest increased secretion of IL-5. The Journal of Immunology. 1996;157:1261–1270. [PubMed] [Google Scholar]
- 14.Fujino S, Andoh A, Bamba S, et al. Increased expression of interleukin 17 in inflammatory bowel disease. Gut. 2003;52:65–70. doi: 10.1136/gut.52.1.65. [DOI] [PMC free article] [PubMed] [Google Scholar]
- 15.Mengel M, Sis B, Kim D, et al. The Molecular Phenotype of Heart Transplant Biopsies: Relationship to Histopathological and Clinical Variables. American Journal of Transplantation. 2010;10:2105–2115. doi: 10.1111/j.1600-6143.2010.03182.x. [DOI] [PubMed] [Google Scholar]
- 16.Halloran PF, De Freitas DG, Einecke G, et al. The Molecular Phenotype of Kidney Transplants. American Journal of Transplantation. 2010;10:2215–2222. doi: 10.1111/j.1600-6143.2010.03267.x. [DOI] [PubMed] [Google Scholar]
- 17.Mueller TF, Einecke G, Reeve J, et al. Microarray Analysis of Rejection in Human Kidney Transplants Using Pathogenesis-Based Transcript Sets. Am J Transplant. 2007;7:2712–2722. doi: 10.1111/j.1600-6143.2007.02005.x. [DOI] [PubMed] [Google Scholar]
- 18.Mengel M, Chang J, Kayser D, et al. The Molecular Phenotype of 6-Week Protocol Biopsies from Human Renal Allografts: Reflections of Prior Injury but Not Future Course. American Journal of Transplantation. 2010;11:708–718. doi: 10.1111/j.1600-6143.2010.03339.x. [DOI] [PubMed] [Google Scholar]
- 19.Lewis JD, Chuai S, Nessel L, et al. Use of the noninvasive components of the mayo score to assess clinical response in Ulcerative Colitis. Inflamm Bowel Dis. 2008;14:1660–1666. doi: 10.1002/ibd.20520. [DOI] [PMC free article] [PubMed] [Google Scholar]
- 20.Sutherland LR, Martin F, Greer S, et al. 5-Aminosalicylic acid enema in the treatment of distal ulcerative colitis, proctosigmoiditis, and proctitis. YGAST. 1987;92:1894–1898. doi: 10.1016/0016-5085(87)90621-4. [DOI] [PubMed] [Google Scholar]
- 21.Einecke G, Reeve J, Sis B, et al. A molecular classifier for predicting future graft loss in late kidney transplant biopsies. J Clin Invest. 2010;120:1862–1872. doi: 10.1172/JCI41789. [DOI] [PMC free article] [PubMed] [Google Scholar]
- 22.Hidalgo LG, Einecke G, Allanach K, et al. The Transcriptome of Human Cytotoxic T Cells: Measuring the Burden of CTL-Associated Transcripts in Human Kidney Transplants. Am J Transplant. 2008;8:637–646. doi: 10.1111/j.1600-6143.2007.02129.x. [DOI] [PubMed] [Google Scholar]
- 23.Famulski KS, Einecke G, Reeve J, et al. Changes in the Transcriptome in Allograft Rejection: IFN-gamma-Induced Transcripts in Mouse Kidney Allografts. Am J Transplant. 2006;6:1342–1354. doi: 10.1111/j.1600-6143.2006.01337.x. [DOI] [PubMed] [Google Scholar]
- 24.Famulski KS, Einecke G, Sis B, et al. Defining the Canonical Form of T-Cell-Mediated Rejection in Human Kidney Transplants. American Journal of Transplantation. 2010;10:810–820. doi: 10.1111/j.1600-6143.2009.03007.x. [DOI] [PubMed] [Google Scholar]
- 25.Famulski KS, Sis B, Billesberger L, et al. Interferon-γ and Donor MHC Class I Control Alternative Macrophage Activation and Activin Expression in Rejecting Kidney Allografts: A Shift in the Th1-Th2 Paradigm. Am J Transplant. 2008;8:547–556. doi: 10.1111/j.1600-6143.2007.02118.x. [DOI] [PubMed] [Google Scholar]
- 26.Famulski KS, De Freitas DG, Kreepala C, et al. Molecular Phenotypes of Acute Kidney Injury in Kidney Transplants. Journal of the American Society of Nephrology. 2012;23:948–958. doi: 10.1681/ASN.2011090887. [DOI] [PMC free article] [PubMed] [Google Scholar]
- 27.Einecke G, Broderick G, Sis B, et al. Early Loss of Renal Transcripts in Kidney Allografts: Relationship to the Development of Histologic Lesions and Alloimmune Effector Mechanisms. Am J Transplant. 2007;7:1121–1130. doi: 10.1111/j.1600-6143.2007.01797.x. [DOI] [PubMed] [Google Scholar]
- 28.Reeve J, Sellares J, Mengel M, et al. Molecular Diagnosis of T Cell-Mediated Rejection in Human Kidney Transplant Biopsies. American Journal of Transplantation. 2013;13:645–655. doi: 10.1111/ajt.12079. [DOI] [PubMed] [Google Scholar]
- 29.Feagins LA, Melton SD, Iqbal R, et al. Clinical Implications of Histologic Abnormalities in Colonic Biopsy Specimens from Patients with Ulcerative Colitis in Clinical Remission. Inflamm Bowel Dis. 2013;19:1477–1482. doi: 10.1097/MIB.0b013e318281f4ae. [DOI] [PubMed] [Google Scholar]
- 30.Bitton A, Peppercorn MA, Antonioli DA, et al. Clinical, Biological, and Histologic Parameters as Predictors of Relapse in Ulcerative Colitis. YGAST. 2012;120:13–20. doi: 10.1053/gast.2001.20912. [DOI] [PubMed] [Google Scholar]
- 31.Ardizzone S, Cassinotti A, Duca P, et al. Original Articles—Alimentary Tract. YJCGH. 2011;9:483–489.e3. [Google Scholar]
- 32.Paul S, Del Tedesco E, Marotte H, et al. Therapeutic Drug Monitoring of Infliximab and Mucosal Healing in Inflammatory Bowel Disease. Inflamm Bowel Dis. 2013;19:2568–2576. doi: 10.1097/MIB.0b013e3182a77b41. [DOI] [PubMed] [Google Scholar]
- 33.de Bruyn M, Machiels K, Vandooren J, et al. Infliximab Restores the Dysfunctional Matrix Remodeling Protein and Growth Factor Gene Expression in Patients with Inflammatory Bowel Disease. Inflamm Bowel Dis. 2013;20:339–352. doi: 10.1097/01.MIB.0000438430.15553.90. [DOI] [PubMed] [Google Scholar]
- 34.Bouguen G, Levesque BG, Pola S, et al. Feasibility of Endoscopic Assessment and Treating to Target to Achieve Mucosal Healing in Ulcerative Colitis. Inflamm Bowel Dis. 2014;20:231–239. doi: 10.1097/01.MIB.0000437985.00190.aa. [DOI] [PubMed] [Google Scholar]