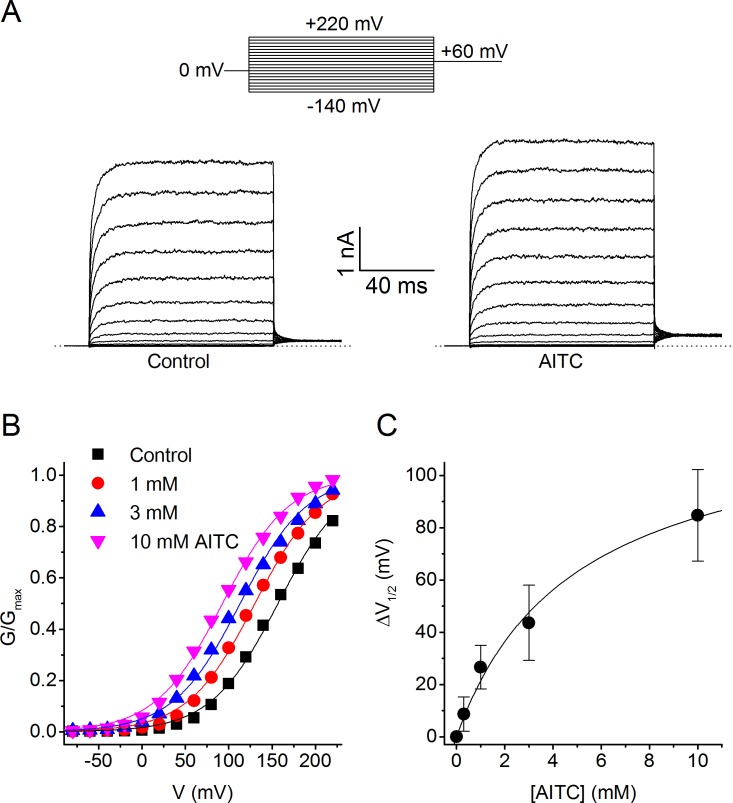
Figure 3. Voltage dependence of the activating effect of AITC on human TRPM8.
(A) TRPM8 currents in response to the indicated voltage step protocol in the absence and presence of AITC (1 mM). (B) Voltage-dependent activation curves in control and in the presence of the indicated AITC concentrations, for the cell shown in (A). Steady-state conductance (G) was determined as steady-state current divided by test voltage, and normalized to the estimated maximal conductance (Gmax), which was obtained by fitting a Boltzmann function to the curve in the presence of 10 mM AITC. (C) Concentration dependence of the shift of voltage-dependent activation curves (n = 7).

