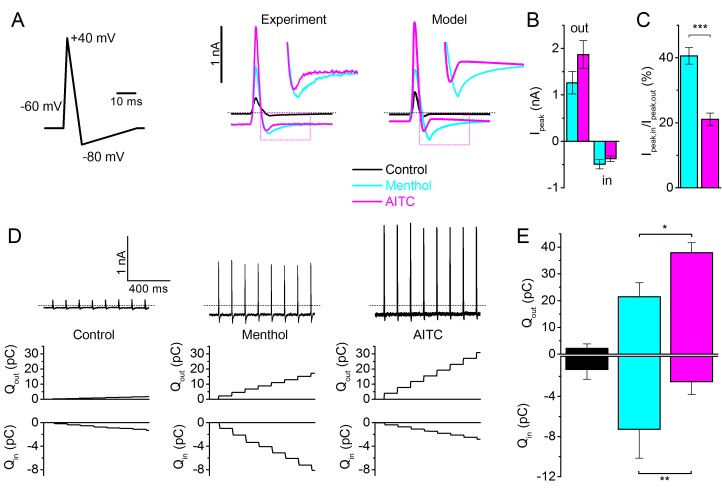
Figure 6. TRPM8 gating during an action potential – Type I versus Type II ligands.
(A) Voltage protocol simulating a sensory neuron action potential (left); TRPM8 currents in HEK293 cells in response to the action potential waveform in control condition and during application of menthol (30 μM) and AITC (3 mM) (middle); and corresponding model simulation (right). Boxed areas are expanded in the inset. (B) Peak outward and inward currents during the action potential waveform in the presence of menthol (cyan) and AITC (magenta; n = 6). (C) Ratio between peak inward and peak outward current in the presence of menthol or AITC. ***p<0.001. (D) TRPM8 current responses during a train of action potentials (1 s; 8Hz) in control condition and during application of menthol and AITC (top); outward (middle) and inward (bottom) charge displacement during the action potential train, determined as the integrated current after subtraction of the holding current. (E) Mean inward and outward charge displacement for the two ligands (n = 5). *p<0.05; **p<0.01.

