Supplemental Digital Content is available in the text
Keywords: all-cause mortality, body mass index, Chinese, obesity, obesity paradox
Abstract
Obesity is associated with an increased risk of diabetes mellitus, hypertension, and coronary artery disease; however, the relation between body mass index (BMI) and the risk of all-cause mortality is controversial. We prospectively examined the relationship between BMI and all-cause mortality in 123,384 Chinese men and women who participated in the Kailuan health examination study from 2006 to 2007 and 2008 to 2009. Cases included 6218 deaths (5770 men and 448 women) that occurred during a mean follow-up period of 7.39 years. Relative risk was adjusted for factors such as age, serum lipid levels (ie, triglyceride, high-density lipoprotein, and low-density lipoprotein cholesterol), history of smoking and drinking, and physical activity, as well as a medical history of hypertension, diabetes, myocardial infarction, and stroke. Within the cohort, the lowest risk of all-cause mortality was seen among persons with a BMI of 24 to 28 kg/m2 in male, and the risk was elevated among persons with BMI levels lower or higher than that range. Moreover, all-cause mortality was greatest in the group with a BMI of <18.5 kg/m2. In contrast, in female, a high BMI was associated with increased mortality, and a BMI of <18.5 kg/m2 was associated with the lowest risk. Further, a U-shaped association was seen between BMI and the risk of death from any cause among men and women, even after adjusting for confounding factors. In conclusion, underweight was associated with a substantially increased risk of all-cause mortality in males. The excess risk of all-cause mortality with a high BMI, however, was seen among females.
1. Introduction
Obesity is a risk factor for numerous health problems, [1] and the prevalence of obesity continues to increase worldwide. [2] The Chinese population is no exception, with the 2009 China Health and Nutrition Survey measuring the prevalence of obesity to be 10.7% in Chinese adults. [3] Increased body weight is associated with a reduced life expectancy as well as early development of cardiovascular disease. [4] Obesity was estimated to indirectly cause 3.4 million deaths in 2010. [5]
Although a number of studies have demonstrated an association between obesity and a higher risk of hypertension, diabetes mellitus, myocardial infarction (MI), and stroke, several studies have shown conflicting results. Stamler et al demonstrated that lean hypertensive patients (body mass index [BMI] <22) have increased 8-year mortality when compared with those who are overweight and hypertensive. [6] A recent study in diabetic patients showed that being overweight was associated with a lower mortality risk in contrast to low body weight patients. [7] Lower mortality and lower risk of readmission for recurrent stroke have been reported for obese stroke patients. [8] The term “obesity paradox” refers to the observations above, that although obesity is a major risk factor in the development of several diseases such as hypertension, diabetes mellitus, and stroke, obese patients have a survival benefit.[ 9 10]
Limited data exist concerning obesity and mortality in Chinese adults. Therefore, we aimed to clarify the association between BMI and mortality by studying a large Chinese cohort.
2. Methods
2.1. Study designs and population
The Kailuan study is a prospective cohort study and workforce survey. The data were obtained from health examination of the employees of the Kailuan Company in Tangshan city, which is a large and littoral modern city located in the central section of the circulating Bohai Sea Gulf region. The Kailuan community is a functional and comprehensive community owned and managed by Kailuan Group. There are 11 hospitals responsible for the health care of the community. From June 2006 to September 2007 and June 2008 to September 2009, the Tangshan Kailuan Company sponsored two health examination studies for all 126,847 employees. The participants met the following criteria: age ≥18 years; provided informed consent; and updating their health status every 2 years according to the follow-up protocol until December 2014. Among these subjects, we excluded patients who had incomplete medical history (n = 2911), who were pregnant (n = 109), or who had a history of cancer (n = 443). A total of 123,384 employees (98,637 males and 24,747 females) were identified who met inclusion criteria. Then, we followed these participants above from the baseline examination that were included between June 2006 and September 2007 or between June 2008 and September 2009 through December 31, 2014, or to the data of death or otherwise lost to follow-up. The diagnosis of all-cause death was determined and recorded. Information on death was collected from death certificates from state vital statistics offices. All participants underwent questionnaire assessment, clinical examination, and laboratory assessment. Data for the employees aged 18 to 98 years (50.6 ± 12.86) were analyzed.
Standard protocols were used in all the physical examination measurements, which were performed by specially trained doctors and nurses. The study was performed according to the guidelines of Helsinki Declaration and was approved jointly by the Ethics Committee of the Kailuan General Hospital, Beijing Chaoyang Hospital. Written informed consent was obtained from all participants.
2.2. Questionnaire assessment
Questionnaires were administered by research doctors in person. Demographic and socioeconomic data as well as medical history including alcohol consumption, smoking status, and physical activity were obtained. Smoking status was classified using selfreported information as “never,” “former,” “current,” or “daily.” Physical activity was evaluated from responses to questions about the frequency of physical activity at work and during leisure time. Individuals were classified as “very active (≥80 min/week),” “moderately active (1–79 min/week),” or “inactive (0 min/week).” A history of stroke, MI, or tumor was defined as any self-reported previous physician diagnosis of stroke, MI, or tumor. Alcohol consumption was defined as a daily consumption of at least 100 mL of moderate pure alcohol (≥50%) per day in the recent year.
2.3. Anthropometric measurements
Height was measured to the nearest 0.1 cm using a portable stadiometer and weight was measured to the nearest 0.1 kg using calibrated platform scales. All the individuals were measured while they were wearing light clothing without shoes and hats. BMI was calculated as body weight (kg) divided by the square of height (m2). According to Chinese guidelines for overweight and obesity, the BMI criteria (<18.5, 18.5–<24.0, 24.0–<28.0, ≥28.0 kg/m2) was used to classify individuals as underweight, normal, overweight, and obese, respectively.[ 11 12]
2.4. Clinical measurements
Blood samples were obtained from the antecubital vein and transfused into vacuum tubes containing ethylenediaminetetraacetic acid in the morning after an overnight fasting period. Tubes were centrifuged at 3000g for 10 minutes at room temperature. After separation, plasma samples were used within 4 hours. Fasting blood glucose (FBG) was measured with the hexokinase/glucose-6-phosphate dehydrogenase method. Total cholesterol (TC), high-density lipoprotein cholesterol (HDL-C), and low-density lipoprotein cholesterol (LDL-C) were measured by an enzymatic method (Mind Bioengineering Co. Ltd, Shanghai, China; interassay coefficient of variation <10%). All the blood variables were measured using an autoanalyzer (Hitachi 747; Hitachi, Tokyo, Japan) at the central laboratory of the Kailuan General hospital.
2.5. Statistical analyses
Statistical analyses were performed using SPSS 13.0 (SPSS Inc, Chicago, IL). Continuous data were expressed as mean ± standard deviation and compared using Student t test. Enumeration data were expressed as a percentage. Categorical variables were described by percentages and compared using the χ 2 method. The cumulative all-cause mortality was calculated using the Kaplan-Meier method, and the difference in cumulative hazard risks was compared using the Log-Rank test. Cox proportional hazard models were used for multivariate analyses of all-cause mortality. All statistical tests were 2-sided, and P < 0.05 was accepted as statistically significant. Natural cubic spline functions were used to model the association between BMI and all-cause mortality.
3. Results
3.1. Clinical characteristics
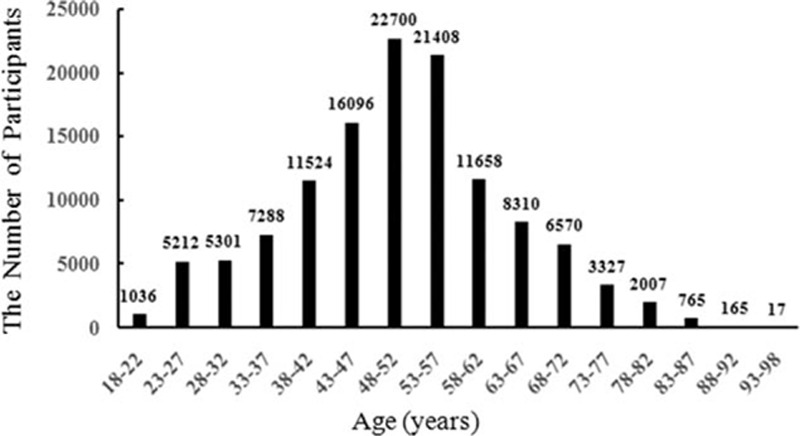
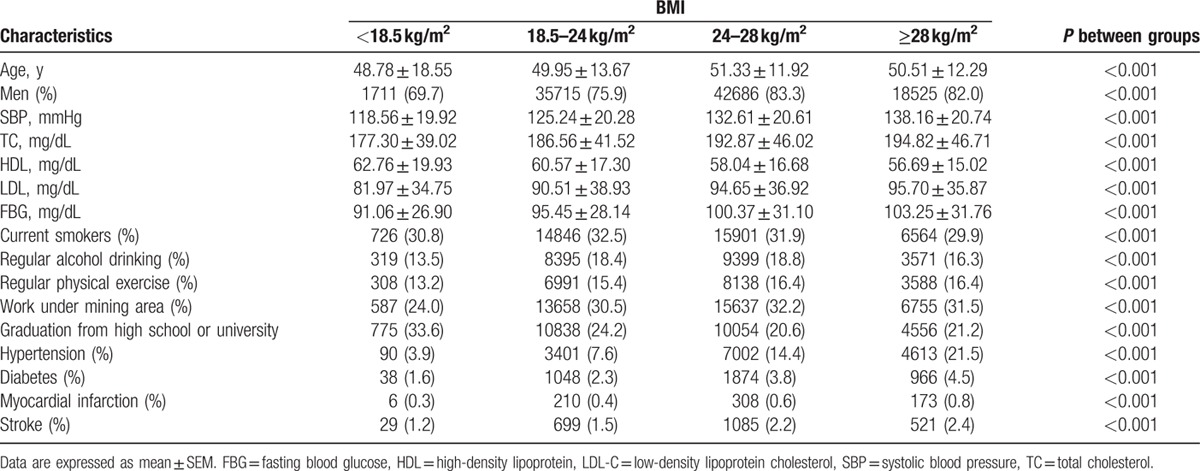
After exclusion, analyses were confined to the 123,384 participants (97.27% of the original cohort), which included 98,637 men and 24,747 women. The age of employees was between 18 and 98 (mean of 50.6 ± 12.86) years. Figure 1 shows the age distribution of study subjects by 5-year group. Additionally, those subjects older than 60 years are retire. Table 1 shows the baseline characteristics of the participants. Baseline BMI was stratified into 4 categories, with cutoff points at 18.5, 24, and 28 kg/m2. For all participants, BMI strongly correlated with a history of hypertension, diabetes, MI, and stroke, for all BMI categories, except for the overweight group (BMI ≥28 kg/m2). There were significant differences in age, percentage of male, the level of TC/HDL-C/LDL-C/FBG, history of smoking, history of drinking, exercise, working environment, and education among 4 categories with different BMI (Table 1).
Figure 1.

The age distribution of study subjects by 5-year group.
Table 1.
Baseline characteristics of the Kailuan Community Cohort by BMI categories.

3.2. Association between BMI and all-cause mortality
For all participants, the mean follow-up time was 7.39 years. During this period, there were 6218 deaths, which included 5770 men and 448 women. The all-cause mortality varied substantially among the 4 BMI categories. The numbers of deaths were 226, 2447, 2455, and 1090, with rates of death from all causes at 9.2%, 5.2%, 4.8%, and 4.8%, according to different BMI categories, respectively. For each category, male deaths numbered 218, 2279, 2283, and 990 with all-cause mortality rates of 12.7%, 6.4%, 4.1%, and 5.3%, respectively. Female deaths numbered 8, 168, 172, and 100, with all-cause mortality rates of 0.9%, 1.5%, 2%, and 2.5%, according to the different BMI categories, respectively (Fig. 2).
Figure 2.

Kaplan–Meier survival curves of participants.
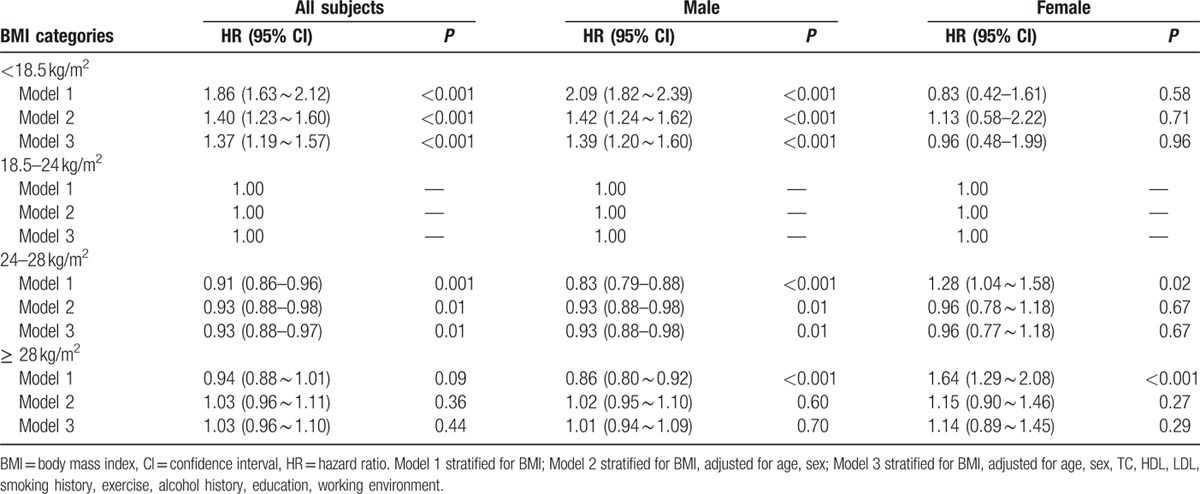
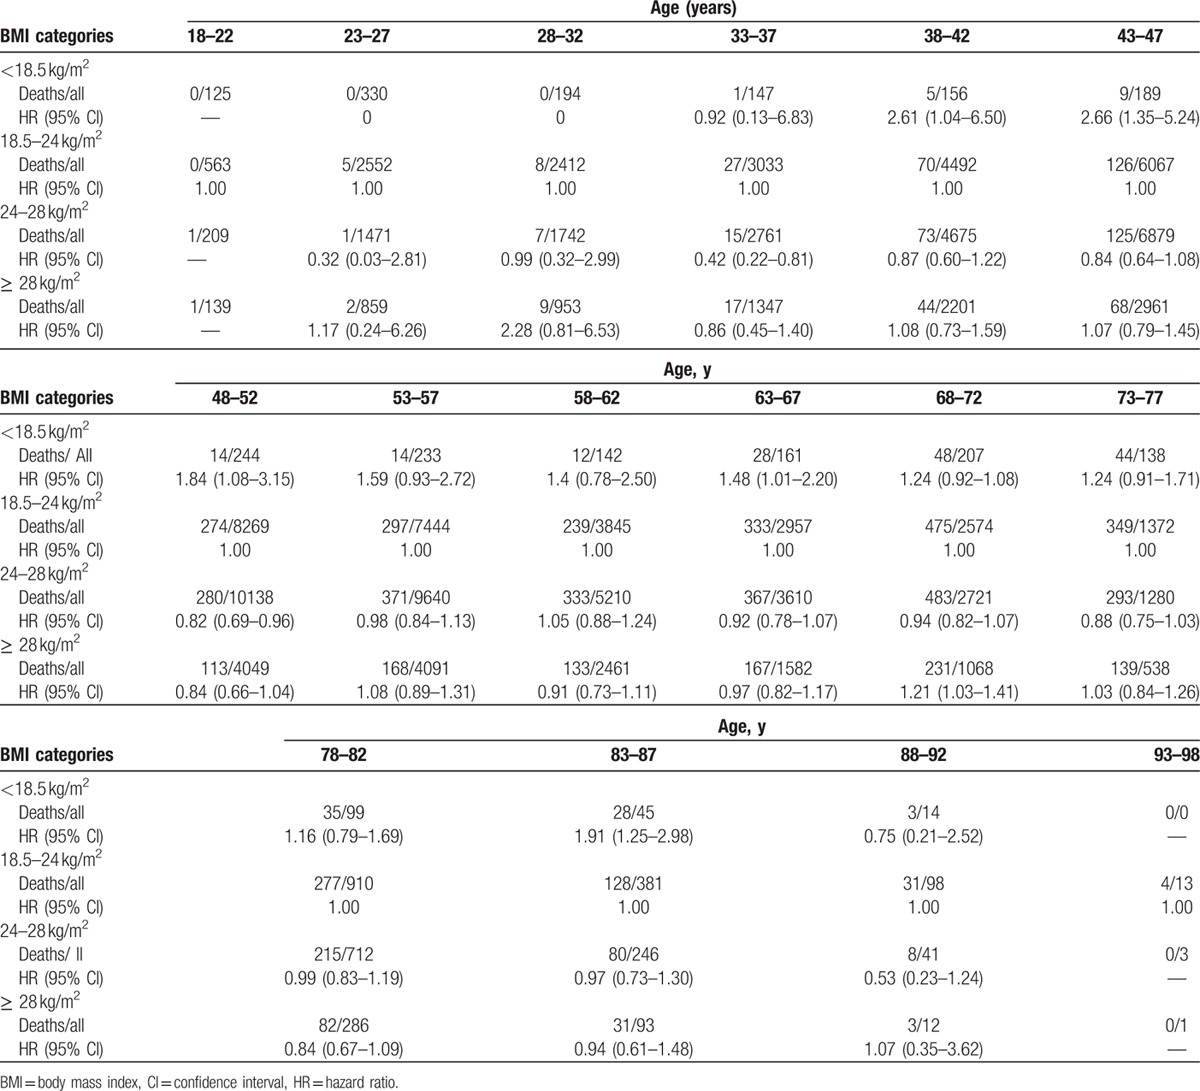
Using proportional hazards (Cox) regression analysis, hazard ratios (HRs) of all-cause mortality in underweight, overweight, and obesity were 1.37 (1.19–1.57), 0.93 (0.88–0.97), and 1.03 (0.96–1.10), respectively. The trend of HR values was similar in male. However, HR values of the all-cause mortality in underweight, overweight, and obesity were 0.96 (0.48–1.99), 0.96 (0.77–1.18), and 1.14 (0.89–1.45), respectively, relative to normal weight in female. However, examining BMI as a continuous variable, there was a U-shaped association between BMI and the risk of all-cause mortality among general participants, men and women, even after adjusting for age, level of triglyceride, HDL and LDL-C, history of smoking and drinking, level of physical activity, medical history of hypertension, diabetes mellitus, MI, and stroke (Table 2 and Fig. 3). The association of BMI with all-cause mortality was similar when analyses were repeated stratifying by age and chronic diseases including hypertension, diabetes mellitus, MI, or stroke (Tables 3 and 4). The results of our sensitivity analysis confirmed these findings (Supplemental Table).
Table 2.
Hazard ration of all-cause mortality based on the BMI categories.

Figure 3.

Association between body mass index (BMI) and all-cause mortality.
Table 3.
The confounding effect of age on the relationship of BMI and all-cause mortality.

Table 4.
The confounding effect of chronic diseases on the relationship of BMI and all-cause mortality.

4. Discussion
The aim of this large prospective study was to examine the association between BMI and all-cause mortality to guide public health recommendations. We observed markedly greater mortality rates in the group with the lowest BMI. After adjusting for other risk factors (e.g., hypertension, diabetes, coronary heart disease, and stroke), we observed an increased risk in all-cause mortality for individuals with a BMI <18.5 (HR 1.46; 95% confidence interval 1.273–1.684). This finding is extremely significant because the risk of death was higher among adult Chinese people in Kailuan Community with lower BMI, which is most meaningful for epidemiologic research on body weight and mortality.
A relationship between obesity and chronic disease is well established. [13] Adipose tissue can be considered as an active endocrine organ, releasing a large number of cytokines and bioactive mediators, which contribute to the pathogenesis of many obesity-related diseases. [14] However, there is also increased mortality associated with low BMI, as observed in our study as well as others, [15] with the highest risk of death seen in those with a BMI of ≤15.0. [15] Thus, these observations raise an important question of why the excess risk of death was associated with a low BMI.
The term “obesity paradox” has been an emerging concept based on a survival benefit of obese patients in MI or congestive heart failure. [9] It has also been suggested that obese men with chronic diseases live longer than men of normal weight. [10] Better and more aggressive medical care and enhanced observation could in part explain the low risk of mortality in the persons with a high BMI. [10] Therefore, BMI may not accurately reflect the risk of complications in all individuals. [16] A few cohort studies have shown that even among nonobese persons with a low BMI, an increased waist circumference or waist–hip ratio (as an indicator of abdominal adiposity) was linked to a significantly increase in mortality in populations.[ 17 18] This indicates that the observed excess mortality risk among lean populations with a low BMI may be because, partly, of abdominal adiposity, which cannot be assessed fully with BMI. [19] In addition, another influence of adverse causation may remain in our present study, particularly since we did not have enough information on the low standard of living condition and the presence of infections, [20] which may contribute to undernutrition and increase the risk of premature death.
In this study, we exposed an increased risk for all-cause mortality in males with a low BMI. In contrast, this phenomenon does not exist in female patients. Several explanations may be proposed to account for this sex differential in mortality. First, smoking and regular alcohol consumption are the most common risk factors for death in men, whereas psychological distress, role pressure, and less strenuous exercise are more characteristic of women.[ 21 22] Thus, we hypothesized that the factors affecting the association between BMI and all-cause mortality would be different in men and women. However, the sex differential in all-cause mortality related to BMI may be owing to several other variables between the sexes, such as hormonal balance, environment, or inherent biological factors.[ 23 24] In general, women are thought to be “more fit” biologically than men, as men often behave in ways much damaging to health. Several previous studies also suggested that biological and behavioral risk factors influence the sex differences in the risk of death.[ 25 26] Despite all the considerations above, it is necessary to determine the cause of the sex differences in all-cause mortality related to BMI in the future study.
A U-shaped association between BMI and the risk of all-cause mortality was observed in our present study, which was consistent with the results of several large cohort studies.[ 15 27] The risk of death was higher among people with BMIs in the lower and upper categories than among those with BMIs in the middle category. A BMI of 24.0 to 28.0 (mean 26.0) among men was associated with the lowest risk of death. Although all-cause mortality was not lowest in the group with a BMI of 24.0 to 28.0 in women, the risk of death was higher than the group with a BMI of 18.5 to 24.0 or ≥28. The findings from our primary analysis do not support the use of a lower BMI cutoff value for overweight and obesity in the adult Chinese population, which contributes to the science behind public health considerations on the appropriate and optimal range of relative weight in some Chinese populations.
The present study has some limitations. First, there is a significant difference in sex distribution (79.8% men vs. 20.2% women in the current cohort). We cannot exclude the possibility of selection bias in the present study. Second, we did not collect BMI at the time of last follow-up visit. Thus, we could not examine changes in BMI over time or determine the relationship between BMI change and mortality. Third, the possibility of confounding of other chronic health conditions (e.g., chronic obstructive pulmonary disease) could not be excluded, although we had adjusted for several variables such as hypertension, diabetes mellitus, coronary heart disease, and stroke, which may minimize the effect of potential confounders. Finally, BMI has been shown to be valid in a number of populations, [28] yet the error of height and weight measurement may have possible influences on the results. Furthermore, other measures of body habitus such as waist–hip ratio or waist circumference could complement BMI in the subjects, which may contribute further to our understanding.
Our study applied the definition of ideal BMI of 24.0 to 28.0 (mean 26.0) to the Kailuan cohort and revealed a U-shaped association between BMI and all-cause mortality. Thus, both obesity and underweight were related to an increase in all-cause mortality among adult Chinese people in the Kailuan cohort. Further, Obesity may have a different influence on all-cause mortality in both sexes. Our findings may have important clinical implications regarding public health considerations on the appropriate and optimal range of relative weight in some Chinese populations, which support the argument for a single recommended range of BMI values. The sex features need to be taken into consideration in future studies.
Supplementary Material
Footnotes
Abbreviations: BMI = body mass index, FBG = fasting blood glucose, HDL-C = high-density lipoprotein cholesterol, LDL-C = low-density lipoprotein cholesterol, TC = total cholesterol.
HS, XR, and ZC contributed equally to this work.
The authors report no conflicts of interest.
Supplemental Digital Content is available for this article.
References
- 1. Whitlock G, Lewington S, Sherliker P, et al. Body-mass index and cause-specific mortality in 900 000 adults: collaborative analyses of prospective studies. Lancet 2009; 373:1083–1096. [DOI] [PMC free article] [PubMed] [Google Scholar]
- 2. Finucane MM, Stevens GA, Cowan MJ, et al. National, regional, and global trends in body-mass index since 1980: systematic analysis of health examination surveys and epidemiological studies with 960 country-years and 9.1 million participants. Lancet 2011; 377:557–567. [DOI] [PMC free article] [PubMed] [Google Scholar]
- 3. Xi B, Liang Y, He T, et al. Secular trends in the prevalence of general and abdominal obesity among Chinese adults, 1993-2009. Obes Rev 2012; 13:287–296. [DOI] [PMC free article] [PubMed] [Google Scholar]
- 4. Grover SA, Kaouache M, Rempel P, et al. Years of life lost and healthy life-years lost from diabetes and cardiovascular disease in overweight and obese people: a modelling study. Lancet Diabetes Endocrinol 2015; 3:114–122. [DOI] [PubMed] [Google Scholar]
- 5. Lim SS, Vos T, Flaxman AD, et al. A comparative risk assessment of burden of disease and injury attributable to 67 risk factors and risk factor clusters in 21 regions, 1990-2010: a systematic analysis for the Global Burden of Disease Study 2010. Lancet 2012; 380:2224–2260. [DOI] [PMC free article] [PubMed] [Google Scholar]
- 6. Stamler R, Ford CE, Stamler J. Why do lean hypertensives have higher mortality rates than other hypertensives? Findings of the Hypertension Detection and Follow-up Program. Hypertension 1991; 17:553–564. [DOI] [PubMed] [Google Scholar]
- 7. Costanzo P, Cleland JG, Pellicori P, et al. The obesity paradox in type 2 diabetes mellitus: relationship of body mass index to prognosis: a cohort study. Ann Intern Med 2015; 162:610–618. [DOI] [PubMed] [Google Scholar]
- 8. Andersen KK, Olsen TS. The obesity paradox in stroke: lower mortality and lower risk of readmission for recurrent stroke in obese stroke patients. Int J Stroke 2015; 10:99–104. [DOI] [PubMed] [Google Scholar]
- 9. Curtis JP, Selter JG, Wang Y, et al. The obesity paradox: body mass index and outcomes in patients with heart failure. Arch Intern Med 2005; 165:55–61. [DOI] [PubMed] [Google Scholar]
- 10. Amundson DE, Djurkovic S, Matwiyoff GN. The obesity paradox. Crit Care Clin 2010; 26:583–596. [DOI] [PubMed] [Google Scholar]
- 11. National Health and Family Planning Commission of the People's Republic of China: Beijing, National Health, Family Planning Commission of the People's Republic of China Health Standard of the People's Republic of China. No. WS/T 428-2013: Criteria of Weight for Adults. 2013. http://www.moh.gov.cn/zwgkzt/yingyang/201308/a233d450fdbc47c5ad4f08b7e394d1e8.shtml [Google Scholar]
- 12. Stern D, Smith LP, Zhang B, et al. Changes in waist circumference relative to body mass index in Chinese adults, 1993-2009. Int J Obes (Lond) 2014; 38:1503–1510. [DOI] [PMC free article] [PubMed] [Google Scholar]
- 13. Haslam DW, James WP. Obesity. Lancet 2005; 366:1197–1209. [DOI] [PubMed] [Google Scholar]
- 14. Van Gaal LF, Mertens IL, De Block CE. Mechanisms linking obesity with cardiovascular disease. Nature 2006; 444:875–880. [DOI] [PubMed] [Google Scholar]
- 15. Zheng W, McLerran DF, Rolland B, et al. Association between body-mass index and risk of death in more than 1 million Asians. N Engl J Med 2011; 364:719–729. [DOI] [PMC free article] [PubMed] [Google Scholar]
- 16. Price GM, Uauy R, Breeze E, et al. Weight, shape, and mortality risk in older persons: elevated waist-hip ratio, not high body mass index, is associated with a greater risk of death. Am J Clin Nutr 2006; 84:449–460. [DOI] [PubMed] [Google Scholar]
- 17. Pischon T, Boeing H, Hoffmann K, et al. General and abdominal adiposity and risk of death in Europe. N Engl J Med 2008; 359:2105–2120. [DOI] [PubMed] [Google Scholar]
- 18. Zhang X, Shu XO, Yang G, et al. Abdominal adiposity and mortality in Chinese women. Arch Intern Med 2007; 167:886–892. [DOI] [PubMed] [Google Scholar]
- 19. Allison DB, Faith MS, Heo M, et al. Hypothesis concerning the U-shaped relation between body mass index and mortality. Am J Epidemiol 1997; 146:339–349. [DOI] [PubMed] [Google Scholar]
- 20. Lopez-Jimenez F. Speakable and unspeakable facts about BMI and mortality. Lancet 2009; 373:1055–1056. [DOI] [PubMed] [Google Scholar]
- 21. Chen CA, Liao SC, Wang JK, et al. Quality of life in adults with congenital heart disease: biopsychosocial determinants and sex-related differences. Heart 2011; 97:38–43. [DOI] [PubMed] [Google Scholar]
- 22. Dueñas M, Ramirez C, Arana R, et al. Gender differences and determinants of health related quality of life in coronary patients: a follow-up study. BMC Cardiovasc Disord 2011; 11:24. [DOI] [PMC free article] [PubMed] [Google Scholar]
- 23. Cho HJ, Khang YH, Yang S, et al. Socioeconomic differentials in cause-specific mortality among South Korean adolescents. Int J Epidemiol 2007; 36:50–57. [DOI] [PubMed] [Google Scholar]
- 24. Janghorbani M, Hedley AJ, Jones RB, et al. Gender differential in all-cause and cardiovascular disease mortality. Int J Epidemiol 1993; 22:1056–1063. [DOI] [PubMed] [Google Scholar]
- 25. Luy M, Gast K. Do women live longer or do men die earlier? Reflections on the causes of sex differences in life expectancy. Gerontology 2014; 60:143–153. [DOI] [PubMed] [Google Scholar]
- 26. Staetsky L. The role of smoking in the explanation of the Israeli Jewish pattern of sex differentials in mortality. Popul Stud (Camb) 2011; 65:231–244. [DOI] [PubMed] [Google Scholar]
- 27. Lin WY, Tsai SL, Albu JB, et al. Body mass index and all-cause mortality in a large Chinese cohort. CMAJ 2011; 183:E329–E336. [DOI] [PMC free article] [PubMed] [Google Scholar]
- 28. de Mutsert R, Sun Q, Willett WC, et al. Overweight in early adulthood, adult weight change, and risk of type 2 diabetes, cardiovascular diseases, and certain cancers in men: a cohort study. Am J Epidemiol 2014; 179:1353–1365. [DOI] [PMC free article] [PubMed] [Google Scholar]
Associated Data
This section collects any data citations, data availability statements, or supplementary materials included in this article.


