Abstract
The aim of this study was to investigate the role of microflow imaging (MFI) of contrast-enhanced ultrasound (CEUS) for evaluating microvascular architecture of different types of peripheral lung cancer (PLC) and to explore the correlated pathological basis.
Ninety-five patients with PLC were enrolled in this study. Two radiologists independently evaluated the microvascular architecture of PLC with MFI. The interobserver agreement was measured with Kappa test. The diagnosis value of MFI was calculated. With pathological analysis, the correlation between MFI and microvascular density (MVD)/microvascular diameter (MD) was evaluated.
Of the 95 PLCs, MFI were mainly classified “dead wood” (27.4%, 25.3%), “vascular” (47.4%, 49.5%), and “cotton” (20.0%, 20.0%) patterns by the 2 readers. Kappa test showed a good agreement between the 2 readers (Kappa = 0.758). The “dead wood” can be regarded as a specific diagnostic factor for squamous carcinoma; the sensitivity, specificity, and accuracy was 62.9%, 93.3%, and 82.1%, respectively. The “vascular” and “cotton” patterns correlated well with adenocarcinoma and SCLC (small cell lung cancer); diagnostic sensitivity, specificity, and accuracy were 86.7%, 65.7%, and 78.9%, respectively. MVD of “dead wood” was lower than “vascular” and “cotton,” while MD was bigger than the other 2 patterns (P < 0.05). There was a good correlation between MFI and histopathological types of PLC as well as between MFI and MVD/MD (P < 0.05).
MFI has the advantage to display the microvascular architecture of PLCs and might become a promising diagnostic method of histopathological types of PLC. MFI features also correlated well with its pathological basis, including MVD and MD.
Keywords: contrast ultrasonography, diagnostic imaging, lung cancer, microvascular
1. Introduction
Lung cancer is one of the most common malignancies worldwide, and its incidence is increasing annually, especially in China. [1] A large number of lung nodules remains undetermined after bronchoscopy, radiological imaging analysis. [2] Ultrasound can contribute to the determination of the nature of peripheral lung tumors, serving as an important aid in decision-making.[ 3 4] However, transcutaneous ultrasound enables visualization of pleural-based lesions but with a poor correlation to specific pathology. Contrast-enhanced ultrasound (CEUS) could provide more information of blood perfusion in tumors than gray scale ultrasound. It might present a possibility for improving diagnosis of PLCs with the development of CEUS. The result could be similar with computed tomography (CT). [5] So far, the enhancement patterns and parameters of CEUS in lung lesions have drawn more and more attention in the clinic. [6] Particularly, the blood supply of lung malignant tumor was important but disputable. [7 8 9] Thus, a more visualized and stabilized method to evaluate the neovascularization needs to be evaluated.
Microflow imaging (MFI) technique, a new method of CEUS, could be used for evaluating the neovascularization of tumors.[ 10 11] The principle is that ultrasonography system started the maximum-holding imaging processing to trace the position of the moving bubbles with high sensitivity after contrast agent injected in the cardiovascular system. Then, a trace of microbubbles in a temporal dimension can be clearly depicted. It reflects the tumorous microvascular architecture in the scanning area. [12] On the basis of accumulation effect, MFI has a stronger signal at visualizing microvascular architecture in the lesion than conventional contrast images, even though the number of microbubbles in these vessels is very small, or flow is very slow. [13]
To our knowledge, it is the first study to apply this new technique of CEUS to the assessment of neovascularization of PLCs. In the present study, we aim to evaluate the role of MFI for the distinction of common histopathological types of PLC and to explore the correlation between pathological basis and the microvascular patterns, in order to provide more information for the further diagnosis and therapy.
2. Methods
2.1. Subjects and methods
This study was approved by the ethics committee of Peking University Cancer Hospital and Institute, and written informed consent was obtained from each patient before the CEUS and MFI examination.
2.2. Patient population
From January 2011 to May 2014, 205 consecutive patients with peripheral lung lesions displayed with conventional ultrasound performed CEUS and MFI examination in our department; all of them had undergone chest CT before these examinations. Among them, 95 patients had final diagnosis as primary peripheral lung cancers by pathology results and enrolled in this study. All the 95 histopathologic results were obtained by ultrasound-guided transthoracic biopsy. Among them, 59 were males and 36 were females; their age ranged from 21 to 79 years (mean age 62.7 ± 11.4 years). The size of tumors ranged from 1.7 to 13.8 cm (mean size 6.2 ± 2.6 cm). Pathologic analysis revealed that 35 patients were squamous cell carcinomas, 45 were adenocarcinomas, and the rest 15 were SCLCs. The baseline characteristics of these patients are summarized in Table 1.
Table 1.
Baseline characteristics of 95 cases.

2.3. Contrast agent and sonography procedures
The sonography contrast agent used was SonoVue (Bracco, Italy), supplied as a lyophilized powder and reconstituted with 5 mL of saline to form a homogeneous microbubble suspension that contained 8 μL/mL of sulfur hexafluoride stabilized by a phospholipid shell. The mean microbubble diameter was 2.5 μm with a pH value of 4.5 to 7.5. SonoVue was administered intravenously (IV) as 2.4 mL boluses through the antecubital vein in 2 to 3 seconds. The CEUS equipment used was a Logiq E9 sonography system (GE Healthcare, Chicago, IL, USA) with real-time gray-scale contrast tuned imaging and a 3.0 to 5.0 MHz C1–5 probe (GE Healthcare, Chicago, IL, USA).
With the reference of chest CT before the examination, a dynamic CEUS was performed after the lesion was identified. The focus depth was beyond the region of interest. The mechanical index (MI) was adjusted to about 0.11 to 0.13. The region of interest was continuously observed over 5 minutes from the time of injection. The dynamic image was recorded on the local disk of the sonography machine.
2.4. Sequence and analysis for MFI
MFI was performed and analyzed offline on the local disk. The clip was played frame by frame. The maximum intensity-holding sequence was started using the following settings: accumulation at 1.6; dynamic range at 36 dB. The accumulation time for each MFI sequence was 10 to 15 seconds, depending on the perfusion of the target tissue. This modification could maintain the maximum brightness on each pixel and be demonstrated as a consistent vision. The schematic illustration of MFI is shown in Fig. 1.
Figure 1.

A schematic illustration of MFI. A, Conventional CEUS of pulmonary lesion showed a heterogeneous enhancement at 13 s after injection of SonoVue; the tumorous blood vessels were not clearly identified (Arrow). B, MFI sequence of the same lesion. The visualization of small blood vessels is significantly improved (Arrow). C, Time intensity curve could visually display the principle of maximum intensity holding. Signals of microbubble are accumulated with the maximum intensity holding technique, and each frame includes the information between arrival times to this moment (Arrow). CEUS = contrast-enhanced ultrasound, MFI = microflow imaging.
Each MFI of lung cancers was evaluated at least 3 times to finding the most visualized tumorous microvascular architecture, and then the result was recorded.
Two independent readers retrospectively reviewed the digital video stored on the local disk. They were not involved in the US and CEUS examinations. Cine clips were presented in a random order, and any identifying information was masked. Before the reading, the readers were shown 9 similar examples of MFI (3 for each pattern) to establish a standardized approach to the interpretation of the information provided in the imaging finding. The 2 independent readers were requested to classify each MFI into 1 of the following 4 patterns: “dead wood” pattern, “vascular” pattern, “cotton” pattern, and undefined pattern. In “dead wood” pattern (Fig. 2), the branch of vessels was suddenly interrupted and necrosis was commonly shown in this pattern. Also, the distribution of vessels was inhomogeneous. In “vascular” pattern (Fig. 3), tortuous and meandering tumorous blood vessels were filled with the whole lesion and inner necrosis was rarely shown in this pattern. The vascular distribution was homogeneous. In “cotton” pattern (Fig. 4), necrosis was rarely shown in this pattern. The tumorous blood vessels were not poorly defined and its distribution was intensive, which were presenting a cotton-like shape. If the characteristics of tumorous vessels could not be identified as 1 of the 3 types above, it belonged to other pattern.
Figure 2.
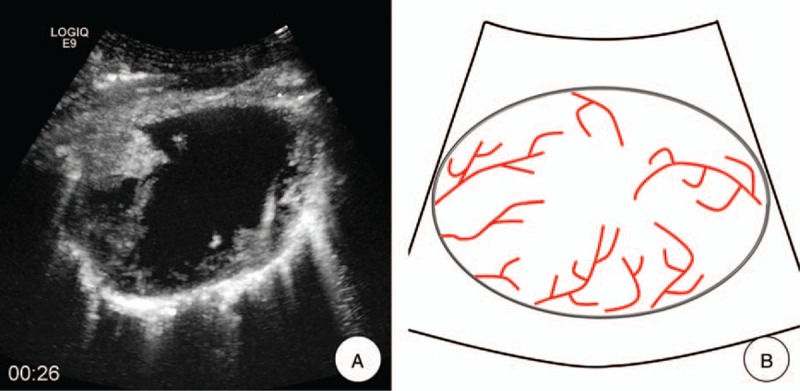
Dead wood pattern. A, MFI showed the “dead wood” pattern, which meant that the microvessels in lung cancer were visualized clearly at arterial phase, but they gradually tapered off and were interrupted suddenly with a large area of necrosis. B, A schematic illustration of “dead wood” pattern in MFI. CEUS = contrast-enhanced ultrasound, MFI = microflow imaging.
Figure 3.
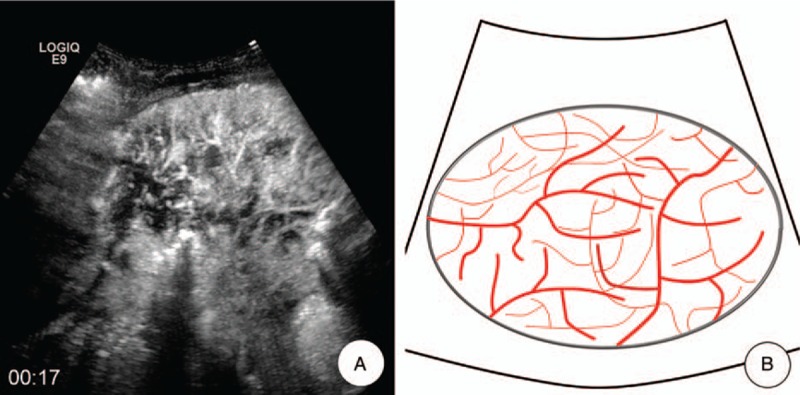
Vascular pattern. A, MFI showed the “vascular” pattern, which meant that tortuous and meandering tumorous blood vessels were visualized clearly, and the vascular distribution was homogeneous. B, A schematic illustration of “vascular” pattern in MFI of CEUS. CEUS = contrast-enhanced ultrasound, MFI = microflow imaging.
Figure 4.
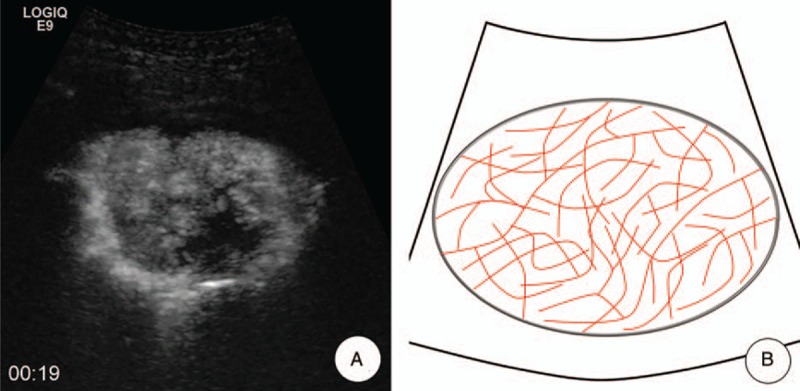
Cotton pattern. A, MFI showed the “cotton” pattern, which meant that tumorous blood vessels distributed intensively were presenting a cotton-like shape and had poor defined margin. B, A schematic illustration of “cotton” pattern in MFI of CEUS. CEUS = contrast-enhanced ultrasound, MFI = microflow imaging.
Two radiologists (YW and ZH) from our institution blindly reviewed all of the MFI examination in this study. Each sonographer had at least 5 years of experience in diagnosing lung disease using CEUS. They were aware of the patients’ clinical histories and were blinded to the identification, biopsy results, and other imaging findings of the patients.
2.5. Calculation of diagnostic rates
On the basis of the pathological diagnosis, the diagnostic capability of the microvascular pattern was analyzed. The final microvascular pattern for each case was made by the consensus of the 2 readers. Sensitivity was defined as TP/(TP + FN), specificity as TN/(FP + TN), and overall accuracy as (TP + TN)/(TP + TN + FP + FN), positive predictive value (+PV) as TP/(TP + FP), negative predictive value (-PV) as TN/(FN + TN), where TP is the number of true positive diagnoses, FN is the number of false-negative diagnoses, TN is the number of true negative diagnoses, and FP is the number of false-positive diagnoses.
2.6. Histopathological analysis
A biopsy was performed using 18-gauge automatic cutting needle (BARD Magnum, BARD Inc, Tempe, AZ, USA) after CEUS in less than 2 days. The target of biopsy was the most enhanced areas of tumor on CEUS. After careful planning, the skin was sterilized, and local anesthetic was applied using 2% lidocaine (Liduokayin; Yimin, Beijing, China). After the probe was fixed and the guiding needle was inserted into the chest wall, the biopsy needle reached to the target area of lesions for biopsy. Patients were told to hold their breath during the puncture. The whole biopsy procedure was continuously monitored using conventional sonography. The specimens obtained during the biopsy were fixed in 10% formalin for histopathological diagnosis. Immunohistochemistry was performed using antibodies to CD34 (Dako, Glostrup, Denmark), a marker of tumor microvascular, [14] to detect microvascular density and diameter, using previously described techniques. [15] Stained slides were imaged and analyzed by using a microscope (Olympus BX43; Olympus, Tokyo, Japan) with imaging software (Micron, Westover Scientific, Mill Creek, WA, USA). Quantitative analysis was performed by using 2 metrics: the average diameter of the MD and the average density of MVD. Five most vascular areas (i.e., hot spots) with the highest numbers of microvessel profiles were chosen respectively from each sample under a low-power lens (×100), and then MD and MVD were counted in 5 random high-power (×400) fields within the defined zone. The accuracy of the final data was verified by the senior pathological doctor (Sun Y).
2.7. Statistical analysis
All the patients’ information, pathological diagnosis, MFI, MVD, and MD results in this study were transferred to Microsoft Excel 2010 for analysis. The database is only freely available for the doctors in our department in order to keep privacy. All analyses were performed using SPSS 21.0 statistical analysis software (SPSS, Chicago, IL, USA). Enumeration data were given as mean ± SD and were analyzed with an unpaired t test. Categorical variables were analyzed with Pearson χ2 or Fisher exact tests. Kappa test was used to measure the actual agreement between the 2 readers. P < 0.05 was considered statistically significant.
3. Results
3.1. Blinded reading of MFI
The classification results of 4 MFI patterns of lung cancers by the 2 readers were “dead wood” patterns (27.4% and 25.3%, respectively), “vascular” patterns (47.4% and 49.5%, respectively), “cotton” patterns (20.0% and 20.0%, respectively), and undefined patterns (5.3% and 5.3%, respectively). In addition, the Kappa test showed a good concordance between the 2 readers (Kappa = 0.758, P = 0.000). The MFI pattern results are summarized in Table 2.
Table 2.
MFI patterns of lung cancer by 2 readers, n (%).

With both Reader-1 (Table 3) and Reader-2 (Table 4), the number of “dead wood” pattern in squamous cell carcinoma was higher than that in adenocarcinoma and SCLC (χ2 = 33.654, P = 0.000 and χ2 = 35.252, P = 0.000, respectively). Meanwhile, the number of “vascular” pattern and “cotton” pattern in adenocarcinoma and SCLC were higher than that in squamous cell carcinoma (χ2 = 15.380, P = 0.001, and χ2 = 17.151, P = 0.000, respectively). In addition, there were 5 patients included 1 squamous cell carcinoma, 3 adenocarcinomas, and 1 SCLC were classified into the other pattern.
Table 3.
MFI patterns of lung cancer correlation to histopathology types (reader 1), n (%).

Table 4.
MFI patterns of lung cancer correlation to histopathology types (reader 2), n (%).

3.2. Diagnostic value of MFI
In 95 lung cancers, 90 (94.7%) were identified with a typical malignant microvascular pattern by MFI analysis. Further evaluation with pathological results, we found that the MFI feature also had a good correlation with histopathological types. The MFI of squamous cell carcinoma was associated with “dead wood” pattern; meanwhile, the MFI of adenocarcinoma and SCLC was associated with “vascular” pattern and “cotton” pattern. The relationship between MFI patterns and histopathology types of lung cancer is summarized in Table 5 and Fig. 5.
Table 5.
Estimates of MFI pattern detection rate with histopathology type (n).

Figure 5.
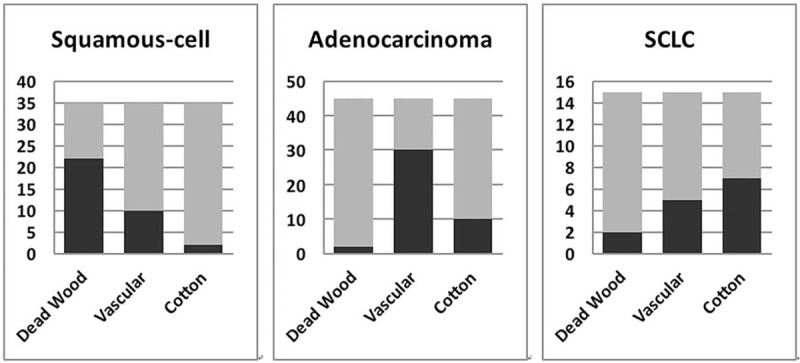
The correlation between micoflow patters and pathological finding. MFI feature had a good correlation with histopathological types. The MFI of squamous cell carcinoma was associated with “dead wood” pattern; MFI of adenocarcinoma and SCLC was associated with “vascular” pattern and “cotton” pattern. MFI = microflow imaging, SCLC = small cell lung cancer.
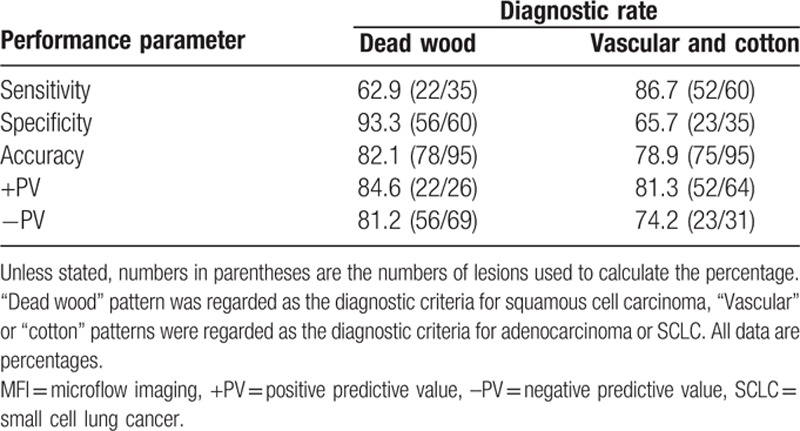
If “dead wood” pattern was regarded as the diagnostic criteria for lung squamous cell carcinoma, its diagnostic sensitivity, specificity, accuracy, positive predictive value, and negative predictive value were 62.9% (22/35), 93.3% (56/60), 82.1% (78/95), 84.6% (22/26), and 81.2% (56/69), respectively. On the contrary, if the “vascular” pattern and “cotton” pattern were regarded as the diagnostic criteria for lung adenocarcinoma and SCLC, the diagnostic sensitivity, specificity, accuracy, positive predictive value, and negative predictive value were 86.7% (52/60), 65.7% (23/35), 78.9% (75/95), 81.3% (52/64), and 74.2% (23/31), respectively. The diagnosis results are summarized in Table 6.
Table 6.
Diagnostic performance of MFI at retrospective analysis.
3.3. Microvascular pathological results
The results of CD34 staining showed that MVD of “dead wood” pattern was significantly lower than that of “vascular” pattern and “cotton” pattern (P = 0.002, P = 0.014). On the contrary, MD of “dead wood” pattern was significantly bigger than that of “vascular” pattern and “cotton” pattern (P = 0.001, P = 0.000) (Figs. 6 and 7). The result also showed that the MD of “vascular” pattern was bigger than that of “cotton” pattern (P = 0.033). MVD of “vascular” pattern was slightly lower than that of “cotton” pattern, but there was no significant difference between the 2 patterns (P = 0.396). There was a good correlation between MFI and PLCs, including MVD (r = 0.668, P < 0.001) and MD (r = -0.673, P < 0.001). The pathologic analysis result is summarized in Table 7 and Fig. 8.
Figure 6.
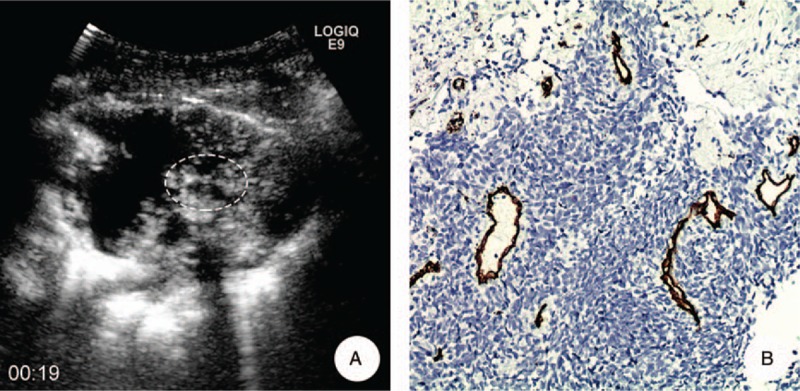
A 52-year-old male with squamous cell carcinoma in his left lung. A, MFI showed the microvascular represented as a “dead wood” pattern 19 seconds after injection of SonoVue; the target of biopsy was the most enhanced areas of tumor on CEUS (ellipse). B, Pathological result demonstrated that there were scattered and large neovascularization in the lesion and the average of MVD and MD was 20/HP and 21.6 μm, respectively (anti-CD34 antibody, original magnification x200). CEUS = contrast-enhanced ultrasound, MD = microvascular diameter, MFI = microflow imaging, MVD = microvascular density.
Table 7.
MVD and MD of lung cancer according to MFI patterns.
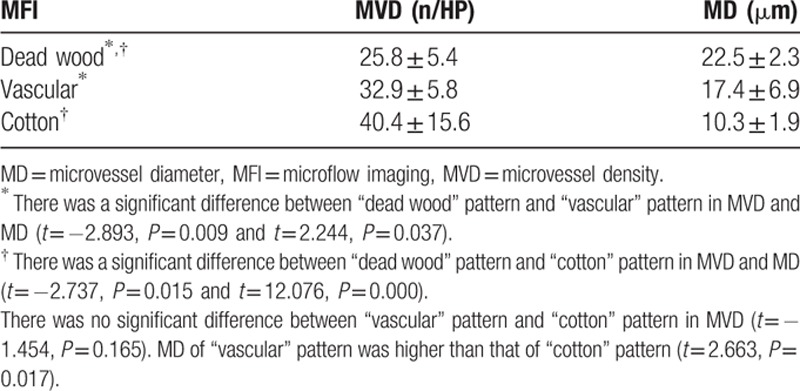
Figure 8.
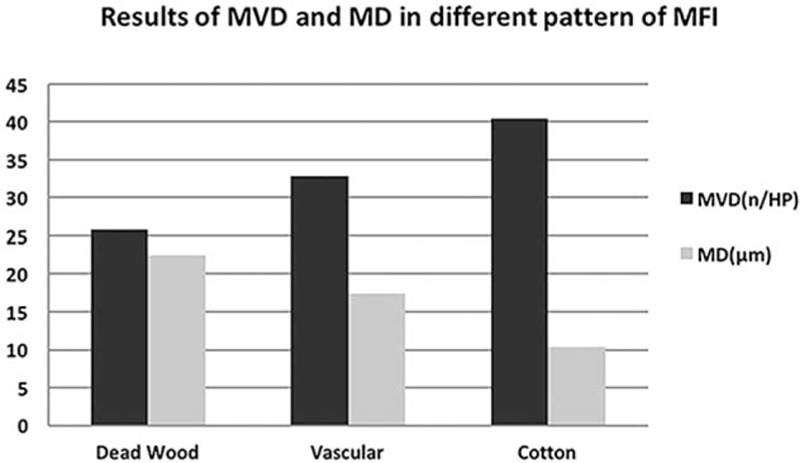
MVD of “dead wood” pattern was significantly lower than that of “vascular” pattern and “cotton” pattern (P = 0.037, P = 0.038). On the contrary, MD of “dead wood” pattern was significantly higher than that of “vascular” pattern and “cotton” pattern (P = 0.010, P = 0.000). MD = microvascular diameter, MFI = microflow imaging, MVD = microvascular density.
Figure 7.
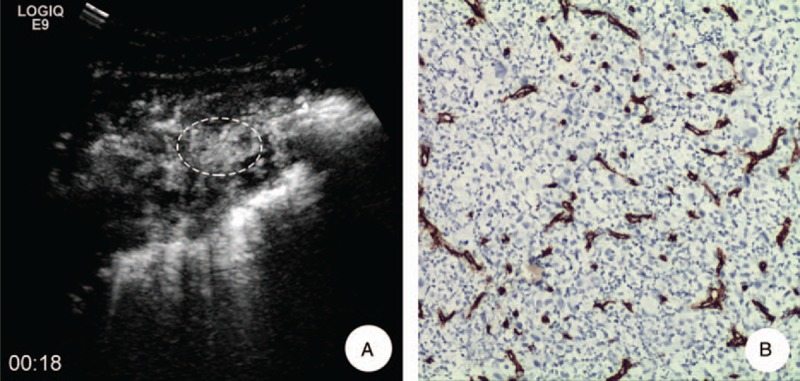
A 62-year-old female with adenocarcinoma in her left lung. A, MFI showed the microvascular presented as “vascular” pattern 11 s after injection of SonoVue; the target of biopsy was the most enhanced areas of tumor on CEUS (ellipse). B, Pathological examination demonstrated that there was intense and small neovascularization in the lesion and the average of MVD and MD was 52.1/ HP and 10.1 μm, respectively (anti-CD34 antibody, original magnification x200). CEUS = contrast-enhanced ultrasound, MD = microvascular diameter, MFI = microflow imaging, MVD = microvascular density.
4. Discussion
It is undeniable that chest CT now is the best and important technique to screen lung cancer. [16] However, the equipment required for such evaluations may not be available in small peripheral hospitals, and these procedures are usually more expensive than ultrasound. In addition, its machine is inconvenient to move. Moreover, CT has the potential risk of radiation exposure. On the other side, there really exist patients who have CT contrast agent allergy. Ultrasound may provide a potential diagnosis method for these patients if lung lesions are located close to the chest wall. For patients who have undetermined diagnosis by enhanced CT, CEUS could provide a combination or complementary diagnosis information. [17] Also, CEUS-guided biopsy has a high sensitivity and specificity for pathological diagnosis in patients with peripheral lung cancers. [18] However, we believe that there would be no need to perform a biopsy if both CEUS and CECT diagnose the same disease in some cases. Surgical resection without prior invasive diagnosis may be reasonable for malignant disease, while close follow-up may be considered for benign disease. In addition, the WHO divides lung cancer into 2 major classes on the basis of its biology, therapy, and prognosis: nonsmall cell lung cancer (NSCLC) and small cell lung cancer. NSCLC accounts for more than 85% of all lung cancer cases, and it includes adenocarcinoma, squamous cell carcinoma, and other types. The differential diagnosis of different types of lung cancers would benefit to select appropriate treatment strategies and predict outcomes.[ 17 19] In the present study, we visualized the microvascular architecture with MFI, based on an accumulation of images and combined with maximum-holding image processing to more distinctly delineate the blood vessels of tissue, and distinguished the difference between the common pathological types of PLC.
Vascular invasion is one of the most important determinants of tumor grade. [20] It has also been reported to be correlated with the degree of histological differentiation. [21] Lung cancer is a hypervascular tumor best diagnosed by dynamic CT. [22] Dynamic contrast-enhanced CT (DCE-CT) could provide a diagnostic assessment for tumour angiogenesis through quantitative evaluation of vascular perfusion. [23 24 25] However, CEUS and DCE-CT are not equivalent, as ultrasound contrast agents have different pharmacokinetics and are confined to the intravascular space, whereas the majority of currently approved contrast agents for CT and magnetic resonance imaging (MRI) are rapidly cleared from the blood pool into the extracellular space.[ 26 27] Thus, it is easier and more visual to display the tumor microvascular architecture contrast-enhanced agent compared with CT scan. [28] The new contrast agents, such as SonoVue, are more stable and resistant to ultrasound exposure and radiate sufficient harmonic signal by low mechanical index (MI) transmission power, which allows continuous real-time imaging. [29] Also, from a clinical point of view, MFI based on CEUS might provide additional detail information for displaying microvascular morphology in malignant tumor through a noninvasive way. In this study, we found that the pulmonary tumor microvascular architecture mainly displayed as 3 types of the MFI pattern early in the arterial phase: “deadwood,” “vascular,” and “cotton.” In the present study, over 90% of lung cancers represented these neovascularization signs, which could play an important role in the diagnosis of lung malignancies.
MFI could show abnormal feeding vessels in malignant lesions that were not seen or suspected on the conventional contrast images. The number of enlarged and distorted vessels distributed radially increased obviously, and the detection rate of small spiculate vessels surrounding carcinomas increased remarkably. Previous studies have mainly focused on evaluation of microvascular morphologic changes in hepatocellular carcinomas (HCCs) using this new CEUS technique. Moriyasu et al [30] found that the microvascular morphologic changes in HCCs were visualized on MFI. Sugimoto et al [31] reported that different histological degree of HCC could be classified with MFI; their results demonstrated a high diagnostic value. Du et al [11] has published a similar research on the classification of breast lesions as benign or malignant with MFI. The further analysis of this study demonstrated that MFI of squamous cell carcinomas mainly assumes as a “dead wood” pattern; the “vascular” pattern and “cotton” pattern were mainly shown in adenocarcinomas and SCLCs. Overall, its diagnostic specificity, accuracy, positive predictive value, and negative predictive value were 93.3%, 82.1%, 84.6%, and 81.2%, respectively. However, the sensitivity of this feature was low [62.9% (22/35)]. Except the 22 cases that fitted “dead wood” pattern, there were 10 “vascular” patterns, 2 “cotton” patterns, and an undefined pattern included in squamous cell carcinoma. It should be noted that the presence of “dead wood” pattern suggests squamous cell carcinoma, but its absence does not exclude squamous cell carcinoma.
In this study, we avoid the clinical information, including age, clinical feature, medical history, and so on, before the 2 independent readers retrospectively observe the feature of neovascularization. Then, the MFI patterns of each reader were tested by Kappa test. The result demonstrated a good diagnosis concordance between the 2 readers (Kappa = 0.758). It means that the recognition of microvascular in lung cancer was replicable with MFI, even though the feature is a bit subjective.
The research about the correlation between CEUS and MVD was mostly reported in recent years.[ 32 33] These results demonstrated that using CEUS could display the information of vascular perfusion inside the tumor and it also could be a good method for evaluating the MVD in malignant tumors. CEUS provided a reliable assessment of tumor vascularity. [34] Wang et al [35] reported that the peak intensity (PI) and area under the curve (AUC) in CEUS could reflect the MVD in ovarian tumors. Luo et al [36] also showed that the enhanced degree of CEUS of squamous cell carcinomas was lower than that of adenocarcinoma. The morphology of blood vessel in the malignant tumor was tortuous and meandering. The characteristic that depended on its biologic action was different from the normal blood vessel. Yamashita et al [37] divided the tumors into 2 groups according to the diameter of blood vessels as big (>0.1 mm) group and small (0.02∼0.1 mm) group; results showed that the correlation of small blood vessels of lung carcinomas was greater than large blood vessels (r = 0.77 and r = 0.59). Enhancement characteristics of lung carcinomas reflect the number of small tumorous vessels.
In our histopathological analysis, the MVD of “dead wood” patterns was lower than that of “cotton” patterns and of “vascular” patterns, whereas the MD of “dead wood” patterns was higher than that of “cotton” patterns and of “vascular” patterns. The wider diameter and heterogeneous distribution of microvascularity in tumors could reflect “deadwood” pattern, and the irregular necrotic tissue frequently occurred in “deadwood” pattern. “Dead wood” pattern might become the diagnostic clue to lung squamous cell carcinomas. On the contrary, the slender diameter and homogeneous distribution of microvascularity in tumors could reflect “vascular” pattern and “cotton” patterns, and the necrosis area occurred was small or less. “Vascular” and “cotton” patterns might become the diagnostic clues to lung adenocarcinoma or SCLC. The “dead wood” patterns might be correlated with the shape of necrosis and larger vessels, while the “vascular” patterns and “cotton” patterns might be correlated with the intensive distribution of neovascularization and smaller vessels in the tumor. The pathological correlation analysis provided important evidence for the different MFI patterns in peripheral lung cancer.
Although MFI could well demonstrate the neovascularization of lung cancers and may be helpful for further distinguish different types of lung cancers, it has several limitations compared with CT. First is the restriction of ribs and lung gas. Sometimes, lung tumor is not totally displayed by ultrasound due to gas or rib; thus, some neovascularization information may be missed by the MFI patterns analysis. Moreover, ultrasonography also could not display tumors in the central position of lung tissue. Second, also, it should be noted that 5 of 95 patients in this group presented an undefined MFI pattern (not belong to the 3 main patterns, including 1 squamous cell carcinoma, 3 adenocarcinomas, and 1 SCLC). This result indicated that the MFI pattern could not cover all types of peripheral lung cancers. We should be careful in making a diagnosis for some atypical cases. The last limitation was that the neovascularization might also be related to histological differentiation degree of lung cancer. In this study, we only investigated the difference of MFI among squamous cell carcinoma, adenocarcinoma, and SCLS, so the diagnosis results would be influenced by histological differentiation of lesions.
5. Conclusions
The vascular angioarchitecture of lung cancer could be evaluated using MFI, and MFI showed a good correlation with pathological result. The results of this study demonstrate the feasibility of noninvasive preoperative diagnosis of different histopathological types of lung cancer using CEUS, with a high degree accuracy and objectivity.
Footnotes
Abbreviations: AUC = area under the curve, CEUS = contrast-enhanced ultrasound, CT = computed tomography, DCE-CT = dynamic contrast-enhanced CT, MD = microvascular diameter, MFI = microflow imaging, MI = mechanical index, MVD = microvascular density, NSCLC = nonsmall cell lung cancer, PI = peak intensity, PLC = peripheral lung cancer, SCLC = small cell lung cancer.
YW and YK have equal contribution to this paper.
This research was supported by Beijing Municipal Health System special funds of High-Level Medical Personnel Construction (No. 2013-3-086); Beijing baiqianwan Talents Project; and the National Natural Science Foundation of Beijing (No. 7152031).
The authors report no conflicts of interest.
References
- 1. Torre LA, Bray F, Siegel RL, et al. Global cancer statistics, 2012. CA Cancer J Clin 2015; 65:87–108. [DOI] [PubMed] [Google Scholar]
- 2. Rednic N, Orasan O. Subpleural lung tumors ultrasonography. Med Ultrason 2010; 12:81–87. [PubMed] [Google Scholar]
- 3. Görg C, Kring R, Bert T. Transcutaneous contrast-enhanced sonography of peripheral lung lesions. AJR Am J Roentgenol 2006; 187:W420–429. [DOI] [PubMed] [Google Scholar]
- 4. Sperandeo M, Sperandeo G, Varriale A, et al. Contrast-enhanced ultrasound (CEUS) for the study of peripheral lung lesions: a preliminary study. Ultrasound Med Biol 2006; 32:1467–1472. [DOI] [PubMed] [Google Scholar]
- 5. Wen Q1, Liu XM, Luo ZY, et al. Enhancement pattern of peripheral lung carcinoma: comparison between contrast-enhanced ultrasonography and contrast-enhanced computed tomography. Zhonghua Yi Xue Za Zhi 2008; 88:2779–2782. [PubMed] [Google Scholar]
- 6. Noonan CD, Margulis AR, Wright R. Bronchial arterial patterns in pulmonary metastasis. Radiology 1965; 84:1033–1042. [DOI] [PubMed] [Google Scholar]
- 7. Hellekant C. Bronchial angiography and intraarterial chemotherapy with mitomycin-c in bronchogenic carcinoma: anatomy, technique, complication. Acta Radiol 1979; 20:478–482. [DOI] [PubMed] [Google Scholar]
- 8. Milne EN, Zerhouni EA. Blood supply of pulmonary metastases. J Thorac Imaging 1987; 2:15–23. [DOI] [PubMed] [Google Scholar]
- 9. Friedman PJ, Jonas AM, Carrington CB. Observations on the vascularization of secondary pulmonary neoplasms. Invest Radiol 1974; 9:227–240. [DOI] [PubMed] [Google Scholar]
- 10. Sato K, Tanaka S, Mitsunori Y, et al. Contrast-enhanced intraoperative ultrasonography for vascular imaging of hepatocellular carcinoma: clinical and biological significance. Hepatology 2013; 57:1436–1447. [DOI] [PubMed] [Google Scholar]
- 11. Du J, Li FH, Fang H, et al. Microvascular architecture of breast lesions: evaluation with contrast-enhanced ultrasonographic micro flow imaging. J Ultrasound Med 2008; 27:833–842. [DOI] [PubMed] [Google Scholar]
- 12. Yang H, Liu GJ, Lu MD, et al. Evaluation of the vascular architecture of focal liver lesions using micro flow imaging. J Ultrasound Med 2013; 32:1157–1171. [DOI] [PubMed] [Google Scholar]
- 13. Yang H, Liu GJ, Lu MD, et al. Evaluation of the vascular architecture of hepatocellular carcinoma by micro flow imaging pathologic correlation. J Ultrasound Med 2007; 26:461–467. [DOI] [PubMed] [Google Scholar]
- 14. Weidner N, Semple JP, Welch WR, et al. Tumor angiogenesis and metastasis: correlation in invasive breast carcinoma. N Engl J Med 1991; 324:1–8. [DOI] [PubMed] [Google Scholar]
- 15. Hakimé A, Peddi H, Hines-Peralta AU, et al. CT perfusion for determination of pharmacologically mediated blood flow changes in an animal tumor model. Radiology 2007; 243:712–719. [DOI] [PubMed] [Google Scholar]
- 16. Wood DE, Eapen GA, Ettinger DS, et al. Lung cancer screening. J Natl Compr Canc Netw 2012; 10:240–265. [DOI] [PMC free article] [PubMed] [Google Scholar]
- 17. Caremani M, Benci A, Lapini L, et al. Contrast enhanced ultrasonography (CEUS) in peripheral lung lesions: a study of 60 cases. J Ultrasound 2008; 11:89–96. [DOI] [PMC free article] [PubMed] [Google Scholar]
- 18. Wang S, Yang W, Zhang H, et al. The role of contrast-enhanced ultrasound in selection indication and improving diagnosis for transthoracic biopsy in peripheral pulmonary and mediastinal lesions. Biomed Res Int 2015; 2015:231782. [DOI] [PMC free article] [PubMed] [Google Scholar]
- 19. Ettinger DS, Akerley W, Borghaei H, et al. Non–small cell lung cancer, version 2. 2013. J Natl Compr Canc Netw 2013; 11:645–653. [DOI] [PubMed] [Google Scholar]
- 20. Pawlik TM, Delman KA, Vauthey JN, et al. Tumor size predicts vascular invasion and histologic grade: implications for selection of surgical treatment for hepatocellular carcinoma. Liver Transplant 2005; 11:1086–1092. [DOI] [PubMed] [Google Scholar]
- 21. Sun B, Zhang S, Zhang D, et al. Vasculogenic mimicry is associated with high tumor grade, invasion and metastasis, and short survival in patients with hepatocellular carcinoma. Oncol Rep 2006; 16:693–698. [PubMed] [Google Scholar]
- 22. Ohno Y, Nishio M, Koyama H, et al. Dynamic contrast-enhanced CT and MRI for pulmonary nodule assessment. AJR Am J Roentgenol 2014; 202:515–529. [DOI] [PubMed] [Google Scholar]
- 23. Miles KA. Tumour angiogenesis and its relation to contrast enhancement on computed tomography: a review. Eur J Radiol 1999; 30:198–205. [DOI] [PubMed] [Google Scholar]
- 24. Tateishi U, Nishihara H, Watanabe S, et al. Tumor angiogenesis and dynamic CT in lung adenocarcinoma: radiologic–pathologic correlation. J Comput Assist Tomogr 2001; 25:23–27. [DOI] [PubMed] [Google Scholar]
- 25. Pollard RE, Garcia TC, Stieger SM, et al. Quantitative evaluation of perfusion and permeability of peripheral tumors using contrast-enhanced computed tomography. Invest Radiol 2004; 39:340–349. [DOI] [PubMed] [Google Scholar]
- 26. Claudon M, Dietrich CF, Choi BI, et al. Guidelines and good clinical practice recommendations for Contrast Enhanced Ultrasound (CEUS) in the liver—update 2012: a WFUMB-EFSUMB initiative in cooperation with representatives of AFSUMB, AIUM, ASUM, FLAUS and ICUS. Ultrasound Med Biol 2013; 39:187–210. [DOI] [PubMed] [Google Scholar]
- 27. Albrecht T, Blomley M, Bolondi L, et al. Guidelines for the use of contrast agents in ultrasound. Ultraschall Med 2004; 25:249–256. [DOI] [PubMed] [Google Scholar]
- 28. Greis C. Quantitative evaluation of microvascular blood flow by contrast-enhanced ultrasound (CEUS). Clin Hemorheol Microcirc 2011; 49:137–149. [DOI] [PubMed] [Google Scholar]
- 29. Numata K, Tanaka K, Kiba T, et al. Contrast-enhanced, wide-band harmonic gray scale imaging of hepatocellular carcinoma: correlation with helical computed tomographic findings. J Ultrasound Med 2001; 20:89–98. [DOI] [PubMed] [Google Scholar]
- 30. Moriyasu F, Lu MD, Chen MH. Comparison of microvascular morphological changes in hepatocellular carcinomas using micro flow imaging with pathologic findings in a multicenter trial. Radiological Society of North America 2005 Scientific Assembly and Annual Meeting, November 27–December 2, 2005, Chicago IL. http://archive.rsna.org/2005/4409027.html. [Google Scholar]
- 31. Sugimoto K, Moriyasu F, Kamiyama N, et al. Analysis of morphological vascular changes of hepatocellular carcinoma by microflow imaging using contrast-enhanced sonography. Hepatol Res 2008; 38:790–799. [DOI] [PubMed] [Google Scholar]
- 32. Wei X, Li Y, Zhang S, et al. Evaluation of thyroid cancer in Chinese females with breast cancer by vascular endothelial growth factor (VEGF), microvessel density, and contrast-enhanced ultrasound (CEUS). Tumour Biol 2014; 35:6521–6529. [DOI] [PubMed] [Google Scholar]
- 33. Shi YL, Pin TH, Zong MW, et al. The relationship between enhanced intensity and microvessel density of gastric carcinoma using double contrast-enhanced ultrasonography. Ultrasound Med Biol 2009; 35:1086–1091. [DOI] [PubMed] [Google Scholar]
- 34. Pysz MA, Foygel K, Panje CM, et al. Assessment and monitoring tumor vascularity with contrast-enhanced ultrasound maximum intensity persistence imaging. Invest Radiol 2011; 46:187–195. [DOI] [PMC free article] [PubMed] [Google Scholar]
- 35. Wang J, Lv F, Fei X, et al. Study on the characteristics of contrast-enhanced ultrasound and its utility in assessing the microvessel density in ovarian tumors or tumor-like lesions. Int J Biol Sci 2011; 7:600–606. [DOI] [PMC free article] [PubMed] [Google Scholar]
- 36. Luo ZY, Xue-ming LIU, Qing WEN, et al. Contrast-enhanced ultrasound of pulmonary carcinoma: a preliminary study. Chinese J Ultrasonogr 2008; 17:690–693. [Google Scholar]
- 37. Yamashita K, Matsunobe S, Takahashi R, et al. Small peripheral lung carcinoma evaluated with incremental dynamic CT: radiologic-pathologic correlation. Radiology 1995; 196:401–408. [DOI] [PubMed] [Google Scholar]


