Abstract
Objective:
To investigate the changes of retinal nerve fiber layer (RNFL) thickness in obstructive sleep apnea syndrome (OSAS) patients.
Methods:
Relevant studies were selected from 3 major literature databases (PubMed, Cochrane Library, and EMBASE) without language restriction. Main inclusion criteria is that a case-control study in which RNFL thickness was measured by a commercial available optical coherence tomography (OCT) in OSAS patients. Meta-analysis was performed using STATA 12.0 software. Efficacy estimates were evaluated by weighted mean difference with corresponding 95% confidence intervals (CIs). Primary outcome evaluations were: the average changes of RNFL thickness in total OSAS patients, subgroup analysis of RNFL thickness changes in patients of different OSAS stages, and subgroup analysis of 4-quadrant RNFL thickness changes in total OSAS patients.
Results:
Of the initial 327 literatures, 8 case-control studies with 763 eyes of OSA patients and 474 eyes of healthy controls were included (NOS scores ≥6). For the people of total OSAS, there had an average 2.92 μm decreased RNFL thickness compared with controls (95% CI: −4.61 to −1.24, P = 0.001). For subgroup analysis of OSAS in different stages, the average changes of RNFL thickness in mild, moderate, severe, and moderate to severe OSAS were 2.05 (95% CI: −4.40 to 0.30, P = 0.088), 2.32 (95% CI: −5.04 to 0.40, P = 0.094), 4.21 (95% CI: −8.36 to −0.06, P = 0.047), and 4.02 (95% CI: −7.65 to −0.40, P = 0.03), respectively. For subgroup analysis of 4-quadrant, the average changes of RNFL thickness in Superior, Nasal, Inferior, and Temporal quadrant were 2.43 (95% CI: −4.28 to −0.57, P = 0.01), 1.41 (95% CI: −3.33 to 0.51, P = 0.151), 3.75 (95% CI: −6.92 to −0.59, P = 0.02), and 0.98 (95% CI: −2.49 to 0.53, P = 0.203), respectively.
Conclusion:
Our study suggests that RNFL thickness in OSAS patients is much thinner than healthy population, especially in superior and inferior quadrant. The impact of OSAS disease on RNFL and visual function should be taken seriously in the further study.
Keywords: meta-analysis, obstructive sleep apnea, optical coherence tomography, retinal nerve fiber layer
1. Introduction
Obstructive sleep apnea syndrome (OSAS) is the most common type of sleep-disorder breathing (SDB) that is caused by total and/or partial collapse of the upper airways during sleep. [1] It is expected to result in recurrent episodes of oxyhemoglobin desaturations and arousals from sleep. Approximately 24% of middle-aged men and 9% of middle-aged women are suffering from OSAS around the world. [2] Because of the anoxic and increased vascular resistance, nervous system, particularly the central nervous system, may be irreversibly damaged. [3 4 5]
Retina and optic nerve are parts of central nervous system (CNS), many studies reported the close relationship between OSAS and optic nerve disorders.[ 6 7] Retinal nerve fiber layer (RNFL) constituted by axons of retinal ganglion cell is highly sensitive to hypoxia. [8] Some previous studies found significant decreases of RNFL thickness in OSAS patients,[ 9 10] while other studies showed contradictive results.[ 11 12] Thus, we conducted this systematic review and meta-analysis to combine the results of all published relative studies to assess the impact of OSA on RNFL thickness.
Recently, a meta-analysis performed by Zhao et al [13] showed average RNFL thickness in OSAS patients compared with control participants was −2.03 μm. Addition to the primary conclusion, our study has the following difference: the previous meta-analysis did the literature searching just through PubMed database and in November 2014 1 year ago; through our database searching and studies screening, we included 8 studies for meta-analysis that showed a 2.92 μm decreased RNFL thickness compared with controls. The more important different points are that a statistical significance difference in superior and inferior quadrant was found through our subgroup analysis of 4-quadrant.
2. Methods
2.1. Ethnic statements, search, and identification strategy
The study was approved by Institutional Review Board of The Fifth Affiliated Hospital of Zhengzhou University (number 2015-11-0360012). We searched PubMed, EMBASE databases, and Cochrane library for published literatures through November 2015. The following search terms were used: ((obstructive sleep apnea syndrome) OR (sleep apnea syndrome) OR (obstructive sleep apnea) OR (obstructive sleep hypopnea syndrome) OR (sleep disordered breathing) OR (OSAHS) OR (OSAS)) AND ((optical coherence tomography[Title/Abstract]) OR (optical coherence tomography[Title/Abstract])).
2.2. Inclusion and exclusion criteria
Studies were included without language restriction and sample size limited if they met the following criteria: case-control study; the study used a commercially available optical coherence tomography (OCT) to measure the RNFL thickness; the study investigated RNFL thickness in the adult patient with OSAS; the diagnoses of OSAS must be provided clearly, according to the apnea-hypopnea index ((mild (>5, <16); moderate (>15, <31), or severe (>30))>5) [14] of full-night polysomnography; there were sufficient scores data to extract for evaluating RNFL thickness between cases and controls.
There was a discussion before the literature searching to develop the search strategies. Then under the unified searching strategy, 2 investigators independently performed the searching in the mentioned databases. Secondly, with the reference management software endnote, 2 investigators independently finished the selection process on the basis of the predetermined selection criteria according to a blank flow chart. And every study was screened and remarked by a new label to different category in endnote independently. Finally, there was a discussion for the different inclusion studies and any different opinions were solved by consulting third one who had a wealth of experience in meta-analysis.
2.3. Data extraction and studies quality evaluation
CS and LZ as the investigators extracted and recorded the data independently from all the studies included following the items below: first author name, publication date, area, study design, OCT type, control group selection, gender, age, sample size, primary outcomes.
They were also required to assess the methodological quality of each eligible study with the Newcastle–Ottawa Scale (NOS). [15] Any different views in this process were addressed and consulted with the third expert.
2.4. Statistical analysis
The data was analyzed by STATA Version 12.0. As some studies did not provide the mean and standard deviation (SD) of RNFL thickness in total or moderate to severe OSAS patients, we used the website (https://www.statstodo.com/ComMeans_Pgm.php) to calculate the relevant data based on the followed maths formula: combined mean = μc = (μ1 ∗ n1 +μ2 ∗ n2 + μ3 ∗ n3 ...)/(n1 + n2 + n3 ....); combined SD = σc = sqrt ((σ12 (n1–1) + (μ1 ∗ n1)2/n1) + (σ22 (n2–1) + (μ2 ∗ n2)2/n2) + (σ32 (n3–1) + (μ3 ∗ n3)2/n3) ...–(μ1 ∗ n1 + μ2 ∗ n2 + μ3 ∗ n3 ...)2/nc)/(nc–1)); n1, n2, n3... = number of cases in groups 1, 2, 3 ...; μ1, μ2, μ3 ... = mean of the groups 1, 2, 3 ...; σ1, σ2, σ3... = SD of the groups 1, 2, 3... Weighted mean difference was performed to estimate the specified relationship. Z test was used to evaluate the statistical difference of the data extracted. Cochran Q-statistic and I 2 test were performed to determine interstudy heterogeneity. P <0.05 or I 2 > 50% represents a statistical significance, the random effects model was used; otherwise, the fixed-effects model was applied. Subgroup analysis was utilized to identify the potential sources of heterogeneity. Sensitivity was calculated to justify the influence of a single study on the overall estimate. P <0.05 was considered statistically significant, except for heterogeneity tests which threshold was 0.10.
3. Results
3.1. Identification of study included
A total of 327 studies were obtained from PubMed (n = 47), Embase (n = 276), and Cochrane (n = 2) under our searching strategy. After removal of 43 duplicated studies, 284 studies were screened with the title and abstract, but only 34 of them were assessed for the eligibility with full-text evaluation. Then, 26 articles were excluded for various reasons which were summarized in Fig. 1. Eight articles met all criteria were finally included.
Figure 1.
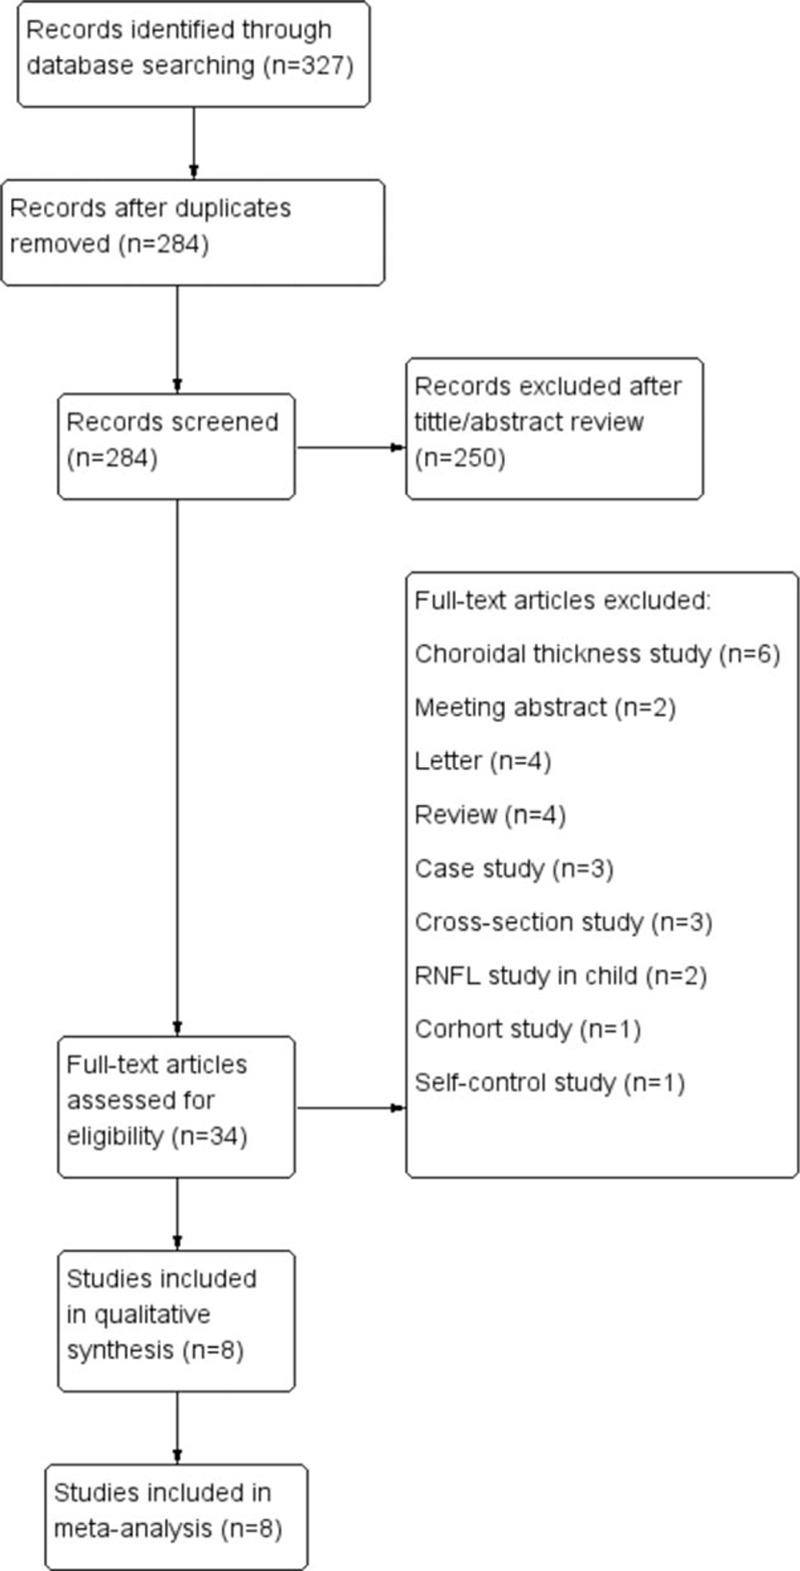
Flow chart of the studies selection process.
3.2. Baseline characteristics and quality of included studies
The characteristics and NOS scores of the 8 included studies were described in Table 1. All studies were published through the past 5 years. Among them, 4 studies were performed in Turkey, 2 in Spain, 1 in Israel, and 1 in China (Taiwan). For the measurement of RNFL thickness, 5 used Stratus OCT, 1 used Optovue OCT, 1 used 3D-OCT, and 1 used Cirrus OCT. All of the studies gave the detail of controls selection and all individuals did the polysomnography examination. All of these studies enrolled both female and male in spite of 1 study that did not provide the gender data of the 2 groups. To take the ophthalmologic examination, 3 studies examined each eye and 5 examined randomly selected eye. The primary outcomes are also provided in Table 1. The NOS scores were ≥6 for all the included studies. The average NOS score of the 8 included studies is 6.9, indicating that methodological quality generally is good (Table 2).
Table 1.
Baseline characteristic and quality of the included studies.

Table 2.
Stratified analyses according to different OSAS stage and quadrant.

3.3. Analysis of average RNFL thickness between different OSAS stage patients and controls
Heterogeneity of the results from different studies was analyzed by STATA, random-effects models were also used. Figure 2 shows the forest plot of heterogeneity on average RNFL thickness in patients with total and different OSAS stages. No statistical difference was noticed on total, mild, and moderate OSAS (I-squared and P value were 59.1%, 0.017; 8.0%, 0.353, and 38.6%, 0.180; respectively). However, the significant difference on severe and moderate to severe OSAS was found (I-squared and P value were 82.1%, 0.000 and 75.8%, 0.006; respectively). Z test and corresponding P value were 3.40, 0.001; 1.71, 0.088; 1.67, 0.094; 1.99, 0.047; and 2.17, 0.030, respectively.
Figure 2.
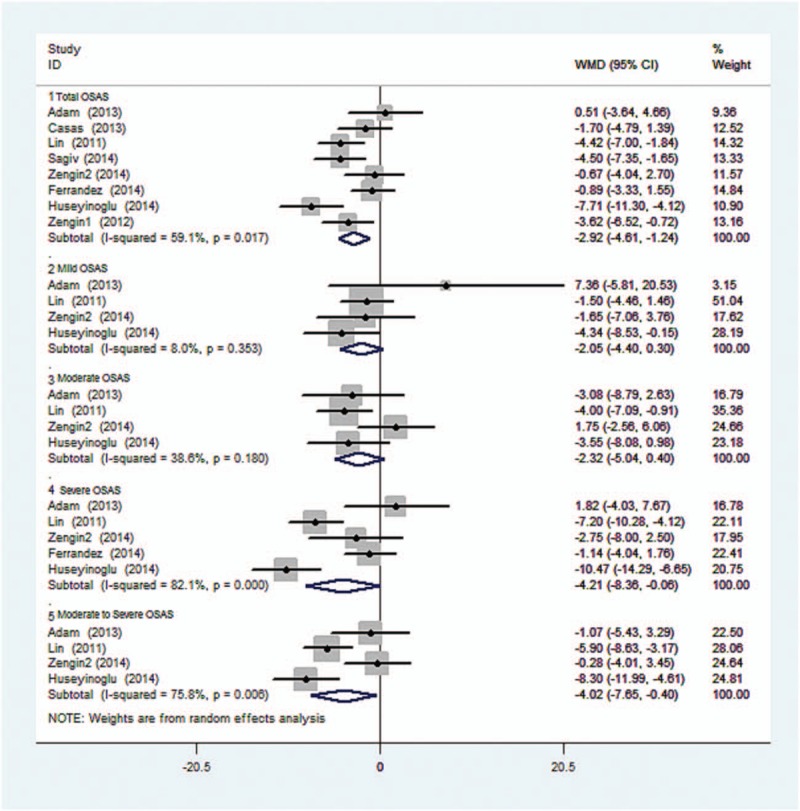
Forest plot shows the combined mean deviation of average RNFL thickness in patients with total and different stage of OSAS. OSAS = obstructive sleep apnea syndrome, RNFL = retinal nerve fiber layer.
3.4. Analysis of average RNFL thickness between 4-quadrant retina of patients and controls
Figure 3 shows the heterogeneity of average RNFL thickness in 4-quadrant retina between OSAS patients and the controls. No statistical difference was found (I-squared and P value were 18.7%, 0.287; 17.4%, 0.297; 57.6%, 0.028; and 0%, 0.753, respectively). Z test and corresponding P value were 2.56, 0.01; 1.44, 0.151; 2.32, 0.02; and 1.27, 0.203, respectively.
Figure 3.
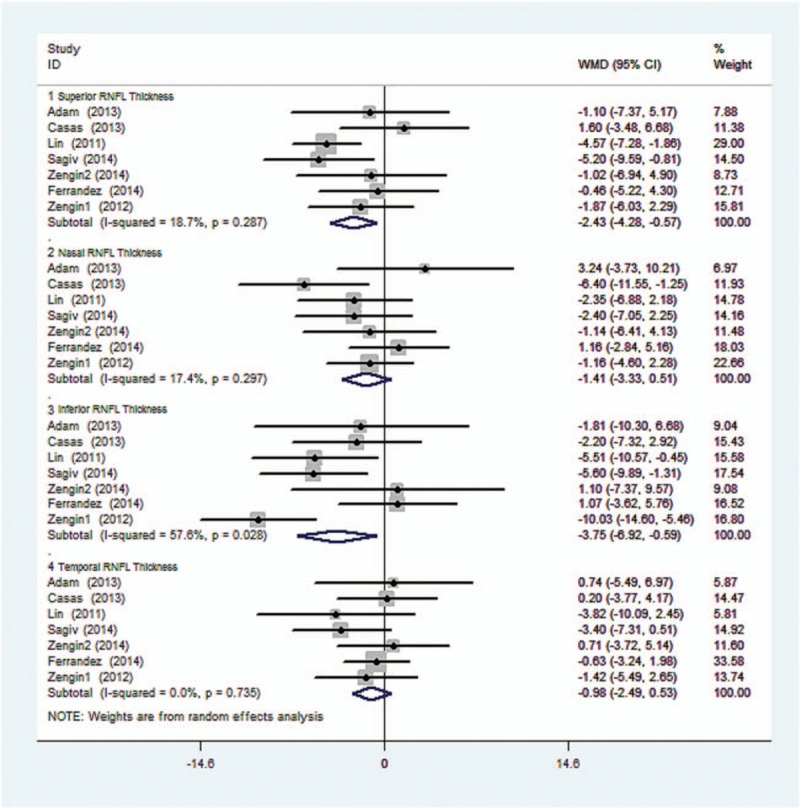
Forest plot shows the combined mean deviation of 4-quadrant RNFL thickness in 2 groups.
3.5. Sensitivity analyses and publication bias of the included studies on average RNFL thickness between total OSAS patients and controls
The sensitivity analysis to evaluate the impact of OSAS on RNFL thickness shown in Fig. 4 suggests that no single study influenced the overall pooled estimates.
Figure 4.
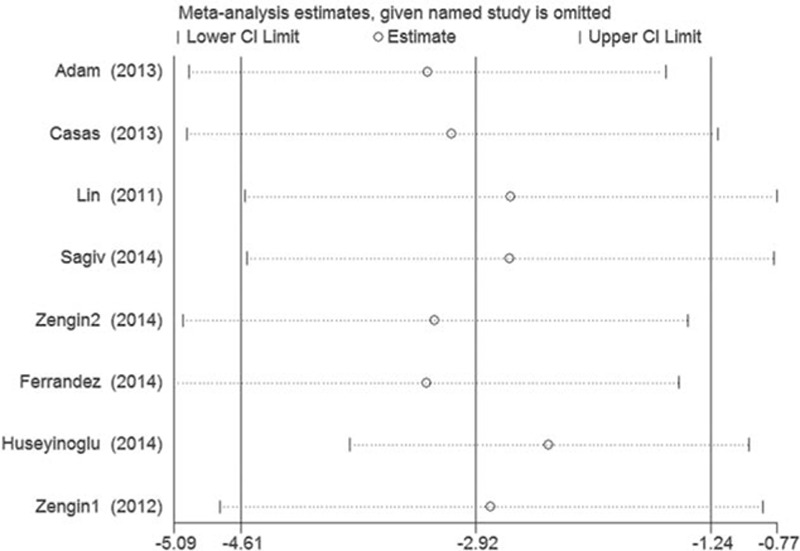
Sensitivity analyses of the included studies for the RNFL thickness in patients with total and different stage of OSAS. OSAS = obstructive sleep apnea syndrome, RNFL = retinal nerve fiber layer.
Publication bias was tested by Begg funnel plot and Egger test. The P values of Begg and Egger test were 0.711 and 0.929, respectively. It indicated a low probability of publication bias (Fig. 5).
Figure 5.
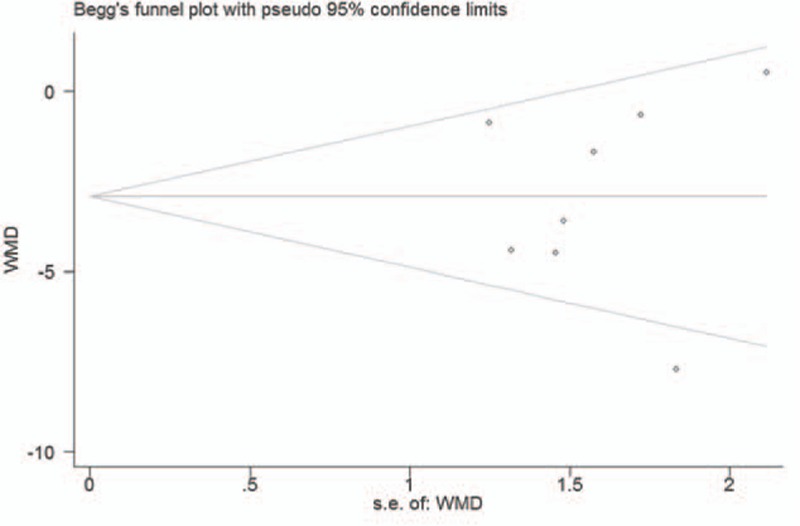
Funnel plot for studies of the RNFL thickness in patients with OSAS.
4. Discussion
The present meta-analysis suggested OSAS patients have a 2.92 μm decrease of RNFL thickness, a little higher than previous reported by Zhao et al. [13] Furthermore, we found RNFL thickness in superior and inferior was more sensitive than other quadrants in OSAS disease by subgroup analysis. Although only 8 articles were finally included and analyzed, we also noticed the reduction of RNFL thickness is corresponding to the OSAS severity, especially in moderate and severe groups.
Our meta-analysis uses a more comprehensive searching strategy with an additional 2 studies included. [13] The results are more meaningful for evaluating the impact of OSAS on RNFL thickness. Furthermore, we assessed the quality of each study in accordance with the NOS assessment criteria and found NOS score of each included study was higher than 5. Finally, we used a simple utility in a website to combine sample size, mean, and standard deviation from multiple groups into 1 group instead of excluding the study. In the premier of this analysis, we included 2 studies[ 22 23] that the research objects were children with chronic upper airway obstructions (UAOs)/obstructive sleep apnea syndrome (OSAS) and children with sleep-disordered breathing. From the heterogeneity test results, P values of total, mild, and moderate OSAS were 0.024, 0.511, and 0.257, respectively. It indicated that the included studies of the total, mild, moderate OSAS were homogenous. Sensitivity analyses and publication bias of the included studies on average RNFL thickness between total OSAS patients and controls also showed no single study influenced or publication bias. Nevertheless, considering the different RNFL thickness and OSAS duration between adult and child, we re-reviewed the related research about RNFL thickness with aging and found a decreased RNFL thickness (on average, 0.44 μm per year) in adults. [24] Therefore, the 2 studies were excluded finally.
In the data extraction stage, we found 3 of 8 included studies made the RNFL thickness measurement in each eye for analysis, whereas other studies used random selections. These contribute to 16.9% of the significant heterogeneity. Additionally, the use of different OCT instruments may also have contributed to the data heterogeneity. Due to the small sample size and high heterogeneity of included studies, it is hard to draw the conclusion that severe OSAS caused a significant reduction of RNFL thickness although we detected a P value less than 0.05. However, it is still need to highlight and monitor the changes of RNFL thickness in severe OSAS patients.
In patients with OSAS, hypoxia caused by intermittent upper airway obstruction results in a subsequent of increase in PaCO2 and decrease in PaO2. [25] Karakucuk et al [26] found positive correlations between ophthalmic artery resistivity index and mean defect (MD) and also between central retinal artery resistivity index and MD as well as loss variance in patients with OSAS, suggesting that visual field defects might be due to the low perfusion of optic nerve. The reduction of optic nerve blood supply leads to the apoptosis of retinal ganglion cells and thus results in optic neuropathy.[ 26 27] Two possible mechanisms may explain the RNFL thinning in OSAS. One is a deterioration of the imbalance between the endothelium and nitric oxide secreted from the endothelium because of apnea. Hypoxemia leading to increased intracranial pressure during sleep is the second possible mechanism.[ 7 12] As we know, the distribution of RNFL is most dense in inferior and superior quadrants. [28] This is also consistent with our findings. When OSAS causes ischemia and anoxia in retina, it may first affect the inferior and superior quadrant RNFL, leading to the decrease of RNFL thickness. A cross-sectional study performed by Xin et al [29] found that OSAS had a high prevalence of primary open-angle glaucoma (POAG) and visual field was damaged and the RNFL was thinned. This is consistent with another meta-analysis [30] on the association between glaucoma and OSAS.
In addition to the important finding provided by our meta-analysis, it also has some limitations. First, as different OCT devices (stratus, cirrus, 3D, or Optovue OCT) were used in the studies included in this meta-analysis to measure the RNFL thickness, we cannot ensure the homogeneity of inspection results. Although the prediction of mean pRNFL thickness values by equations derived from time domain OCT and spectral domain OCT can be conducted with high levels of agreement, [31] the mean RNFL in normal patient is around 105.1 (± 9.5) μm [32] and the resolution is of few micrometers depending on the device. When the retina was affected by OSAS, high prediction errors may occur. Second, there were no data of OSAS duration provided by any included studies. The longer OSAS duration patients suffering, the thinner RNFL thickness may be. Of course, the small sample size may be the main limitation that affects the result directly.
In summary, our study demonstrated that OSAS patients have significant decrease of RNFL thickness, especially in superior and inferior quadrants. However, multicenter, case-control and long-term cohort studies are still needed to assess the changes of RNFL thickness in OSAS patients.
Footnotes
Abbreviations: CNS = central nervous system, MD = mean defect, NOS = Newcastle–Ottawa Scale, OCT = optical coherence tomography, OSAS = obstructive sleep apnea syndrome, POAG = primary open-angle glaucoma, RNFL = retinal nerve fiber layer, SD = standard deviation, SDB = sleep-disorder breathing, UAOs = upper airway obstructions, WMD = weighted mean difference.
The authors have no conflicts of interest to disclose.
References
- 1. Jordan A, Wellman A, Heinzer R, et al. Mechanisms used to restore ventilation after partial upper airway collapse during sleep in humans. Thorax 2007; 62:861–867. [DOI] [PMC free article] [PubMed] [Google Scholar]
- 2. Lee W, Nagubadi S, Kryger M, et al. Epidemiology of obstructive sleep apnea: a population-based perspective. Expert Rev Respir Med 2008; 2:349–364. [DOI] [PMC free article] [PubMed] [Google Scholar]
- 3. Beebe D, Gozal D. Obstructive sleep apnea and the prefrontal cortex: towards a comprehensive model linking nocturnal upper airway obstruction to daytime cognitive and behavioral deficits. J Sleep Res 2002; 11:1–16. [DOI] [PubMed] [Google Scholar]
- 4. Yang Q, Wang Y, Feng J, et al. Intermittent hypoxia from obstructive sleep apnea may cause neuronal impairment and dysfunction in central nervous system: the potential roles played by microglia. Neuropsychiatr Dis Treat 2013; 9:1077–1086. [DOI] [PMC free article] [PubMed] [Google Scholar]
- 5. Gharraf H, Matrawy K, Reda I. Proton magnetic resonance spectroscopy of brain in obstructive sleep apnea in Egyptian subjects. Egyptian J Chest Dis Tuberculosis 2014; 63:395–403. [Google Scholar]
- 6. Tsang C, Chong S, Ho C, et al. Moderate to severe obstructive sleep apnoea patients is associated with a higher incidence of visual field defect. Eye 2006; 20:38–42. [DOI] [PubMed] [Google Scholar]
- 7. Kargi S, Altin R, Koksal M, et al. Retinal nerve fibre layer measurements are reduced in patients with obstructive sleep apnoea syndrome. Eye 2005; 19:575–579. [DOI] [PubMed] [Google Scholar]
- 8. Waller E, Bendel R, Kaplan J. Sleep disorders and the eye. Mayo Clin Proc 2008; 83:1251–1261. [DOI] [PubMed] [Google Scholar]
- 9. Aguilar A, Guerrero S, Perez M, et al. Normal tension glaucoma assessment by retinal nerve fibre layer in patients with obstructive sleep apnoea/hypopnoea syndrome. J Sleep Res 2012; 21:231. [Google Scholar]
- 10. Lin P, Friedman M, Lin H, et al. Decreased retinal nerve fiber layer thickness in patients with obstructive sleep apnea/hypopnea syndrome. Graefes Arch Clin Exp Ophthalmol 2011; 249:585–593. [DOI] [PubMed] [Google Scholar]
- 11. Casas P, Ascaso F, Vicente E, et al. Retinal nerve fibre layer evaluation using optical coherence tomography in patients with obstructive sleep apnea syndrome (OSAS). Neuroophthalmology 2011; 35:S37. [Google Scholar]
- 12. Adam M, Okka M, Yosunkaya S, et al. The evaluation of retinal nerve fiber layer thickness in patients with obstructive sleep apnea syndrome. J Ophthalmol 2013; 2013:292158. [DOI] [PMC free article] [PubMed] [Google Scholar]
- 13. Zhao XJ, Yang C, Zhang J, et al. Obstructive sleep apnea and retinal nerve fiber layer thickness: a meta-analysis. J Glaucoma 2016; 25:e413–418. [DOI] [PubMed] [Google Scholar]
- 14. Quan SF, Gillin JC, Littner MR, et al. Sleep-related breathing disorders in adults: recommendations for syndrome definition and measurement techniques in clinical research. Sleep 1999; 22:662–689. [PubMed] [Google Scholar]
- 15. Wells G, Shea B, O’connell D, et al. The Newcastle-Ottawa Scale (NOS) for assessing the quality of nonrandomised studies in meta-analyses. Available at: http://www.ohri.ca/programs/clinical_epidemiology/oxford.asp Accessed May 4, 2016. [Google Scholar]
- 16. Zengin M, Öztura I, Arikan G, et al. The relationship between obstructive sleep apnea syndrome and glaucoma. Turkiye Klinikleri J Med Sci 2012; 32:990–996. [Google Scholar]
- 17. Casas P, Ascaso FJ, Vicente E, et al. Retinal and optic nerve evaluation by optical coherence tomography in adults with obstructive sleep apnea-hypopnea syndrome (OSAHS). Graefes Arch Clin Exp Ophthalmol 2013; 251:1625–1634. [DOI] [PubMed] [Google Scholar]
- 18. Ferrandez B, Ferreras A, Calvo P, et al. Retinal sensitivity is reduced in patients with obstructive sleep apnea. Invest Ophthalmol Vis Sci 2014; 55:7119–7125. [DOI] [PubMed] [Google Scholar]
- 19. Huseyinoglu N, Ekinci M, Ozben S, et al. Optic disc and retinal nerve fiber layer parameters as indicators of neurodegenerative brain changes in patients with obstructive sleep apnea syndrome. Sleep Breathing 2014; 18:95–102. [DOI] [PubMed] [Google Scholar]
- 20. Sagiv O, Fishelson-arev T, Buckman G, et al. Retinal nerve fibre layer thickness measurements by optical coherence tomography in patients with sleep apnoea syndrome. Clin Exp Ophthalmol 2014; 42:132–138. [DOI] [PubMed] [Google Scholar]
- 21. Zengin M, Tuncer I, Karahan E. Retinal nerve fiber layer thickness changes in obstructive sleep apnea syndrome: one year follow-up results. Int J Ophthalmol 2014; 7:704–708. [DOI] [PMC free article] [PubMed] [Google Scholar]
- 22. Cinici E, Tatar A. Thickness alterations of retinal nerve fiber layer in children with sleep-disordered breathing due to adenotonsillar hypertrophy. Int J Pediatr Otorhinolaryngol 2015; 79:1218–1223. [DOI] [PubMed] [Google Scholar]
- 23. Simsek A, Bayraktar C, Dogan S, et al. Retinal nerve fiber layer thickness alteration in apneic children. Optom Vis Sci 2016; 93:63–69. [DOI] [PubMed] [Google Scholar]
- 24. Alamouti B, Funk J. Retinal thickness decreases with age: an OCT study. Br J Ophthalmol 2003; 87:899–901. [DOI] [PMC free article] [PubMed] [Google Scholar]
- 25. Bilgin G. Normal-tension glaucoma and obstructive sleep apnea syndrome: a prospective study. BMC Ophthalmol 2014; 14:1–4. [DOI] [PMC free article] [PubMed] [Google Scholar]
- 26. Karakucuk S, Goktas S, Aksu M, et al. Ocular blood flow in patients with obstructive sleep apnea syndrome (OSAS). Graefes Arch Clin Exp Ophthalmol 2008; 246:129–134. [DOI] [PMC free article] [PubMed] [Google Scholar]
- 27. Steindel A, Lautenschl G, Struck H. [Ocular risks in obstructive sleep apnea syndrome]. Ophthalmologe 2010; 107:1032–1036. [DOI] [PubMed] [Google Scholar]
- 28. Cohen M, Kaliner E, Frenkel S, et al. Morphometric analysis of human peripapillary retinal nerve fiber layer thickness. Invest Ophthalmol Vis Sci 2008; 49:941–944. [DOI] [PubMed] [Google Scholar]
- 29. Xin C, Zhang W, Wang L, et al. Changes of visual field and optic nerve fiber layer in patients with OSAS. Sleep Breath 2015; 19:129–214. [DOI] [PubMed] [Google Scholar]
- 30. Shi Y, Liu P, Guan J, et al. Association between glaucoma and obstructive sleep apnea syndrome: a meta-analysis and systematic review. PLoS One 2015; 10:e0115625. [DOI] [PMC free article] [PubMed] [Google Scholar]
- 31. Schrems W, Schrems-Hoesl L, Bendschneider D, et al. Predicted and measured retinal nerve fiber layer thickness from time-domain optical coherence tomography compared with spectral-domain optical coherence tomography. JAMA Ophthalmol 2015; 133:1135–1143. [DOI] [PubMed] [Google Scholar]
- 32. Costa A, Costa R, Melo L, et al. Influence of the eye-tracking–based follow-up function in retinal nerve fiber layer thickness using Fourier-domain optical coherence tomography EBF function in RNFL thickness measurements. Invest Ophthalmol Vis Sci 2013; 54:1958–1963. [DOI] [PubMed] [Google Scholar]


