Supplemental Digital Content is available in the text
Abstract
The extent of mixed hepatitis C virus (HCV) genotype in different compartments (plasma and peripheral blood mononuclear cell, PBMC) and possible association with treatment efficacy in HIV/HCV coinfected patients remains to be unknown.
The objective of this study was to elucidate the frequency of mixed genotype infection (MG), its profile in different compartments during anti-HCV treatment, and the possible influence of different genotypes on the response rate.
The compartmentalization of HCV population was investigated by next-generation sequencing in 19 HIV/HCV coinfected patients under anti-HCV treatment with peginterferon/ribavirin (P–R). Ten individuals were nonresponder (NR) or relapser (RE) to P–R treatment and 9 had a sustained virological response (SVR).
Eleven/nineteen (58%) patients had MG in plasma compartment. Ten or 12 patients infected by a difficult to treat genotype (DTG) 1 or 4 as dominant strain, had an MG, whereas only 1/7 individuals infected by easy to treat genotype (ETG) harbored a mixed genotype, P = 0.006. HCV–RNA was more frequently detected in PBMC of NR (10/10) than in those of SVR (5/9), P = 0.032. Mixed genotype infection was detected in 6/15 (40%) PBMC-positive cases and was not associated with P–R treatment response. By multivariate analysis, MG in plasma samples was the most important viral factor affecting the treatment response (P = 0.0237).
Detection of MG in plasma of HIV/HCV coinfected patients seems to represent the major determinant of response to P–R treatment. This finding may have important clinical implication in light of the new therapeutic approach in HIV/HCV coinfected individuals suggesting that combination treatment with direct acting antivirals could be less effective in MG.
INTRODUCTION
Hepatitis c virus is an enveloped, positive strand RNA virus belonging to the Hepacivirus genus in the Flaviviridae family. Seven confirmed genotypes are generally distinguished by phylogenetic methods and pairwise distance calculations.1,2 Hepatitis C virus genotypes diverged from each other by a pairwise distance of >30%. Individual genotypes can be further divided into more closely related subtypes that diverged by a pairwise distance of 15% to 30%. All viral genotypes retain their repertoire of collinear structural and nonstructural genes, thereby facilitating preliminary genotype classification on the basis of partial genome sequences in the core, 5′noncoding region (5′NC) and the nonstructural-5B domain.3 It is well known that Peginterferon and Ribavirin (P–R) antiviral treatment yields success rates <50% depending on the infecting genotype. Its correct assessment, in combination with viral load, serves to optimize the therapeutic regimen.4
It is difficult to determine the prevalence of mixed genotype infections (MG) by the commercial assays, or DNA sequencing because these assays are designed to identify the dominant genotype.5
A previous study6 involving chronically infected intravenous drug users, hemodialysis patients and hemophiliacs from Sweden and Russia used 2 genotyping methods based on the use of type-specific primers to detect MG and suggested that the frequency of MG is very low, even in these high-risk groups. Tuveri et al7 identified multiple HCV genotypes in13% of French patients with hemophilia or von Willebrand's disease using the same methodological approach of Viazov.6 Two other studies8,9 revealed the presence of MG by using restriction fragment length polymorphism (RFLP) in 45% and 50.8% parenterally transmitted infection risk groups.
Altogether, these studies demonstrated the difficulties of assessing the real prevalence of the minor genotypes within the MG, due to the absence of highly sensitive sequencing strategies to detect the low-frequency genomes.
With next-generation sequencing (NGS) platforms, it is now possible to investigate viral heterogeneity at much greater detail. Their high throughput allows for generation of millions of reads in a single sequencing run. Next-generation sequencing can detect variants at low frequencies, which would go undetected by standard sequencing methods.10 Recently, 2 studies11,12 investigated reliability and reproducibility of NGS technologies to detected HCV minor variants within quasispecies, and their possible implication in the response to treatment with direct acting antivirals (DAAs).
One other study13 evaluated the infection with multiple HCV genotypes by NGS analysis showing high accuracy of this technique in revealing mixed genotype infection.13
As an HCV viral reservoir, peripheral blood mononuclear cells (PBMC) might harbor viral variants distinct from the genotype detected in plasma.14,15 One study16 showed that, although mixed infections at HCV genotype level became evident in only 5.6% of PBMC the culture methodology increased HCV infections with multiple genotypes to 62.5%.
Although PBMC are not the primary site of HCV replication, previous reports emphasize their role as viral reservoirs15,17,18 whereas others19 speculated that HCV diversity in PBMC might be an important determinant of treatment response.
A number of studies20,21,22 suggested that extra-hepatic HCV replication at the end of treatment may be an important factor predicting viral relapse. A recent report23 suggests that HCV–RNA clearance in PBMC after 1 month of treatment may be a reliable predictor of SVR, mainly in patients lacking rapid virological response.
To date, most of these analyses of HCV replication in PBMC have involved a small number of patients. Therefore, it remains unclear if HCV replication in PBMC affects the treatment efficacy, whereas the effect of anti-HCV treatment on the viral population heterogeneity in this compartment is still unknown.
Recently, the development of DAAs has become the standard of care for HCV genotype 1 infection.24 The association treatment with different antivirals in interferon-free and interferon-based therapy represent the future treatment strategy to eradicate the virus. A number of DAAs exhibit variable activity and potency on different genotypes and subtypes.25,26 So, most treatment protocols require the correct identification of the infecting HCV genotype to provide the association and duration of antiviral therapy. In addition to natural occurring resistant strains, also MG may play a role in the success rate of DAAs-based treatment. In this context, the role of these innovative treatments toward patients with MG is unknown so far.
The aim of this study is to determine the presence of MG and the temporal dynamic of HCV infecting genotype in different compartments in HIV/HCV-infected patients under P–R treatment, and speculate on the role of these factors in the treatment response with new direct antivirals differently active on different genotypes and subtypes.
METHODS
Patients
Nineteen HIV/HCV coinfected patients belonging to the pilot, randomized, prospective, multicenter, open label, controlled clinical trial KaMON27 were studied. Briefly, the trial enrolled individuals with age>18 years, confirmed diagnosis of HIV/HCV coinfection, naive for HCV treatment, without liver cirrhosis or with liver cirrhosis with a CD4 + absolute number >350 cells/mm3, on stable HAART and with HIV-RNA < 50 copies/mL at least 6 months before enrollment, no previous anti-HIV protease inhibitor (PI) mutations, no virologic failure to prior PI treatment. The patients were randomized to ritonavir-boosted lopinavir monotherapy (LPV/r; Arm A: 400/100 mg BID) plus anti-HCV therapy (pegylated-IFN-alpha 2a plus ribavirin 0.8–1.2 g/day depending on body weight) or HAART (Arm B: LPV/r and tenofovir/emtricitabine) plus anti-HCV therapy (pegylated-IFN-alpha 2a plus ribavirin 0.8–1.2 g/day depending on body weight). It endured 72 weeks: 48 weeks (W) with HIV/HCV therapy and 24 weeks of HIV treatment only. Hepatitis C virus virological response (HCV–RNA < 12 U/mL) was evaluated at W4, W12, W24, W48 (end of treatment), and W24 post-treatment (W24-PT). Four/nine SVR patients showed a rapid virological response (RVR; HCV–RNA < 12 IU/mL at W4 of treatment).
Coupled plasma samples and PBMC for virological analysis were available at baseline in 19/30 cases (8 nonresponder patients, NR, 2 relapser patients, RE, and 9 SVR) included in the study KaMON. In SVR viral population was investigated at baseline (BL) because HCV–RNA was undetectable at W12 of treatment and thereafter.
In 5 nonresponder (NR), dynamic of viral population was evaluated in paired plasma samples and PBMC obtained at BL, W12, and W24 of treatment. In 2 of these 5 NR, viral population was analyzed also at W24-PT. In 3 NR W24 plasma samples were not available. Additionally, in 2 RE with HCV–RNA undetectable (<12 IU/mL) during P–R treatment, viral population was evaluated at W24-PT. Overall, 36 plasma samples and 32 PBMC specimens were studied by NGS. The patients were considered infected by a difficult to treat genotype (DTG) in the case of infection with HCV-genotype 1 or 4 or infected by an easy to treat genotype (ETG) in the case of infection with genotype 2 or 3.
The study was conducted in accordance with the Good Clinical Practice guidelines and the ethical principles stated in the Declaration of Helsinki. The enrolled patients gave their written informed consent, and the study was approved by the Ethics Committees of all of the participating institutes (ClinicalTrials. gov registration No. NCT00437684).
HCV–RNA detection in Plasma and PBMC compartments
Total RNA was extracted from plasma using the QIAamp Viral RNA kit (QIAGEN) and from 1 × 10⁶ PBMC, using a commercially available kit (TRIzol LS; Gibco, BRL, NY) according to the manufacturer's instructions, and amplified by means of reverse transcriptase polymerase chain reaction (PCR) with primers spanning the highly conserved 5′ NC. Briefly, reverse transcription was performed using an appropriate primer in a volume of 25 μL containing 10 μL isolated RNA and 20 pmol downstream outer primer. After incubation at 37 °C for 60 minutes (min), the complementary DNA was amplified in 50 μL of the PCR mixture containing 10 pmol of an outer primer set: SF1: 5′-GCCATGGCGTTA GTATGAGT-3′; 82–101 nt and SR1: 5′-TGCACGGTCTAC GAGACCTC-3′; 339–320 nucleotide (nt, amplicon lenght 240 base pairs, bp). Amplification was carried out for 25 cycles of 1 min at 94 °C, 30 seconds (s) at 55 °C, and 1 min at 72 °C, with a final 3 min extension at 72 C. For the second PCR, 2 μL of the first amplification products were amplified with 10 pmol of the inner primer set: SF2: 5′- GTG CAG CCT CCA GGA CCC CC-3′; 104–123 nt and SR2: 5′-GGG CAC TCG CAA GCA CCC TAT-3′; 316–296 nt (amplicon lenght 210 bp) under the same cycling conditions. All measures to prevent PCR contamination were strictly applied. Furthermore, at least 2 different PCR products were produced from the same sample in order to exclude the cross contamination of different specimens.
Next-Generation Sequencing
The NGS analysis of 5′NC region was used to determine the presence of MG in different compartments.
First, the 5′NC region was amplified by reverse transcriptase (RT) nested-PCR using the same set of primers (SF1, SR1) for HCV–RNA detection. All primers used for the second round of amplification included a 10-base molecular barcode (MID, multiplex identifier domain, Figure, Supplemental Content 1, http://links.lww.com/MD/A485). To generate amplicons the first round of amplification was performed as described above for HCV–RNA detection, whereas, for the second round, 35.5 μL H2O, 5 μL buffer 10×, 1 μL 10 mMdNTP mix, 3 μL 25 mM MgCl2, 0.5 μL Taq DNA polymerase, and 2 μL 10 μM SR2, and 10-base molecular barcode (1 for each sample analyzed) oligonucleotides was mixed with 1 μL of the first round amplicon. The list of MID used for second round amplification for each sample was summarized in Table, Supplemental Content 2, http://links.lww.com/MD/A485. To verify the quality of amplicon, PCR products were analyzed by using chip Agilent Bioanalyzer DNA 1000. The purified amplicons were quantitated with a fluorescence assay (Quantifluor–ST, Promega) following the manufacturer's instruction. Briefly,1 μL of each purified amplicon was mixed with 2 ml of Hoechst-TNE Working Solution. For clonal amplification purified amplicons were pooled in equimolar amounts.
Clonal amplification on beads (emulsion PCR), beads isolation, and sequencing was performed according to the manufacturer's protocol for the GS FLX platform (454 Life Sciences, Roche company, Branford, CT), obtaining a total of ∼4000 sequences with a mean length of 141 bp. Data analysis was performed by using GS sequencer (version 2.6) for the images and AVA software for the sequences. About 2200 of 4000 sequences obtained from UDPS run were included in our analysis on the basis of amplicon lenght (140 bp at least). A mean of 30 (range 10–61) sequences were analyzed for each sample.
To determinate HCV infecting genotype and to identify MG, a phylogenetic analysis of nucleotide sequences obtained from PCR-positive specimens (plasma samples and PBMC) of each patient was performed. Clustal X, version 1.64 b was used to infer the multiple alignments of the nucleotide sequences. Prototype sequences for each genotype and subtype (GenBank accession numbers: Genotype 1a M62321, Genotype 1b D90208, Genotype 1c AY651061, Genotype 2a D00944, Genotype 2c D31972, Genotype 3a D28917, Genotype 4a Y11604, Genotype 4c FJ462436, and Genotype 4d DQ516083) were added and phylogenetic tree was constructed using Phylip pakage3.67. Of note, by using the 5′NC region for genotyping it was not possible to distinguish between 4c and 4d subtypes because sequences of these 2 genotypes are identical within the evaluated region.
Statistical Analysis
Clinical data were considered for statistical analysis at BL of all 19 patients included in the study. Viral population in plasma and PBMC were considered in SVR at BL, in NR at BL, and during treatment and in RE at BL and W24-PT. The MG information changed for patient (PT) 4 from single to MG during the period of observation. Therefore, this patient was considered as infected by MG since BL. Continuous variables were described by median and interquartile range (IQR), whereas categorical variables by absolute counts and percentages (%).
Univariate Analysis
Data were analyzed using Chi-Square, Fisher exact, or Mann-Whitney U test, when appropriate. A P value of <0.05 was considered statistically significant.
Multivariate Analysis
The aim of the multivariate analysis was to determine the role of covariates in affecting the treatment response variable, as the presence of MG, the HCV viral load (expressed as the logarithm of the result of the HCV–RNA quantitative test), age, HCV infecting genotype, sex, and HCV–RNA detectability in PBMC.
We performed the analysis using a logistic regression model to predict the binary response to treatment with the covariates mentioned above, measured at BL. A P value of < 0.05 was considered statistically significant.
RESULTS
Frequency of MG in the KaMON Study
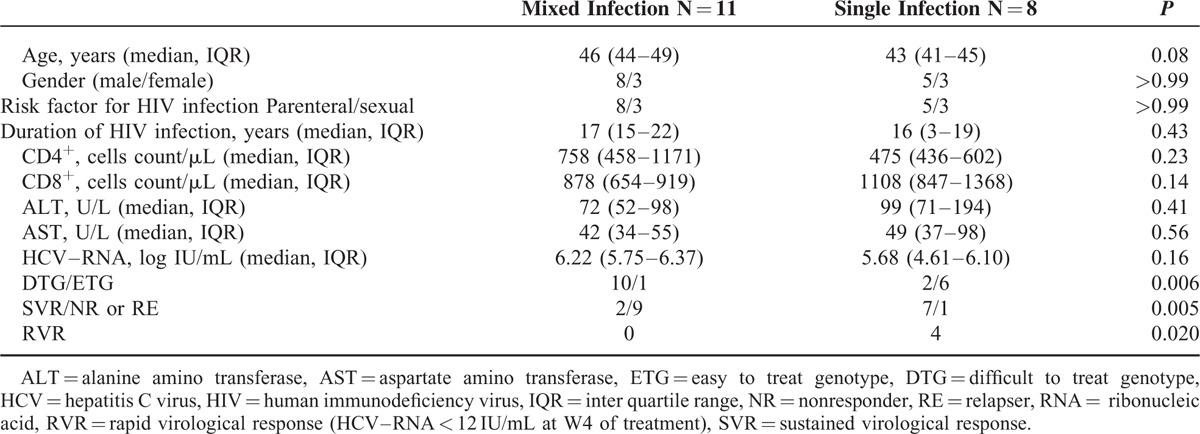
By NGS analysis a high frequency (11/19 cases, 58%) of MG was detected in plasma of this group of HIV/HCV coinfected persons. No differences in regard of demographic data, immune status assessed by CD4+ and CD8+ T cells count, transaminase levels, and HCV load were found between individuals with mixed or single infection (Table 1).
TABLE 1.
Clinical Characteristics of HIV/HCV Coinfected Patients on the Basis of Mixed or Single HCV Infection Evaluated in Plasma Compartment
Frequency of MG According to Antiviral Treatment Response
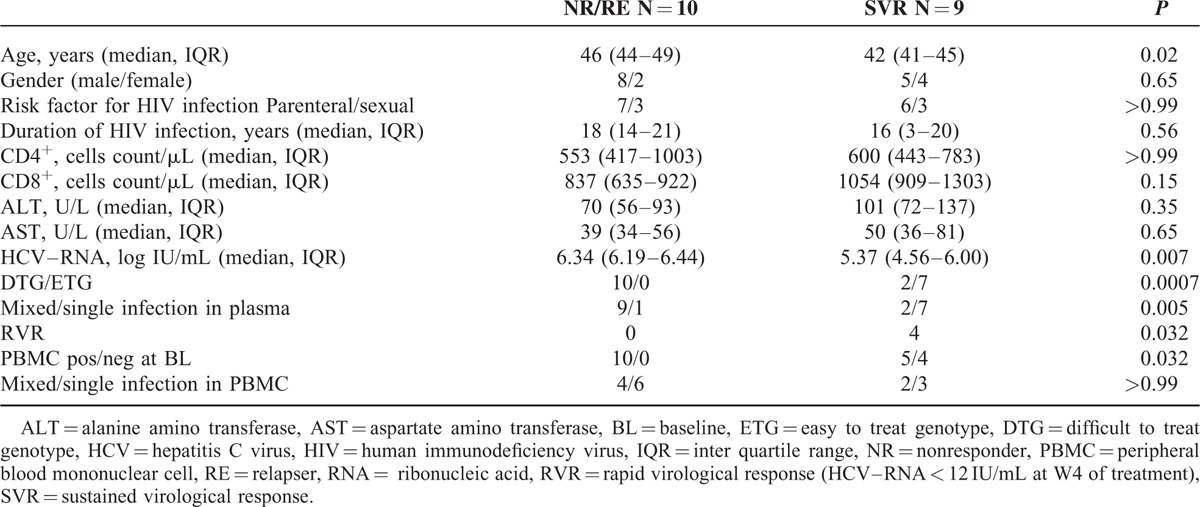
A different distribution of MG was detected in NR with respect to SVR: MG was present in 9/10 patients with no response to P–R treatment, including 8 NR and 1 RE, and in 2/9 SVR patients (P = 0.005).
Four patients with SVR had RVR and none of these 4 patients had MG. A different frequency of RVR was found between individuals with or without MG, P = 0.02.
HCV–RNA was positive in PBMC of 15/19 (73%) patients, at BL. This positivity was more frequent in NR (10/10) than in SVR (5/9); P = 0.03.
As in plasma, also in PBMC a DTG was more frequently detected (9/10 cases) in NR patients, whereas ETG (4/5cases) was prevalent in SVR patients; P = 0.01.
By univariate analysis, in addition to MG, older age, higher HCV–RNA levels, the absence of RVR, infection with DTG as dominant strain and HCV–RNA positivity in PBMC, were significantly associated with treatment failure (P = 0.02, P = 0.007, P = 0.03, P = 0.0007, and P = 0.03, respectively, Table 2).
TABLE 2.
Clinical Characteristics of HIV/HCV Coinfected Patients on the Basis of Response to P–R Treatment
Multivariate analysis (Table, Supplemental Content 3, http://links.lww.com/MD/A485) showed that HCV MG reported a significant negative impact on the probability of treatment response (regression coefficient associated to HCV MG = −3.815, Table, Supplemental Content 3, http://links.lww.com/MD/A485), which can be interpreted as a significant reduction of the probability of response of 0.022 (OR = 0.022, 95% CI = [0.001–0.602]; P = 0.029), whereas HCV–RNA levels (evaluated as unitary increase) showed a trend toward significance (OR 0.17, 95% CI, OR 0.025–1.231; P = 0.07). Hepatitis c virus viral load was retained by the model, meaning that it is a no-redundant variable to allow for the whole model to be significant. The genotype, which is considered to be an important factor in the treatment response process, did not result significant in the multivariate analysis. The infecting genotype, classified as DTG or ETG, was the first variable excluded by the selection procedure (P = 0.999).
Dynamic of MG in Plasma Compartment
The dynamic of viral population in NR/RE during P–R treatment is summarized in Table 3 and Figure 1 . In particular, PT1, in whom ETG strain was already present at BL as minor variant, showed ETG as unique dominant strain during treatment. In this patient at W24-PT, in the absence of P–R pressure, the genomic pattern was the same of that detected at BL. In PT4, ETG was not detected at BL but emerged as unique dominant strain at W24 of therapy and remained as minor variant at W24-PT. In PT6, G4a was present as dominant virus at BL and W12 of treatment, whereas at W24 was replaced, as dominant strain by G4c/d. Unfortunately, in this case it was not possible to evaluate W24-PT viral population because the plasma sample was not available at this time point. During the observation period, 3 NR patients (PT3, PT5, PT7) maintained the same DTG detected as dominant at BL. Two other patients (PT2, PT8) showed a conserved virological pattern during treatment. Finally, PT 10 had evidence of HCV single infection during all the observation period. Concerning 2 SVR patients with MG, an ETG was dominant in one subject and a DTG in the other one.
TABLE 3.
Viral Population Analysis by Next-Generation Sequencing During Treatment With P–R and Posttreatment Follow-Up (HCVG–W24PT) in HIV/HCV Coinfected Individuals
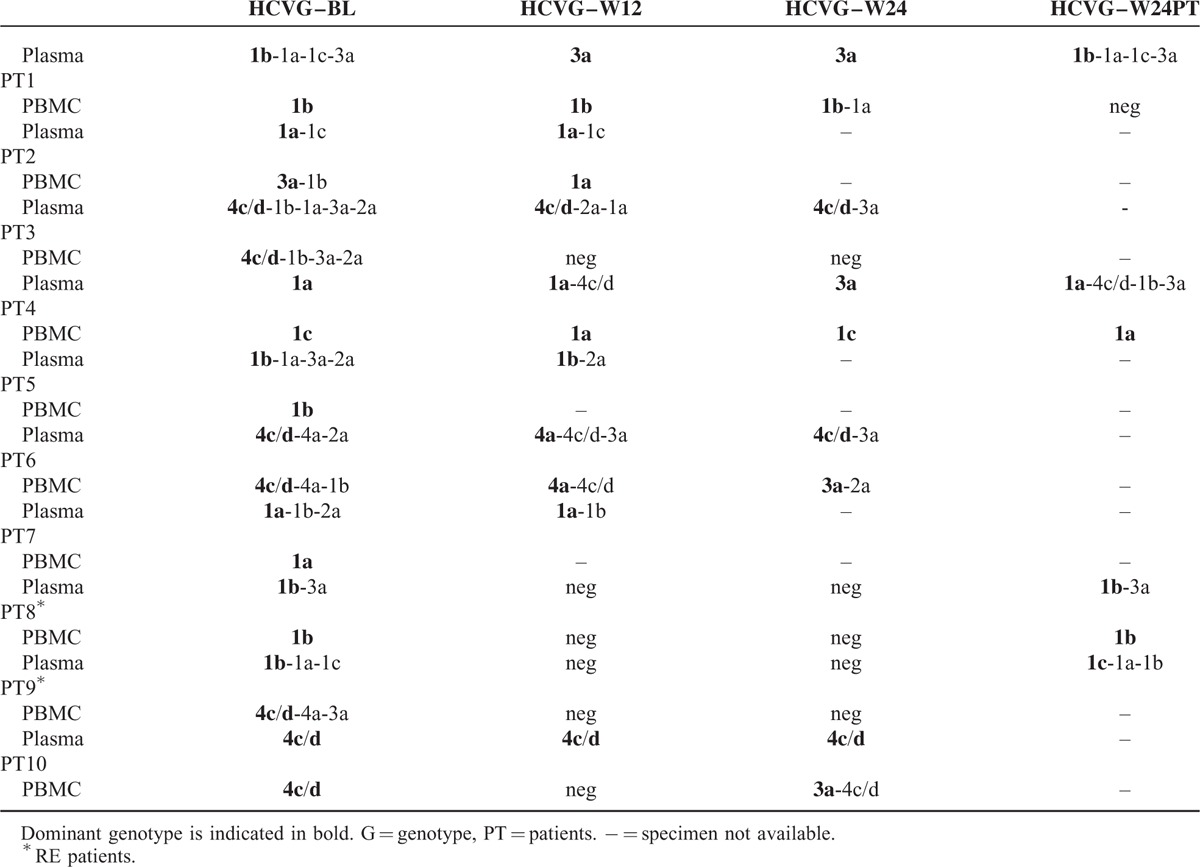
FIGURE 1.
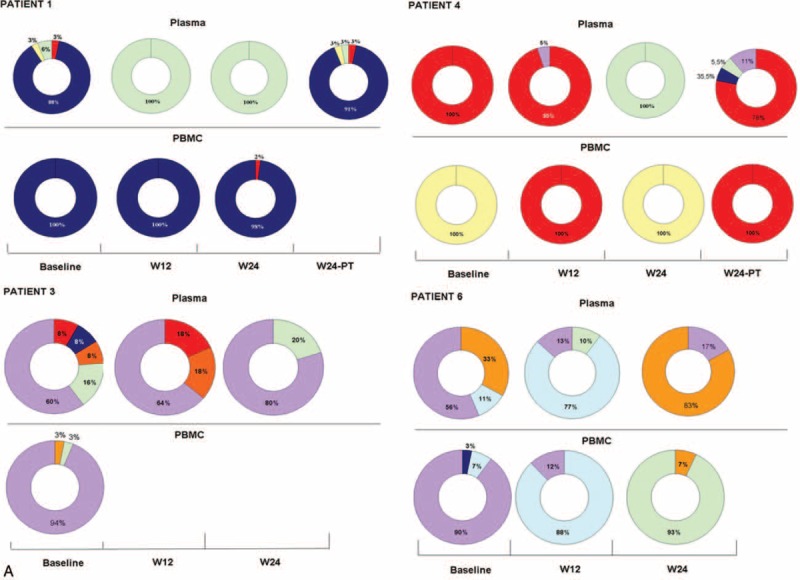
Dynamic of viral population detected by next-generation sequencing in plasma and PBMC of NR/RE patients during P–R treatment: the ring chart represents the percentage of HCV infecting genotypes (A) NR with at least 3 sequential plasma samples tested. (B) NR with plasma samples tested at BL and W12. (C) In RE, plasma samples were tested at BL and W24-PT because HCV–RNA was undetectable at W12 and W24 of treatment. Each genotype is identified by a different color: G1a = red, G1b = blue, G1c = yellow, G2a = orange, G3a = green, G4a = light blue, and G4c/d = violet. BL = baseline, HCV = hepatitis C virus, NR = nonresponder, PBMC = peripheral blood mononuclear cell, RE = relapser, RNA = ribonucleic acid.
Of the other 7 SVR, a single infection with ETG was detected in 6, whereas DTG was found in the remaining one. The distribution of HCV genotype identified at BL and the pattern of viral population in SVR are summarized in Figure 2.
FIGURE 1 (Continued).
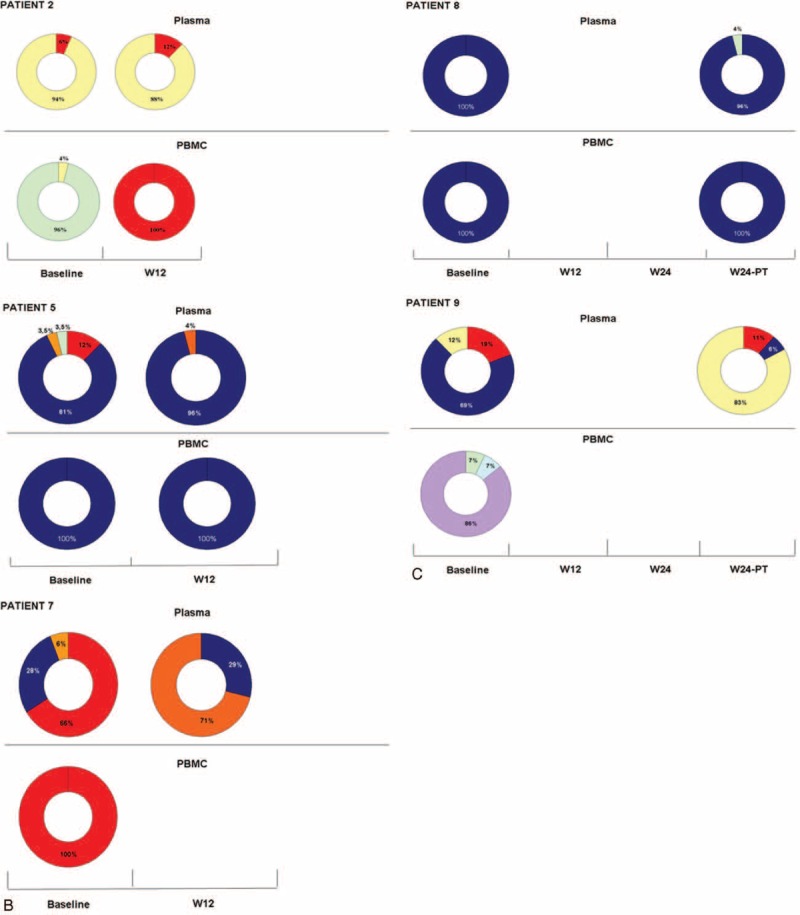
Dynamic of viral population detected by next-generation sequencing in plasma and PBMC of NR/RE patients during P–R treatment: the ring chart represents the percentage of HCV infecting genotypes (A) NR with at least 3 sequential plasma samples tested. (B) NR with plasma samples tested at BL and W12. (C) In RE, plasma samples were tested at BL and W24-PT because HCV–RNA was undetectable at W12 and W24 of treatment. Each genotype is identified by a different color: G1a = red, G1b = blue, G1c = yellow, G2a = orange, G3a = green, G4a = light blue, and G4c/d = violet. BL = baseline, HCV = hepatitis C virus, NR = nonresponder, PBMC = peripheral blood mononuclear cell, RE = relapser, RNA = ribonucleic acid.
FIGURE 2.
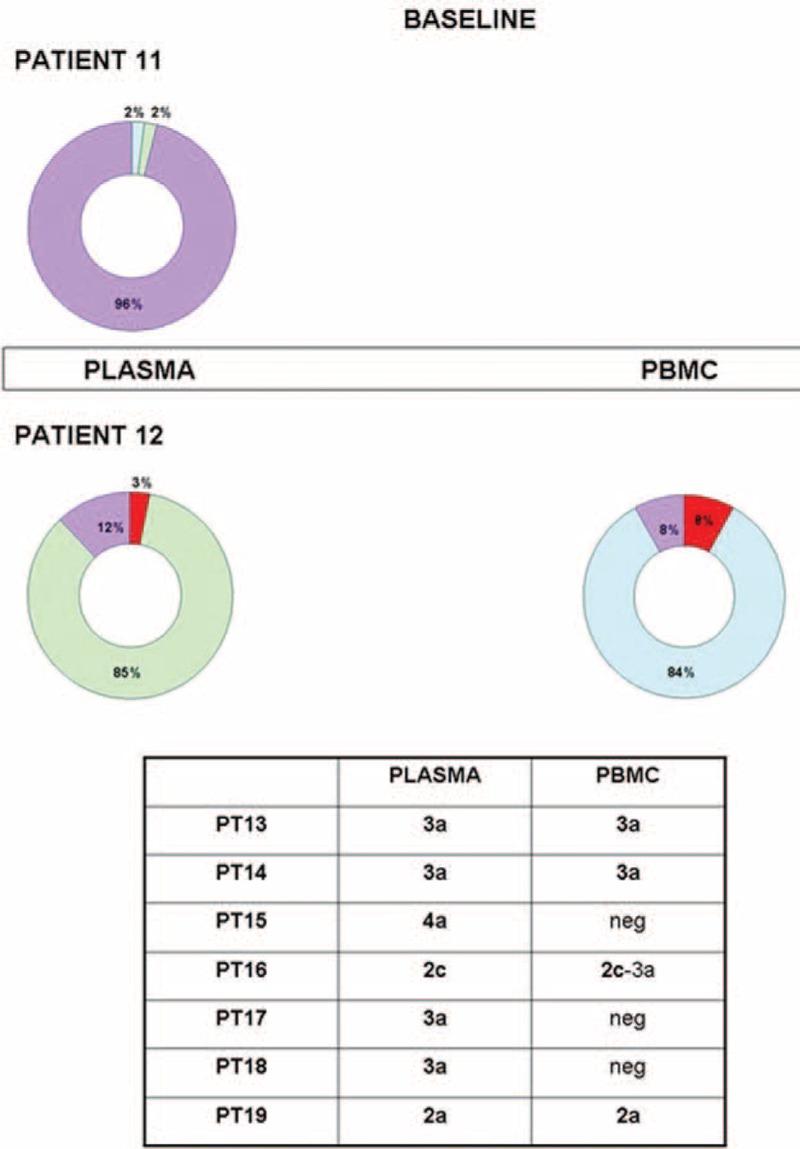
Distribution of HCV genotypes in plasma and PBMC of SVR patients. The ring chart represents the percentage of HCV infecting genotypes; HCV–RNA was undetectable in PBMC of PT11. Each genotype is identified by a different color: G1a = red, G3a = green, G4a = light blue, and G4c/d = violet. Data concerning SVR infected by a unique genotype in plasma are summarized below the chart. HCV = hepatitis C virus, NR = nonresponder, PBMC = peripheral blood mononuclear cell, RNA = ribonucleic acid, SVR = sustained virological response.
Dynamic of MG in PBMC Compartment
Dynamic of HCV infection in PBMC of NR/RE patients is summarized in Table 3 and Figure 1 . A similar distribution of MG in PBMC compartment was detected between NR/RE and SVR; 6/15 (40%) HCV–RNA positive cases had an MG infection: 4 of whom were NR/RE (PT2, PT3, PT6, PT9). Among these, 3 patients harbored a DTG as dominant strain, and the remaining 1(PT2) an ETG. Among SVR, 2/5 HCV–RNA PBMC-positive cases had an MG with dominance of ETG and DTG, respectively (Figure 2). Of note, in 2 NR patients (PT1, PT10) with single infection at BL, an MG was revealed during treatment. In PT1 HCV–RNA became undetectable at W24-PT.
Interestingly, HCV–RNA was found negative in PBMC at W12 and W24 of treatment in the 2 patients that relapsed the infection after treatment.
Comparison of Viral Population Between Two Different Compartments (Plasma and PBMC)
At BL evaluation, among individuals found positive in both compartments (plasma and PBMC) a concordant genotype as dominant was observed in 5/8 NR, 1/2 RE, and 4/5 SVR, P = 0.60.
During treatment, in 3 NR (PT1, PT4, PT6) a discordant genotype was detected as dominant in plasma and PBMC. Two (PT4, PT6) of these 3 patients also had a discordant genotype in the 2 compartments at BL.
DISCUSSION
Hepatitis C genotype and viral kinetics on treatment have been suggested to be the most important viral factors affecting the treatment response.4 The dynamic of HCV MG in different compartments and its correlation with response to P–R treatment has never been set up before in HIV/HCV coinfected persons. These patients, depending on the risk factor, may be more frequently exposed to MG.28 A possible explanation for the lack of information concerning the extent and the response rate in MG infection might be the low sensitivity of biological approach to detect MG. Second, in clinical trials the inclusion of patients with MG is not allowed, rendering this data not available in large groups of patients. In the present study, we had the opportunity to precisely estimate the rate of MG by using a highly sensitive method “NGS”, showing a high frequency (58%) of MG in a group of HIV/HCV coinfected patients under P–R treatment.
Our result is in line with that of other studies8,9 performed in parenterally transmitted infection risk groups and using highly sensitive strategies to detect MG.
By univariate analysis, MG was found to be associated with virological response to P–R treatment, in addition to some factors already known to be involved in the response to P–R treatment: age, HCV-viral load, genotype, and RVR.
In this context, RVR is known to be a strong predictor of SVR,29–30 whereas no data are available on the correlation between RVR and MG. In the present study we found that RVR was more frequent in individuals with single infection respect to those with MG. One other viral factor, which could influence the response rate, was the presence of HCV genomic sequences in PBMC. Inglot et al31 suggested that the replication of HCV in this compartment could be a potential marker for treatment response. A number of studies20–22 showed that HCV–RNA positivity in PBMC of patients that attained end of treatment virologic response is associated with relapse of infection in the post-treatment phase.
In the present study, HCV–RNA was more frequently detected in PBMC of NR than in SVR. Only 2 RE patients were included; therefore, it was not possible to evaluate the correlation between HCV–RNA persistence in PBMC and reactivation of the infection in the post-treatment phase.
Our data, although obtained in a small group of patients, suggested that replication of HCV in PBMC rather than viral population complexity in this compartment assessed by detection of MG, may play a role in the treatment success rate.
By multivariate analysis we showed that the probability of response to P–R treatment was negatively and significantly affected mainly by an MG, whereas HCV load showed a trend toward significance and HCV infecting genotype per se together with HCV–RNA positivity in PBMC did not reach statistical significance. To our knowledge, only 1 study32 evaluated the effect of mixed genotypes 1 to 2 infection on the response during P–R treatment, showing that individuals infected with multiple genotypes had a response rate similar to those infected by a single genotype. The study was retrospective, conducted in Japan where genotype 1 is prevalent, and performed in HIV-negative patients. Additionally, clinical data obtained in MG were compared with those of historical controls. Therefore, the different geographic origin of their and our patients, the different population analyzed in terms of risk factor for HCV infection, the concurrent infection with HIV in our study group, and the fact that Huang et al32 performed a cross-sectional study, may be responsible for the discrepant results.
Interestingly, 2 patients showed during P–R treatment, the emergence of an ETG as unique dominant strain in the plasma that subsequently became a minor variant. In these 2 patients, the same genotype detected at baseline re-emerged as dominant strain after treatment. It is unlikely a super-infection with a new virus because these 2 patients denied unprotected sexual contacts and intra venous drug injection. Additionally, the genotype detected during P–R treatment was present, albeit as minor variant, at baseline evaluation. We formed the hypothesis that alternance of DTG and ETG could be related to a different sensitivity of different genotypes to interferon specifically in these hosts.
In regard of discordant HCV genotypes in different compartments, the detection of a different dominant genotype in plasma and PBMC in some patients could be related to a different capacity of replication of a specific strain in these 2 compartments and/or different pressure exerted by IFN in plasma and PBMC. To our knowledge, this is the first study exploring by next-generation sequencing the extent of MG and dynamic of viral population in different compartments (plasma and PBMC) during P–R treatment.
There are some limitations for this study that warrant further research. A larger samples size will benefit more statistical power for molecular tests. In particular, it could be of interest to evaluate the presence/absence of MG infection in SVR patients infected by DTG (G1–4). However, our data generated a precise information on mixed infection dynamic during the course of P–R treatment in different compartments. We showed that HIV/HCV coinfected patients may harbor multiple and discordant HCV genotypes in the different compartments explored and that the presence of MG in plasma samples may be a potential marker of poor treatment response. This finding could have important clinical implication especially in the case of association treatment with new antivirals targeting a specific genotype, because these drugs could be less effective in MG.
Footnotes
Abbreviations: 5′NC = 5′noncoding region, BL = baseline, CI = confidence interval, DAA = direct antiviral agent, DTG = difficult to treat genotype, ETG = easy to treat genotype, HCV = hepatitis C virus, MG = mixed genotypes infection, MID = multiplex identifier domain, NGS = next-generation sequencing, NR = nonresponder, OR = odds ratio, PBMC = peripheral blood mononuclear cell, Peg-IFN = Peg-interferon, P–R = Peginterferon/ribavirin, PT = patient, RE = relapser, RFLP = restriction fragment length polymorphism, SVR = sustained virological response, W = week, W24-PT = week 24 post-treatment.
Funding Section: Internal funding supported this study.
Conflict of Interest: A.L. has acted as a consultant or participated in advisory board as a speaker or in the conduct of clinical trials for Abbott, BMS, Gilead, Tibotec, MSD, Roche, GSK, Pfizer and BI.
The author reports no conflicts of interest.
Supplemental digital content is available for this article. Direct URL citations appear in the printed text and are provided in the HTML and PDF versions of this article on the journal's Website (www.md-journal.com).
REFERENCES
- 1.Simmonds P, Bukh J, Combet C, et al. Consensus proposals for a unified system of nomenclature of hepatitis C virus genotypes. Hepatology 2005; 42:962–973. [DOI] [PubMed] [Google Scholar]
- 2.Murphy DG, Chamberland J, Dandavino R. Sablon E.A new genotype of hepatitis C virus originating from Central Africa. Hepatology 2007; 46:623A. [DOI] [PMC free article] [PubMed] [Google Scholar]
- 3.Murphy DG, Willems B, Deschênes M, et al. Use of sequence analysis of the NS5B region for routine genotyping of hepatitis C virus with reference to C/E1 and 5′ untranslated region sequences. J Clin Microbiol 2007; 45:1102–1112. [DOI] [PMC free article] [PubMed] [Google Scholar]
- 4.Zeuzem S, Hultcrantz R, Bourlie‘re M, et al. Peginterferon alfa-2b plus ribavirin for treatment of chronic hepatitis C in previously untreated patients infected with HCV genotypes 2 or 3. J Hepatol 2004; 40:993–999. [DOI] [PubMed] [Google Scholar]
- 5.Lau JY, Mizokami M, Kolberg JA, et al. Application of six hepatitis C virus genotyping systems to sera from chronic hepatitis C patients in the United States. J Infect Dis 1995; 171:281–289. [DOI] [PubMed] [Google Scholar]
- 6.Viazov S, Widell A, Nordenfelt E. Mixed infection with two types of hepatitis C virus is probably a rare event. Infection 2000; 28:21–25. [DOI] [PubMed] [Google Scholar]
- 7.Tuveri R, Rothschild C, Pol S, et al. Hepatitis C virus genotypes in French haemophiliacs: kinetics and reappraisal of mixed infections. J Med Virol 1997; 51:36–41. [DOI] [PubMed] [Google Scholar]
- 8.Chakravarti A, Verma V. Distribution of hepatitis C virus genotypes in beta-thalassaemic patients from Northern India. Transfus Med 2006; 16:433–438. [DOI] [PubMed] [Google Scholar]
- 9.Soriano V, Nedjar S, García-Samaniego J, et al. High rate of co-infection with different hepatitis C virus subtypes in HIV-infected intravenous drug addicts in Spain. Hepatitis HIV Spanish Study Group. J Hepatol 1995; 22:598–599. [DOI] [PubMed] [Google Scholar]
- 10.Barzon L, Lavezzo E, Militello V, et al. Applications of next-generation sequencing technologies to diagnostic virology. Int J Mol Sci 2011; 12:7861–7878. [DOI] [PMC free article] [PubMed] [Google Scholar]
- 11.Larrat S, Kulkarni O, Claude JB, et al. Ultra deep pyrosequencing of NS3 to predict response to triple therapy with protease inhibitors in previously treated chronic hepatitis C patients. J Clin Microbiol 2015; 53:389–397. [DOI] [PMC free article] [PubMed] [Google Scholar]
- 12.Gregori J, Esteban JI, Cubero M, et al. Ultra-deep pyrosequencing (UDPS) data treatment to study amplicon HCV minor variants. PLoS One 2013; 8:e83361. [DOI] [PMC free article] [PubMed] [Google Scholar]
- 13.Qiu P, Stevens R, Wei B, et al. HCV genotyping from NGS short reads and its application in genotype detection from HCV mixed infected plasma. PLoS One 2015; 10:e0122082. [DOI] [PMC free article] [PubMed] [Google Scholar]
- 14.Bagaglio S, Cinque P, Racca S, et al. Hepatitis C virus populations in the plasma, peripheral blood mononuclear cells and cerebrospinal fluid of HIV/hepatitis C virus-co-infected patients. AIDS 2005; 19:S151–S165. [DOI] [PubMed] [Google Scholar]
- 15.Roque-Afonso AM, Ducoulombier D, Di Liberto G. Compartmentalization of hepatitis C virus genotypes between plasma and peripheral blood mononuclear cells. J Virol 2005; 79:6349–6357. [DOI] [PMC free article] [PubMed] [Google Scholar]
- 16.Parodi C, Culasso A, Aloisi N, et al. Evidence of occult HCV genotypes in haemophilic individuals with unapparent HCV mixed infections. Haemophilia 2008; 14:816–822. [DOI] [PubMed] [Google Scholar]
- 17.Radkowski M, Gallegos-Orozco JF, Jablonska J, et al. Persistence of hepatitis C virus in patients successfully treated for chronic hepatitis C. Hepatology 2005; 41:106–114. [DOI] [PubMed] [Google Scholar]
- 18.Pham TN, MacParland SA, Mulrooney PM, et al. Hepatitis C virus persistence after spontaneous or treatment-induced resolution of hepatitis C. J Virol 2004; 78:5867–5874. [DOI] [PMC free article] [PubMed] [Google Scholar]
- 19.Blackard JT, Hiasa Y, Smeaton L, et al. Compartmentalization of hepatitis C virus (HCV) during HCV/HIV coinfection. J Infect Dis 2007; 195:1765–1773. [DOI] [PMC free article] [PubMed] [Google Scholar]
- 20.Xu DZ, Xie Y, Li ZQ. Clearance of HCV RNA in peripheral blood mononuclear cell as a predictor of response to antiviral therapy in patients with chronic hepatitis C. Hepatobiliary Pancreat Dis Int 2005; 4:550–553. [PubMed] [Google Scholar]
- 21.Majda-Stanisławska E, Bednarek M, Jóźwiak B, et al. Effect of interferon alfa and ribavirin treatment on hepatitis C virus RNA in serum and peripheral blood mononuclear cells in children with hepatitis C. Acta Gastroenterol Belg 2006; 69:187–190. [PubMed] [Google Scholar]
- 22.de Felipe B, Leal M, Soriano-Sarabia N, et al. HCV RNA in peripheral blood cell subsets in HCV-HIV coinfected patients at the end of PegIFN/RBV treatment is associated with virologic relapse. J Viral Hepat 2009; 16:21–27. [DOI] [PubMed] [Google Scholar]
- 23.Coppola N, De Pascalis S, Pisaturo M, et al. Sustained virological response to antiviral treatment in chronic hepatitis C patients may be predictable by HCV-RNA clearance in peripheral blood mononuclear cells. J ClinicalVirol 2013; 58:748–750. [DOI] [PubMed] [Google Scholar]
- 24.Butt AA, Kanwal F. Boceprevir and telaprevir in the management of hepatitis C virus-infected patients. Clin Infect Dis 2011; cir774. [DOI] [PubMed] [Google Scholar]
- 25.Jacobson IM, Gordon SC, Kowdley KV, et al. Sofosbuvir for hepatitis C genotype 2 or 3 in patients without treatment options. N Engl J Med 2013; 368:1867–1877. [DOI] [PubMed] [Google Scholar]
- 26.Cento V, Mirabelli C, Salpini R, et al. HCV genotypes are differently prone to the development of resistance to linear and macrocyclic protease inhibitors. PloS One 2012; 7:e39652. [DOI] [PMC free article] [PubMed] [Google Scholar]
- 27.Hasson H, Galli L, Gallotta G, et al. HAART simplification with lopinavir/ritonavir monotherapy in HIV/HCV co-infected patients starting anti-HCV treatment: a randomised pilot study (KaMon study). New Microbiol 2012; 35:469–474. [PubMed] [Google Scholar]
- 28.Tanimoto T, Nguyen HC, Ishizaki A, et al. Multiple routes of hepatitis C virus transmission among injection drug users in HaiPhong, Northern Vietnam. J Med Virol 2010; 82:1355–1363. [DOI] [PubMed] [Google Scholar]
- 29.Corchado S, López-Cortés L, Rivero-Juárez A, et al. Liver fibrosis, host genetic and hepatitis C virus related parameters as predictive factors of response to therapy against hepatitis C virus in HIV/HCV coinfected patients. PLoS One 2014; 9:e101760. [DOI] [PMC free article] [PubMed] [Google Scholar]
- 30.Wu Q, Zhan FY, Chen EQ, et al. Predictors of pegylated interferon alpha and ribavirin efficacy and long-term assessment of relapse in patients with chronic hepatitis C: a one-center experience from China. Hepat Mon 2015; 15:e28836. [DOI] [PMC free article] [PubMed] [Google Scholar]
- 31.Inglot M, Pawlowski T, Szymczak A, et al. Replication of hepatitis C virus in peripheral blood mononuclear cells in patients with chronic hepatitis C treated with pegylated interferon alpha and ribavirin. Postepy Hig Med Dosw 2013; 67:186–191. [DOI] [PubMed] [Google Scholar]
- 32.Huang CI, Huang CF, Huang JF, et al. Treatment efficacy of pegylated interferon plus ribavirin therapy in chronic hepatitis C patients with mixed genotype 1/2 infection. J Gastroenterol Hepatol 2014; 29:1012–1018. [DOI] [PubMed] [Google Scholar]


