Abstract
Objective:
To determine the accuracy of MRI in differentiating mucinous cystoadenomas (MCAs) from mucinous cystoadenocarcinomas (MCACs) of the pancreas, with histopathological analysis as the reference standard, for better surgical planning.
Methods:
A total of 65 patients with histopathologically proven mucinous cystic neoplasms (MCNs) underwent MRI and surgery. Quantitative image analysis included size, septa and wall thickness and number of loculations. Qualitative image analysis included nodules; hyperintensity of the cystic content on T1 weighted images; compression and/or infiltration of adjacent vessels or organs; and metastases. A comparison between MCAs and MCACs was performed with Student’s t-test for quantitative variables and with Fisher test for qualitative variables. Receiver operating characteristic analysis was performed to determine the accuracy in the differential diagnosis between MCAs and MCACs on the basis of a score system obtained by giving 1 point for each quantitative and qualitative variable observed in each patient.
Results:
At histopathology, 43 lesions were MCAs and 22 lesions were MCACs. A statistically significant difference was observed for size >7cm (<0.001), septa and wall thickness >3 mm (<0.0001), number of loculations >4 (<0.0001), nodules (<0.0001), hyperintensity of the cystic content on T1 weighted images (<0.0001), compression (<0.01) and/or infiltration (<0.01) of adjacent vessels or organs and metastases (<0.05). The best cut-off value to discriminate MCAs from MCACs was the presence of three features (p < 0.001), with an accuracy of 91%.
Conclusion:
MRI has an accuracy of 91% in the differential diagnosis between MCA and MCAC, helping in identifying forms that could undergo parenchyma-sparing surgery (MCAs), reducing post-surgical morbidity and mortality.
Advances in knowledge:
In this study, the differentiation between MCAs and MCACs of the pancreas by means of MRI is addressed. The differential diagnosis allows selecting benign forms, susceptible of parenchyma-sparing surgery, with the advantage of reducing post-surgical morbidity and stratifying prognosis of MCNs.
INTRODUCTION
Mucinous cystic neoplasms (MCNs) of the pancreas are rare pancreatic cystic lesions, representing 23% of all cystic pancreatic tumours.1 MCNs occur usually in females from 3rd to 7th decade, with a peak incidence in the 5th decade (mean age 49 years).2 Histologically, they are characterized by mucin-producing epithelial cells with an “ovarian-like” stroma,3 probably owing to the degeneration of embryologic remnants of the left primordial ovarian gonad in the dorsal pancreatic bud.4 Epithelial cells of MCNs delimit a cystic cavity that typically does not communicate with the ductal pancreatic system.5 According to the World Health Organization classification,2 MCNs are classified according to the grade of dysplasia of the epithelium of the cysts as follows: cystoadenomas (low-grade dysplasia), borderline MCNs (moderate-grade dysplasia) and cystoadenocarcinomas (high-grade dysplasia); cystoadenocarcinomas can be “in situ” or invasive based on the presence of stromal invasion, although all MCNs of the pancreas, beyond their epithelial differentiation, should be resected surgically6 because of potential malignant transformation of benign forms, according to the already demonstrated adenomacarcinoma sequence.2 Recent studies have demonstrated some differences in terms of prognosis and therapy between benign and malignant forms of MCNs.7–12 Concerning prognosis, it has been demonstrated that benign forms have a 5-year survival rate of 100%, with no local recurrence at 57-month follow-up, while malignant forms have a 5-year survival rate of 57%,7 similar to that of malignant forms of intraductal papillary mucinous neoplasms. Furthermore, the 5-year survival rate of invasive forms of MCNs is <20%, similar to that of ductal adenocarcinoma of the pancreas.13
Concerning therapy, “parenchyma-sparing” surgical procedures such as distal pancreatectomy without splenectomy,7,12,14,15 middle pancreatectomy8,16 or enucleation8,10 have been suggested to reduce the risk of post-operative endocrine and/or exocrine pancreatic insufficiency and to preserve the spleen.7–10
For benign MCNs <3 cm in size and without mural nodules, clinical radiological follow-up has been suggested.8,17–19 Nowadays, there are only a few published studies to distinguish benign forms of MCNs from malignant forms of MCNs based on CT.9,20
Furthermore, in a recently published study, Theruvath et al21 proved the lower effectiveness of CT compared with MRI in predicting the diagnosis of MCNs, but at present there are no published studies based on MRI to distinguish benign forms of MCNs from malignant forms of MCNs.
The aim of this study was to identify MRI features to differentiate mucinous cystoadenomas (MCAs) from mucinous cystoadenocarcinomas (MCACs) of the pancreas for better surgical planning and prognostic definition, with histopathological analysis as the reference standard.
METHODS AND MATERIALS
Patient population
This retrospective study was approved by our investigational review board, and the requirement for informed consent was waived.
A search of our institution's medical records, pathology and radiology databases from January 2006 to December 2014 revealed 104 patients in whom MCN was diagnosed and who were subsequently considered for inclusion in this retrospective study.
Patients were included if they had histopathologically proven MCN and undergone a surgical procedure and pre-operative MRI. Patients were excluded if they had not had histopathological confirmation (n = 15) and did not undergo MRI but had other diagnostic investigations (n = 24).
Thus, our study population consisted of 65 patients, of whom 63 patients were female and 2 patients were male (mean age, 46.7 years; age range, 22–76 years).
MRI
MRI was performed on two 1.5 T scanners, MAGNETOM® Symphony, (Siemens, Erlangen, Germany) and Ingenia, Philips Medical Systems (Eindhoven, Netherlands), using a 4-channel phased-array coil and a 32-channel phased-array coil, respectively.
The patients were asked to fast from solid food 4–6 h before the examination. Furthermore, to eliminate overlapping fluid-containing organs on T2 weighted images, a negative contrast agent was administered before MRI. This consisted of 50–150 ml of superparamagnetic iron oxide particles (ferumoxsil, Lumirem, Guerbet, Aulnaysous-Bois, France) or grapefruit juice administered 5–15 min before the beginning of the examination. No antiperistaltic drug was administered.
MRI protocol for the two scanners is summarized in Tables 1 and 2, respectively. It consisted of T1 and T2 weighted images with and without fat saturation of the upper abdomen on axial and coronal planes. Then, MR cholangiopancreatography imaging was performed to include the entire biliary tree and pancreatic ductal system at different angles (3–10 acquisitions).
Table 1.
MRI protocol—Siemens (Erlangen, Germany)
| Pulse sequence | Imaging plane | Repetition time (ms) | Echo time (ms) | Section thickness (mm) |
|---|---|---|---|---|
| Chemical shift T1 weighted GRE in phase | Axial | 160 | 4.6 | 7–8 |
| Chemical shift T1 weighted GRE out of phase | Axial | 107 | 2.3 | 7–8 |
| Fat-saturated T2 weighted RARE | Axial | 4000–4950 | 91–102 | 6–8 |
| T2 weighted half-Fourier RARE | Coronal and axial | ∞ | 60–102 | 6–8 |
| Two-dimensional half-Fourier RARE MRCP | Coronal and coronal-oblique | ∞ | 1100 | 40–80 |
| Three-dimensional volumetric GRE VIBE (dynamic phase) | Axial | 4.66 | 1.87 | 2.6–3 |
GRE, gradient echo; MRCP, MR cholangiopancreatography; RARE, rapid acquisition with relaxation enhancement; VIBE, volumetric interpolated breath-hold examination.
Table 2.
MRI protocol—Philips Medical Systems (Eindhoven, Netherlands)
| Pulse sequence | Imaging plane | Repetition time (ms) | Echo time (ms) | Section thickness (mm) |
|---|---|---|---|---|
| Chemical shift T1 weighted GRE in phase | Axial | 160 | 4.6 | 5 |
| Chemical shift T1 weighted GRE out of phase | Axial | 160 | 2.3 | 5 |
| Fat-suppressed T2 weighted RARE | Axial | 8000–8500 | 80 | 5 |
| T2 weighted half-Fourier RARE | Coronal and axial | ∞ | 80–90 | 5 |
| Two-dimensional half-Fourier RARE MRCP | Coronal and coronal oblique | ∞ | 900 | 40–80 |
| T1 weighted FFE Dixon (dynamic phase) | Axial | 4 | 1.8 | 3 |
FFE, fast field echo; GRE, gradient echo; MRCP, MR cholangiopancreatography; RARE, rapid acquisition with relaxation enhancement.
Finally, a dynamic imaging during gadolinium chelate injection was performed with a three-dimensional volumetric gradient-echo pulse sequence with fat saturation along the axial plane.
A quadriphasic dynamic examination was performed during injection of 0.1 mmol per kilogram of body weight gadolinium chelates (MultiHance®, Bracco Imaging, Milan, Italy) with a power injector (Medrad® Spectris Solaris®; Medrad, Pittsburgh, PA) at a rate of 2–2.5 ml sec−1; images were acquired in the pre-contrast, pancreatic (35–45 s after injection), portal venous (75–80 s after injection) and delayed (180 s after injection) phases.
Image analysis
MR images were independently analysed by two radiologists (VDP, NC both with 6 years’ experience in gastrointestinal radiology) who were aware of the diagnosis of MCN but were unaware of the histopathological classification (adenoma, borderline and carcinoma).
Subsequently, image interpretation discrepancies were resolved by consensus. Image analysis was performed at a workstation.
Quantitative image analysis included measurement of the maximum diameter of the lesion on axial and coronal planes, maximum thickness of the septa and of the wall on axial and coronal planes and number of loculations. These parameters were evaluated on T2 weighted images.
Qualitative image analysis included the assessment of the presence or absence of the following parameters: mural nodules; T1 hyperintensity of the cystic content in respect of signal intensity of the liquor (evaluated on fat-saturated T1 weighted gradient-echo images before contrast administration); compression and/or infiltration of adjacent organs and vessels (defined, respectively, by the presence of smooth vs irregular margins between these structures and the lesion); hepatic and lymph node metastases. The MR findings were subsequently compared with the histopathological data.
Histopathological analysis
The surgical histopathological examination represented the reference standard in this study.
At histopathological analysis, MCNs were classified into cystoadenomas, borderline tumours and cystoadenocarcinomas according to the World Health Organization classification.2
Subsequently, histopathological findings from the surgical specimen were compared with the imaging findings.
For data analysis, the patients were divided into two groups: patients with mucinous cystoadenomas (MCAs) and patients with borderline tumours and cystoadenocarcinomas (MCACs).
Statistical analysis
Interobserver agreement for each single parameter was assessed with intraclass correlation coefficient for quantitative variables and with k statistics for qualitative variables. The strength of agreement was assessed as follows: a value of <0.20 indicated poor agreement; a value of 0.21–0.40, fair agreement; a value of 0.41–0.60, moderate agreement; a value of 0.61–0.80, good agreement; and a value of 0.81–1.00, excellent agreement. The comparison between the two subgroups (MCAs and MCACs) was performed by means of Student’s t-test for the quantitative variables and by Fisher test for qualitative variables.
For each quantitative variable, receiver operating characteristic (ROC) analysis with the determination of the Youden index was performed to identify the best cut-off value in order to differentiate MCAs from MCACs. Subsequently, the sensitivity, specificity, accuracy, negative-predictive value (NPV) and positive-predictive value (PPV), in predicting lesion malignancy, were calculated by using the best cut-off value of each quantitative variable.
The sensitivity, specificity, accuracy, NPV and PPV, in predicting the malignancy of the lesion, were also calculated for qualitative variables.
Furthermore, the κ-Cohen test was performed to evaluate the agreement of each quantitative variable (at its best cut-off value) and qualitative variable on the malignancy of the lesion.
Finally, a score was assigned to each patient according to the presence of the quantitative variables (at their best cut-off value) and qualitative variables, giving 1 point to each of them when present because they were considered as “high-risk MRI features”. The ROC analysis with the determination of the Youden index was performed to evaluate the best cut-off value of the score in order to differentiate MCAs from MCACs.
RESULTS
At histopathological examination of the surgical specimen, 43 of 65 (66%) MCNs were classified as cystoadenomas, 6 of 65 (9%) MCNs were classified as borderline tumours, 8 of 65 (12%) MCNs were classified as cystoadenocarcinomas in situ and 8 of 65 (12%) MCNs were classified as invasive cystoadenocarcinomas.
Furthermore, histopathological findings revealed 43 of 65 (66%) MCAs and 17 of 65 (26%) MCACs.
All MCNs (65/65, 100%) were located in the body/tail of the pancreas. Mean age was 45.1 years for MCAs and 48.4 years for MCACs.
Quantitative analysis
The mean values of lesion size, septa and wall thickness and number of loculations for MCAs and MCACs with their respective interobserver agreement values are reported in Table 3.
Table 3.
Quantitative analysis
| MRI features | Group | Mean ± standard deviation | p-value | Interobserver agreement (ICC) |
|---|---|---|---|---|
| Size (cm) | MCAs | 6.1 ± 3.2 | <0.001 | 0.9941 |
| MCACs | 10.7 ± 4.5 | |||
| Septa (mm) | MCAs | 2.5 ± 1 | <0.0001 | 0.9201 |
| MCACs | 5.9 ± 2.1 | |||
| Wall (mm) | MCAs | 3 ± 1 | <0.0001 | 0.9216 |
| MCACs | 6.2 ± 3.2 | |||
| Cysts (n) | MCAs | 3.4 ± 1.7 | <0.0001 | 0.9627 |
| MCACs | 7.4 ± 3.2 |
ICC, intraclass correlation coefficient; MCAs, mucinous cystoadenomas; MCACs, mucinous borderline tumours and cystoadenocarcinomas; p, p-values between benign and malignant mucinous cystic neoplasms calculated by Student’s t-test.
The table shows the means with standard deviation values of size, septa thickness, wall thickness and number of loculations for MCAs and MCACs, with respective p-values (p) calculated by the Student’s t-test for comparison of the two groups.
The interobserver agreement values calculated by interclass correlation coefficient (ICC) are also reported.
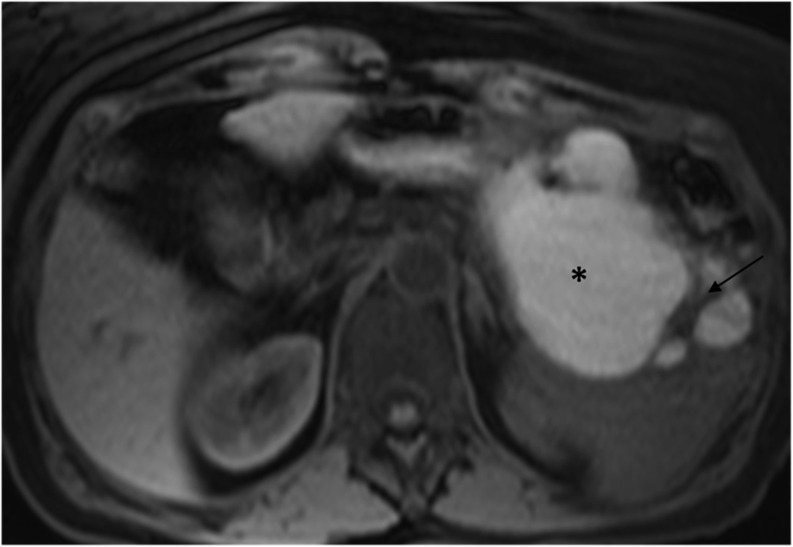
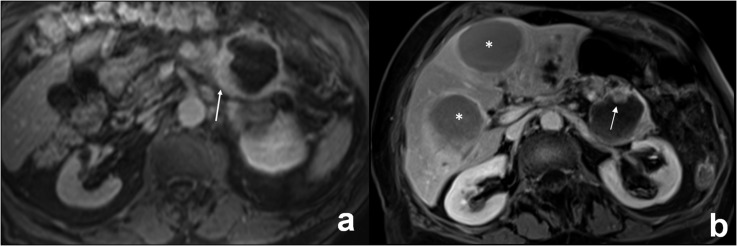
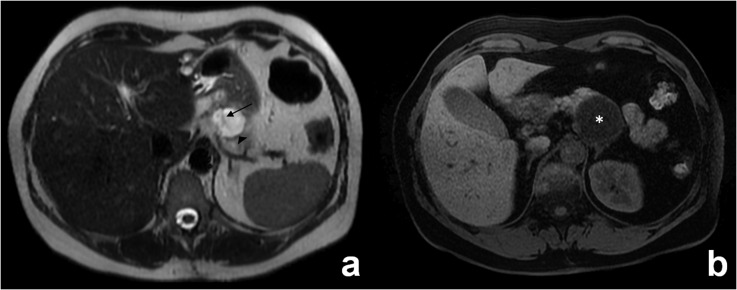
The mean values of lesion size (Figure 1), the thickness of the septa (Figure 1) and of the wall (Figure 2a) and the number of loculations (Figure 1) showed a statistically significant difference between MCACs and MCAs (Figure 3). The difference was higher for septa and wall thickness and for the number of loculations (p < 0.0001) than for lesion size (p < 0.001).
Figure 1.
MR image in a 63-year-old female with a mucinous cystoadenocarcinoma of the tail of the pancreas. Axial T1 weighted image (repetion time 5, echo time 2) shows a large hyperintense cystic mass (90-mm diameter), thick intralesional septa (8 mm) (arrow) and a total of 14 loculations. The hyperintensity of the cystic content (star) was caused by haemorrhagic content.
Figure 2.
(a, b) MR images in a 74-year-old female with a mucinous invasive cystoadenocarcinoma of the tail of the pancreas. (a) Axial T1 weighted image (repetition time 4, echo time 2) after gadolinium injection shows an asymmetric thickening of the wall of the lesion (13 mm) (arrow). (b) A more cranial axial T1 weighted image (repetition time 4, echo time 2) shows an intralesional enhanced nodule on the anterior side of the wall of the lesion (arrow). In this patient, two liver cystic metastases were also observed, representing the same MRI features of the primary tumour (stars).
Figure 3.
(a, b) MR images in a 33-year-old female with a mucinous cystoadenoma of the tail of the pancreas. (a) Axial T2 weighted image (repetition time 1400, echo time 82) shows a small hyperintense cystic mass (33-mm diameter), with a thin hypointense intralesional septa (2 mm) (arrow) and wall (2 mm) (head arrow) and a limited number of loculations.3 (b) Axial T1 weighted image (repetition time 4, echo time 2) shows a hypointense cystic content (star). No nodules of either compression or infiltration of the adjacent structure were observed.
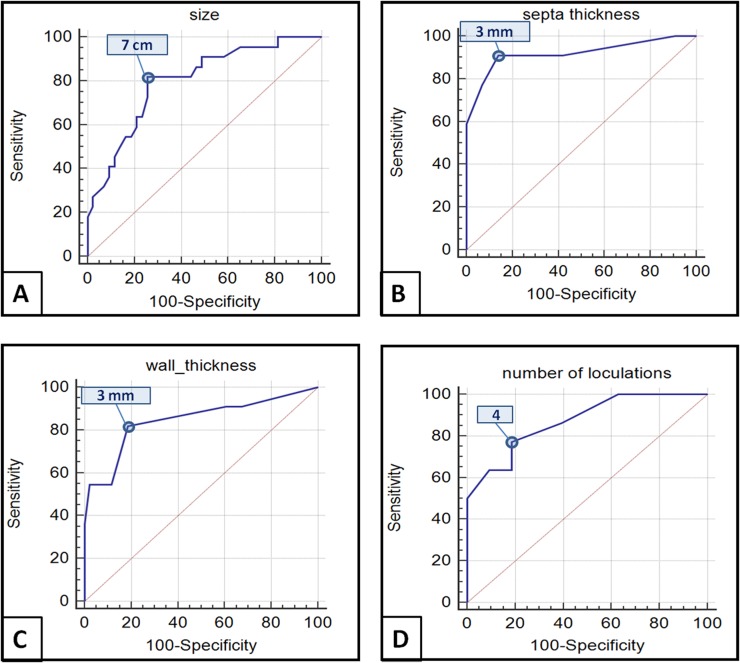
The best cut-off value for lesion size was >7 cm, for thickness of the septa it was >3 mm, for wall thickness it was >3 mm and for the number of loculations it was >4 (Figure 4).
Figure 4.
Receiver operating characteristic analysis for quantitative variables revealed that the best cut-off values to differentiate mucinous cystoadenomas (MCAs) from mucinous cystoadenocarcinomas (MCACs) were: 7 cm for the size of the lesion [Youden index 0.5624, area under the curve (AUC) = 0.799, p < 0.0001] (a); 3 mm for thickness of septa (Youden index 0.7696, AUC = 0.919, p < 0.0001) (b); 3 mm for thickness of the wall (Youden index 0.6321, AUC = 0.845, p < 0.0001) (c); and 4 for the number of loculations (Youden index 0.5867, AUC = 0.872, p < 0.0001) (d).
The sensitivity, specificity, accuracy, NPV and PPV of these quantitative variables at their best cut-off value in predicting the malignancy of the lesion and their agreement on the malignancy of the lesion are reported in Table 4.
Table 4.
Quantitative analysis
| MRI features | Prevalence | Sensitivity | Specificity | Accuracy | PPV | NPV | K | |
|---|---|---|---|---|---|---|---|---|
| Size > 7 cm | MCAs | 11/43 | 82 | 74 | 77 | 62 | 89 | 0.522 |
| MCACs | 18/22 | |||||||
| Septa > 3 mm | MCAs | 6/43 | 91 | 86 | 88 | 77 | 95 | 0.737 |
| MCACs | 20/22 | |||||||
| Wall > 3 mm | MCAs | 8/43 | 86 | 81 | 83 | 70 | 92 | 0.642 |
| MCACs | 19/22 | |||||||
| Number of cysts > 4 | MCAs | 8/43 | 77 | 81 | 80 | 68 | 87 | 0.568 |
| MCACs | 17/22 | |||||||
k, κ-Cohen; MCAs, mucinous cystoadenomas; MCACs, mucinous borderline tumours and cystoadenocarcinomas; NPV, negative-predictive value; PPV, positive-predictive value.
The table shows the prevalence in each group (MCAs and MCACs) of quantitative variables at their best cut-off values: size >7 cm, septa thickness >3 mm, wall thickness >3 mm and number of cysts >4, with respective sensitivity, specificity, accuracy, PPV and NPV and agreement on malignancy (k) calculated by the κ-Cohen test.
The highest accuracy was for thickness of the septa >3 mm (88%) and wall thickness >3 mm (83%), with agreement values of 0.737 and 0.642 on the malignancy of the lesion, respectively.
Qualitative analysis
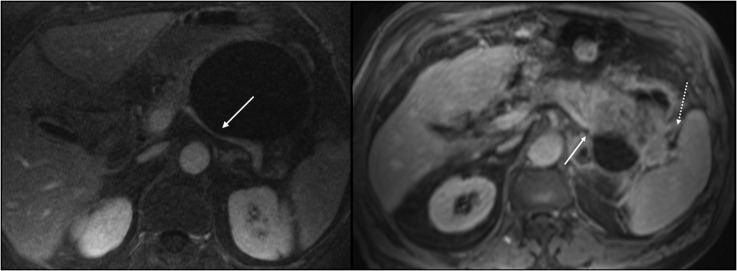
The presence of nodules (Figure 2b), hyperintensity on T1 weighted image of the cystic content (Figure 1), the compression and infiltration of adjacent structures (Figure 5) and the presence of metastases (Figure 2b) in MCAs and MCACs with respective interobserver agreement values are reported in Table 5.
Figure 5.
(a, b) Involvement of adjacent organs by a mucinous cystoadenoma (a) and an invasive cystoadenocarcinoma (b) of the body/tail of the pancreas. (a) Axial T1 weighted images (repetition time 4, echo time 1) after gadolinium injection shows the compression of splenic vein by a large cystoadenoma (arrow). (b) Axial T1 weighted images (repetition time 5, echo time 2) after gadolinium injection shows the infiltration of splenic vein (continuous arrow) and of the spleen (dashed arrow).
Table 5.
Qualitative analysis
| MRI features | Prevalence | p-value | Interobserver agreement (k) | |
|---|---|---|---|---|
| Nodules | MCAs | 0/43 | <0.0001 | 0.815 |
| MCACs | 20/22 | |||
| Hyper T1 | MCAs | 0/43 | <0.0001 | 0.938 |
| MCACs | 12/22 | |||
| Compression | MCAs | 28/43 | 0.0012 | 0.692 |
| MCACs | 22/22 | |||
| Infiltration | MCAs | 0/43 | 0.0032 | 1.000 |
| MCACs | 5/22 | |||
| Metastases | MCAs | 0/43 | 0.0353 | 1.000 |
| MCACs | 3/22 | |||
k, κ-Cohen; MCAs, mucinous cystoadenomas; MCACs, mucinous borderline tumours and cystoadenocarcinomas; p, p-values between MCAs and MCACs calculated by Fisher test.
The table shows the prevalence in each group (MCAs and MCACs) of qualitative variables: nodules, T1 hyperintensity, compression and infiltration of adjacent organs and metastases, with respective p-values (p) calculated by the Fisher test for comparison of the two groups.
The interobserver agreement values (k) calculated by the κ-Cohen test are also reported.
For all these variables, a statistically significant difference was observed; it was higher for the presence of nodules and hyperintensity on T1 weighted image of the cystic content (p < 0.001) than for the compression and infiltration of adjacent structures (p < 0.01) and for metastases (p < 0.05).
The sensitivity, specificity, accuracy, NPV and PPV of these qualitative variables in predicting the malignancy of the lesion and their agreement on the malignancy of the lesion are reported in Table 6. The highest accuracy was for nodules (96.9%) and for hyperintensity on T1 weighted image of the cystic content (84.9%), with agreement values of 0.930 and 0.614 on the malignancy of the lesion, respectively.
Table 6.
Qualitative analysis
| MRI features | Sensitivity | Specificity | Accuracy | PPV | NPV | k |
|---|---|---|---|---|---|---|
| Nodules | 91 | 100 | 97 | 100 | 95 | 0.930 |
| Hyper T1 | 54 | 100 | 85 | 100 | 81 | 0.614 |
| Compression | 100 | 35 | 57 | 44 | 100 | 0.266 |
| Infiltration | 23 | 100 | 74 | 100 | 72 | 0.280 |
| Metastases | 14 | 100 | 71 | 100 | 69 | 0.173 |
k, κ-Cohen; MCAs, mucinous cystoadenomas; MCACs, mucinous borderline tumours and cystoadenocarcinomas; NPV, negative-predictive value; PPV, positive-predictive value.
The table shows the sensitivity, specificity, accuracy, PPV and NPV of nodules, T1 hyperintensity, compression and infiltration of adjacent organs and metastases for MCAs and MCACs.
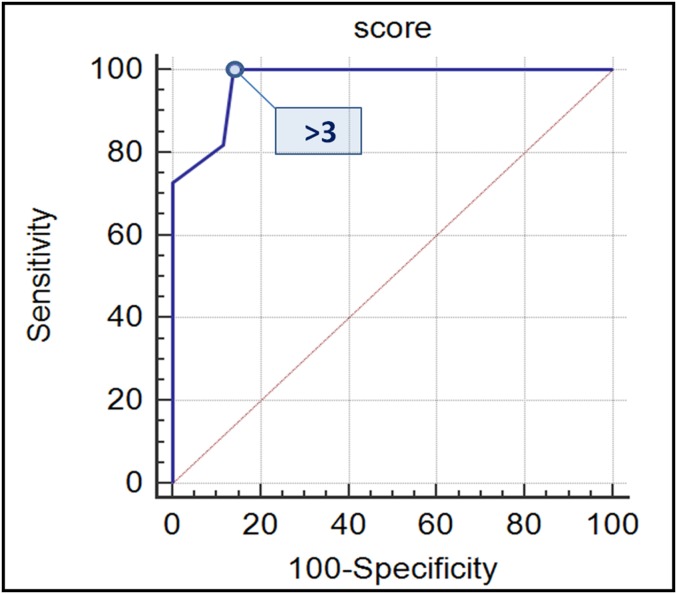
The best maximum value of sensitivity (100%) was obtained for compression of adjacent structures, while the maximum value of specificity (100%) was obtained for the presence of nodules, for T1 hyperintensity of cystic content, for the infiltration of adjacent structures and for metastases. ROC analysis performed on the score assigned for each patient according to the presence of high-risk MRI features is presented in Figure 6; the best cut-off value to discriminate MCAs from MCACs was observed for the presence of >3 high-risk MRI features (Youden index = 0.8605). This cut-off value showed 100%, 86%, 91%, 79% and 100% values for sensitivity, specificity, accuracy, PPV and NPV, respectively.
Figure 6.
Receiver operating characteristic (ROC) analysis of MRI score to discriminate MCAs from MCACs. The score was assessed for each patient by giving 1 point for each of the following high-risk MRI features: size >7 cm; thickness of septa >3 mm; thickness of the wall >3 mm; number of loculations >4; nodules; T1 hyperintensity of the cystic content; compression of adjacent organs; and metastases. Area under the curve (AUC) of the ROC curve analysis with 95% confidence limit (AUC = 0.971 and confidence interval: 0.897–0.997) revealed that the best cut-off value to discriminate MCAs from MCACs was >3 points (Youden index = 0.8605, p < 0.0001). At this cut-off value, the sensitivity, specificity, accuracy, postive-predictive value and negative-predictive value were 100%, 86%, 91%, 79% and 100%, respectively. MCAs, mucinous cystoadenomas; MCACs, mucinous borderline tumours; and cystoadenocarcinomas.
DISCUSSION
The aim of our study was to determine the predictive signs of malignancy for MCNs by means of MRI since the prognosis and treatment of benign forms of MCNs may differ from that of malignant forms of MCNs.7–12 In fact, the 5-year survival rate of benign MCNs has been demonstrated to be 100%, with no local recurrence at 57-month follow-up vs 57% for malignant MCNs;7 5-year survival rate appears worse for invasive forms (<20%), similar to that of ductal pancreatic adenocarcinoma.13 This is the reason why some authors have proposed the so-called “parenchyma-sparing” surgical procedures for benign forms such as distal pancreatectomy without splenectomy,7,12,14,15 middle pancreatectomy8,16 or enucleation.8,10
These more conservative approaches have demonstrated the ability to reduce the risk of endocrine and/or exocrine pancreatic insufficiency and to preserve the spleen.7–10
In our study, the most accurate sign of malignancy (accuracy of 96.9%) was the depiction of mural nodules (Figure 2b), which was seen in 20 of 22 (91%) MCACs and in none (0%) of the 43 MCAs. These results are similar to other studies based on CT imaging, in which researchers found a statistically significant difference for the presence of nodules between MCAs and MCACs.2,7,9,20
This finding is corroborated by the demonstration that carcinomatous components are more frequently located in papillary or nodular areas, so that they should be sampled first at pathological examination.22
Another interesting finding is represented by the high specificity for malignancy of the high signal intensity on T1 weighted image of the cystic content (100%) (Figure 1), accordingly to other published works which explained this feature by the presence of haemorrhagic content of MCACs2,23 and by the higher viscosity of the mucin produced by cystoadenocarcinomas.24,25
Anyway, although this sign was specific, it showed a low sensitivity (54%) since it was observed only in 12 of 22 MCACs.
In agreement with published series,20 another sign predictive of malignancy in our series was the thickness of the septa, which was higher in MCACs (5.9 mm) (Figure 1) than in MCAs (2.5 mm) (Figure 3); its best cut-off value to differentiate MCAs from MCACs was 3 mm, with an accuracy of 88%. This finding can be explained by the fact that septa are contiguous to papillary projection and could be easily invaded by carcinomatous components.22 This may also occur for the thickness of the wall (Figure 2a), which in fact showed similar accuracy (83%).
Number of loculations >4 (Figure 3) was another important quantitative parameter for differential diagnosis (p < 0.0001) similarl to Zamboni et al series,2 probably because of the higher presence of solid components like septa and papillary projections, which divided the cystic cavity into several cysts (Figure 1).
Our results concerning the size of the lesion are in agreement with those of other published reports:2,7,9,20 MCACs had a larger medium diameter (10.7 cm) (Figure 1) than MCAs (6.1 cm) (Figure 3). In particular, our results confirmed that none of the 22 MCACs were <3 cm and that all of them were >4 cm.7
These results corroborate the recent opinion that all MCNs <3 cm without mural nodules could undergo parenchyma-sparing surgery.7
Anyway, this sign should be interpreted carefully because there was some overlap in the size of MCAs and MCACs; in our series, 11 of 43 MCAs were >7 cm, so that the specificity of this sign was not high (74%).
We think this is also the reason why in both MCAs and MCACs the compression of adjacent organs (Figure 5a) is frequently observed, with low specificity of this sign in predicting malignancy (35%).
Conversely, the infiltration of adjacent organs (Figure 5b) was a very specific sign of malignancy but not sensitive because it occurred only in invasive cancer. Anyway, when present, it represents a very important prognostic factor because the invasion of adjacent organs is considered the real worsening prognostic factor, associated with a lower life expectancy.2,13,22 In addition, the presence of metastases has been demonstrated by a highly specific sign (100%) but not sensitive (13%) because it was rarely observed in MCAC. An interesting aspect is that liver metastases presented the same cystic aspect of the primary tumour (Figure 2b).
On the basis of our data, the differential diagnosis between benign and malignant MCNs is based on the presence of >3 of the following high-risk criteria: size >7 cm (Figure 1), septa thickness >3 mm (Figure 1), wall thickness >3 mm (Figure 2a), number of loculations >4 (Figure 1), mural nodules (Figure 2b), T1 hyperintensity of the cystic content (Figure 1), compression and/or infiltration of adjacent organs and vessels (Figure 5) and metastasis (Figure 2b).
MCNs with ≤3 high-risk criteria could be considered benign and MCNs with >3 high-risk criteria could be considered malignant with a sensitivity of 100% and a specificity of 86%.
This finding could be explained by the observation that the incidence of carcinoma within an MCN increases with the complexity of the lesion26 and could support the surgeon in the pre-operative selection of patients who could undergo parenchyma-sparing surgery and those who should undergo traditional surgery.
Accordingly to literature,7,12,14,15 our results also encourage spleen preservation for MCAs because no splenic infiltration was seen in the 43 MCAs. The determination of the intracystic level of carcinoembryonic pattern and carbohydrate antigen 19.9, even if useful in the differential diagnosis between serous neoplasms and MCNs, is not reliable to differentiate benign MCNs from malignant MCNs, because no threshold level was found to clearly differentiate them.8,27,28
Our study had some limitations. First, the study is retrospective and the patients included were recruited from a select group of patients with MCNs who underwent MRI and surgery; therefore, our data contain a selection bias that may be partially responsible for some overestimation of the frequency of the reported signs, which are indicative of malignancy. Another limitation is represented by the low sensitivity of MRI in the detection of calcifications, which anyway is rare (15%).29
CONCLUSION
In conclusion, MRI is accurate (91%) in the differential diagnosis between MCAs and MCACs, allowing selection of benign forms susceptible to parenchyma-sparing surgery, with the advantage of reducing post-surgical morbidity and stratifying the prognosis of MCNs.
Contributor Information
Valerio Di Paola, Email: dipaola.valerio@libero.it.
Riccardo Manfredi, Email: riccardo.manfredi@univr.it.
Sara Mehrabi, Email: saraprinaz@yahoo.it.
Nicolò Cardobi, Email: nicolo.cardobi@gmail.com.
Emanuele Demozzi, Email: e.demozzi@gmail.com.
Salvatore Belluardo, Email: totibelluardo@alice.it.
Roberto Pozzi Mucelli, Email: roberto.pozzimucelli@univr.it.
REFERENCES
- 1.Valsangkar NP, Morales-Oyarvide V, Thayer SP, Ferrone CR, Wargo JA, Warshaw AL, et al. 851 resected cystic tumors of the pancreas: a 33-year experience at the Massachusetts General Hospital. Surgery 2012; 152(3 Suppl 1): S4–12. doi: 10.1016/j.surg.2012.05.033 [DOI] [PMC free article] [PubMed] [Google Scholar]
- 2.Zamboni G, Scarpa A, Bogina G, Iacono C, Bassi C, Talamini G, et al. Mucinous cystic tumors of the pancreas: clinicopathological features, prognosis, and relationship to other mucinous cystic tumors. Am J Surg Pathol 1999; 23: 410–22. doi: 10.1097/00000478-199904000-00005 [DOI] [PubMed] [Google Scholar]
- 3.Campbell F, Azadeh B. Cystic neoplasms of the exocrine pancreas. Histopathology 2008; 52: 539–51. doi: 10.1111/j.1365-2559.2007.02856.x [DOI] [PubMed] [Google Scholar]
- 4.Zamboni G, Bonetti F, Scarpa A, Pelosi G, Doglioni C, Iannucci A, et al. Expression of progesterone receptors in solid-cystic tumour of the pancreas: a clinicopathological and immunohistochemical study of ten cases. Virchows Arch A, Pathol Anat Histopathol 1993; 423: 425–31. doi: 10.1007/BF01606531 [DOI] [PubMed] [Google Scholar]
- 5.Morana G, Guarise A. Cystic tumors of the pancreas. Cancer imaging 2006; 6: 60–71. doi: 10.1102/1470-7330.2006.0012 [DOI] [PMC free article] [PubMed] [Google Scholar]
- 6.Tanaka M, Fernández-del Castillo C, Adsay V, Chari S, Falconi M, Jang JY, et al. ; International Association of Pancreatology. International consensus guidelines 2012 for the management of IPMN and MCN of the pancreas. Pancreatology 2012; 12: 183–97. doi: 10.1016/j.pan.2012.04.004 [DOI] [PubMed] [Google Scholar]
- 7.Crippa S, Salvia R, Warshaw AL, Dominguez I, Bassi C, Falconi M, et al. Mucinous cystic neoplasm of the pancreas is not an aggressive entity: lessons from 163 resected patients. Ann Surg 2008; 247: 571–9. doi: 10.1097/SLA.0b013e31811f4449 [DOI] [PMC free article] [PubMed] [Google Scholar]
- 8.Scoazec JY, Vullierme MP, Barthet M, Gonzalez JM, Sauvanet A. Cystic and ductal tumors of the pancreas: diagnosis and management. J Visc Surg 2013; 150: 69–84. doi: 10.1016/j.jviscsurg.2013.02.003 [DOI] [PubMed] [Google Scholar]
- 9.Le Baleur Y, Couvelard A, Vullierme MP, Sauvanet A, Hammel P, Rebours V, et al. Mucinous cystic neoplasms of the pancreas: definition of preoperative imaging criteria for high-risk lesions. Pancreatology 2011; 11: 495–9. doi: 10.1159/000332041 [DOI] [PubMed] [Google Scholar]
- 10.Talamini MA, Moesinger R, Yeo CJ, Poulose B, Hruban RH, Cameron JL, et al. Cystadenomas of the pancreas: is enucleation an adequate operation? Ann Surg 1998; 227: 896–903. doi: 10.1097/00000658-199806000-00013 [DOI] [PMC free article] [PubMed] [Google Scholar]
- 11.Kooby DA, Gillespie T, Bentrem D, Nakeeb A, Schmidt MC, Merchant NB, et al. Left-sided pancreatectomy: a multicenter comparison of laparoscopic and open approaches. Ann Surg 2008; 248: 438–46. doi: 10.1097/SLA.0b013e318185a990 [DOI] [PubMed] [Google Scholar]
- 12.Lillemoe KD, Kaushal S, Cameron JL, Sohn TA, Pitt HA, Yeo CJ. Distal pancreatectomy: indications and outcomes in 235 patients. Ann Surg 1999; 229: 693–8; discussion 8–700. doi: 10.1097/00000658-199905000-00012 [DOI] [PMC free article] [PubMed] [Google Scholar]
- 13.Sarr MG, Carpenter HA, Prabhakar LP, Orchard TF, Hughes S, van Heerden JA, et al. Clinical and pathologic correlation of 84 mucinous cystic neoplasms of the pancreas: can one reliably differentiate benign from malignant (or premalignant) neoplasms? Ann Surg 2000; 231: 205–12. doi: 10.1097/00000658-200002000-00009 [DOI] [PMC free article] [PubMed] [Google Scholar]
- 14.Kooby DA, Hawkins WG, Schmidt CM, Weber SM, Bentrem DJ, Gillespie TW, et al. A multicenter analysis of distal pancreatectomy for adenocarcinoma: is laparoscopic resection appropriate? J Am Coll Surg 2010; 210: 779–85, 86–7. doi: 10.1016/j.jamcollsurg.2009.12.033 [DOI] [PubMed] [Google Scholar]
- 15.Fernandez-del Castillo C. Mucinous cystic neoplasms. J Gastrointest Surg 2008; 12: 411–13. [DOI] [PubMed] [Google Scholar]
- 16.Crippa S, Bassi C, Warshaw AL, Falconi M, Partelli S, Thayer SP, et al. Middle pancreatectomy: indications, short- and long-term operative outcomes. Ann Surg 2007; 246: 69–76. doi: 10.1097/01.sla.0000262790.51512.57 [DOI] [PMC free article] [PubMed] [Google Scholar]
- 17.Reddy RP, Smyrk TC, Zapiach M, Levy MJ, Pearson RK, Clain JE, et al. Pancreatic mucinous cystic neoplasm defined by ovarian stroma: demographics, clinical features, and prevalence of cancer. Clin Gastroenterol Hepatol 2004; 2: 1026–31. doi: 10.1016/S1542-3565(04)00450-1 [DOI] [PubMed] [Google Scholar]
- 18.Manfredi R, Bonatti M, D'Onofrio M, Mehrabi S, Salvia R, Mantovani W, et al. Incidentally discovered benign pancreatic cystic neoplasms not communicating with the ductal system: MR/MRCP imaging appearance and evolution. Radiol Med 2013; 118: 163–80. doi: 10.1007/s11547-012-0837-3 [DOI] [PubMed] [Google Scholar]
- 19.Lee CJ, Scheiman J, Anderson MA, Hines OJ, Reber HA, Farrell J, et al. Risk of malignancy in resected cystic tumors of the pancreas < or =3 cm in size: is it safe to observe asymptomatic patients? A multi-institutional report. J Gastrointest Surg 2008; 12: 234–42. [DOI] [PubMed] [Google Scholar]
- 20.Procacci C, Carbognin G, Accordini S, Biasiutti C, Guarise A, Lombardo F, et al. CT features of malignant mucinous cystic tumors of the pancreas. Eur Radiol 2001; 11: 1626–30. doi: 10.1007/s003300100855 [DOI] [PubMed] [Google Scholar]
- 21.Theruvath TP, Morgan KA, Adams DB. Mucinous cystic neoplasms of the pancreas: how much preoperative evaluation is needed? Am Surg 2010; 76: 812–17. [PubMed] [Google Scholar]
- 22.Sakorafas GH, Smyrniotis V, Reid-Lombardo KM, Sarr MG. Primary pancreatic cystic neoplasms revisited: part II. Mucinous cystic neoplasms. Surg Oncol 2011; 20: e93–101. doi: 10.1016/j.suronc.2010.12.003 [DOI] [PubMed] [Google Scholar]
- 23.Hara T, Kawashima H, Ishigooka M, Kashiyama M, Takanashi S, Yamazaki S, et al. Mucinous cystic tumors of the pancreas. Surg Today 2002; 32: 965–9. doi: 10.1007/s005950200193 [DOI] [PubMed] [Google Scholar]
- 24.Nishihara K, Kawabata A, Ueno T, Miyahara M, Hamanaka Y, Suzuki T. The differential diagnosis of pancreatic cysts by MR imaging. Hepatogastroenterology 1996; 43: 714–20. [PubMed] [Google Scholar]
- 25.Lüttges J, Feyerabend B, Buchelt T, Pacena M, Klöppel G. The mucin profile of noninvasive and invasive mucinous cystic neoplasms of the pancreas. Am J Surg Pathol 2002; 26: 466–71. [DOI] [PubMed] [Google Scholar]
- 26.Basturk O, Coban I, Adsay NV. Pancreatic cysts: pathologic classification, differential diagnosis, and clinical implications. Arch Pathol Lab Med 2009; 133: 423–38. doi: 10.1043/1543-2165-133.3.423 [DOI] [PubMed] [Google Scholar]
- 27.Park WG, Mascarenhas R, Palaez-Luna M, Smyrk TC, O'Kane D, Clain JE, et al. Diagnostic performance of cyst fluid carcinoembryonic antigen and amylase in histologically confirmed pancreatic cysts. Pancreas 2011; 40: 42–5. doi: 10.1097/MPA.0b013e3181f69f36 [DOI] [PMC free article] [PubMed] [Google Scholar]
- 28.Scheiman JM. Management of cystic lesions of the pancreas. J Gastrointest Surg 2008; 12: 405–7. doi: 10.1007/s11605-007-0350-5 [DOI] [PubMed] [Google Scholar]
- 29.Fasanella KE, McGrath K. Cystic lesions and intraductal neoplasms of the pancreas. Best Pract Res Clin Gastroenterol 2009; 23: 35–48. doi: 10.1016/j.bpg.2008.11.011 [DOI] [PubMed] [Google Scholar]


