Abstract
Objective:
To compare the clinical value of sacroiliac spectral CT and MRI in diagnosing axial spondyloarthritis (SpA).
Methods:
137 patients with low back pain and suspected axial SpA were recruited. 76 patients were diagnosed with axial SpA, and 49 patients were diagnosed with non-specific low back pain (nLBP). Each patient underwent spectral CT and MRI examinations of the sacroiliac joints. Water- and calcium-based material decomposition images were reconstructed for quantitative analysis. The marrow-to-muscle ratios of water and calcium concentrations and short tau inversion recovery (STIR) signal intensity, as well as Hounsfield units in the ilium and sacrum were compared between nLBP and patients with axial SpA.
Results:
Spectral CT is comparable with MRI for the detection of bone marrow oedema, and it is superior to MRI for detection of osseous sclerosis and erosions. MRI is superior to spectral CT in detecting enthesitis and synovitis. There were statistically significant differences in STIR signal intensity, water concentration and calcium concentration ratios as well as CT values between nLBP and patients with axial SpA (p < 0.05) in the ilium. There was a statistically significant but weak correlation between ratios of water concentration and STIR signal intensity in both the ilium and sacrum (p < 0.05). Overall, the iliac water concentration was most sensitive for detection of patients with SpA. The positive likelihood ratio of the STIR signal intensity ratio was the highest. The diagnostic odds ratio of the calcium concentration ratio was the highest, and its negative likelihood ratio was the lowest.
Conclusion:
Spectral CT not only depicts findings of chronic sacroiliitis (i.e. bone erosion and sclerosis), but also can detect and quantify the extent of marrow oedema in patients with SpA with activity sacroiliitis. The sensitivity of MRI for diagnosis of early synovitis and enthesitis remains superior. The combination of spectral CT and MRI may thus improve diagnostic accuracy in the diagnosis of axial SpA.
Advances in knowledge:
Spectral CT can measure both calcium and water concentration of the sacroiliac joints. The combination of spectral CT and MRI may thus improve diagnostic accuracy in the diagnosis of axial SpA.
INTRODUCTION
Seronegative spondyloarthritis (SpA) is a chronic inflammatory rheumatologic disease. Sacroiliitis is the earliest clinical finding and a hallmark for the diagnosis of axial SpA.1,2 Imaging findings play an important role in the diagnosis of SpA. CT is sensitive in the detection of chronic changes (such as erosions, sclerosis and ankylosis) in the sacroiliac joints (SIJs); however, MRI is more sensitive in the detection of early signs of sacroiliitis including enthesitis, capsulitis and osteitis.3,4 Because of the increasing use of MRI in identifying early features of SpA before radiographic findings, the Assessment of Spondyloarthritis International Society (ASAS) has updated the criteria for the diagnosis of axial SpA. The presence of sacroiliitis is listed as one of the key criteria for the diagnosis of axial SpA.5,6 Conventional MRI protocols include fast spin-echo (FSE) T1 weighted and short tau inversion recovery (STIR) T2 weighted sequences for the evaluation of sacroiliac joints.7 STIR is a fat-suppression sequence and sensitive to the fluid and oedema. Recently, the emergence of spectral CT has enabled measurements of relative bone water and calcium concentrations via acquisition of base material-decomposition images. Spectral CT is performed by acquiring two consecutive scans with high and low energy (140 and 80 kV) using a single X-ray tube, high-performance gemstone detector and with the implementation of powerful image post-processing. By use of these techniques, accurate material-decomposition images (i.e. water- and calcium-based material-decomposition images) and monochromatic spectral images at energy levels ranging from 40 to 140 keV can be created.8–10 In this study, spectral CT and MRI were used to distinguish patients with axial SpA from patients with non-specific low back pain (nLBP).
METHODS AND MATERIALS
This study was approved by the institutional review board of the university hospital. Written informed consent was obtained from all participants.
Patient information
From October 2013 to May 2014, 137 patients (99 males and 38 females, age range 18–45 years; mean age of 28.5 years) with symptoms of low back pain lasting for greater than 3 months with clinical suspicion of axial SpA were evaluated. All patients had experienced two or more of the following symptoms: insidious onset of pain/discomfort, morning stiffness, improvement with exercise and/or pain at night. All patients underwent spectral CT and MRI examinations to evaluate the SIJs on the same day. The spectral CT and MRI examinations were performed by the same radiologist who had more than 5 years' experience. Patients with more than 5 years of disease duration, history of joint surgery or recent history of intra-articular corticosteroid injection in the last 6 weeks were excluded from this study. None of the patients participated in the treatment of tumour necrosis factor-α inhibitors or other biologic agents during the 3 months before the examination.
Two fellowship-trained rheumatologists with more than 10 years' experience each evaluated the presence of SpA based on the ASAS criteria by consensus.5 According to ASAS criteria, a patient younger than 45 years old with inflammatory back pain for more than 3 months in duration can be diagnosed with axial SpA in the presence of: (1) sacroiliitis on MRI or radiographs plus at least one typical clinical SpA feature or (2) the presence of positive HLA-B27 plus at least two typical clinical SpA features.
The clinical record was reviewed from 3 to 6 months. Of 137 patients, 76 patients (17 females and 59 males, age 18–43 years; mean age of 26.4 years) were diagnosed with axial SpA based on laboratory and imaging information as well as the ASAS criteria, and 49 patients (14 females and 35 males, ages 18–44 years, mean age of 29.3 years) were diagnosed with nLBP. Nine patients (four females and five males, age 35–45 years, mean age of 41.1 years) were diagnosed with sacroiliac degeneration, and three patients (three females, ages 27–33 years; mean age of 29 years) were diagnosed with osteitis condensans ilii. No statistically significant differences were identified between the patients with axial SpA and patients with nLBP based on age and sex. The patients with sacroiliac degeneration or osteitis condensans ilii were excluded because of statistically significant differences in the ages and/or sex of these patients.
Equipment and scanning techniques
All CT scans were obtained using a standard spectral CT scanner (GE Discovery 750 high-definition CT; GE Healthcare, Milwaukee, WI), and all MRIs were performed using a 1.5-T MRI scanner (Signa HDxt; GE Healthcare).
The spectral CT scanning parameters were as follows: collimation thickness, 0.625 mm; tube current, 550 mA; rotation speed, 0.8 s; and helical pitch, 0.984. Two types of images were reconstructed from the single spectral CT acquisition: conventional polychromatic images obtained at 140 kVp and monochromatic images obtained at energy of 70 keV. Slice thickness and spacing were 0.625 and 0.625 mm, respectively.
The MRI protocol was as follows: (1) an axial FSE sequence [repetition time (TR)/echo time (TE) = 280/7.2 ms and slice thickness = 4 mm]; (2) an axial fast-recovery FSE sequence with fat suppression (TR/TE = 2220/86 ms and slice thickness = 4 mm); (3) an oblique coronal STIR sequence (TR/TE = 4100/71.2 ms, inversion time = 150 ms, slice thickness = 4 mm, field of view = 33 cm and matrix = 288 × 224).
Image analysis and data collection
Two musculoskeletal radiologists with more than 5 years' experience in musculoskeletal imaging, who were blinded to the diagnosis and patient demographics, evaluated all spectral CT and MRI images and measured the quantitative parameters. The readers evaluated imaging features, including the presence or absence of: bone marrow oedema, bone sclerosis, a lesion in the bone cortex, sacroiliac joint space narrowing, enthesitis and synovitis.
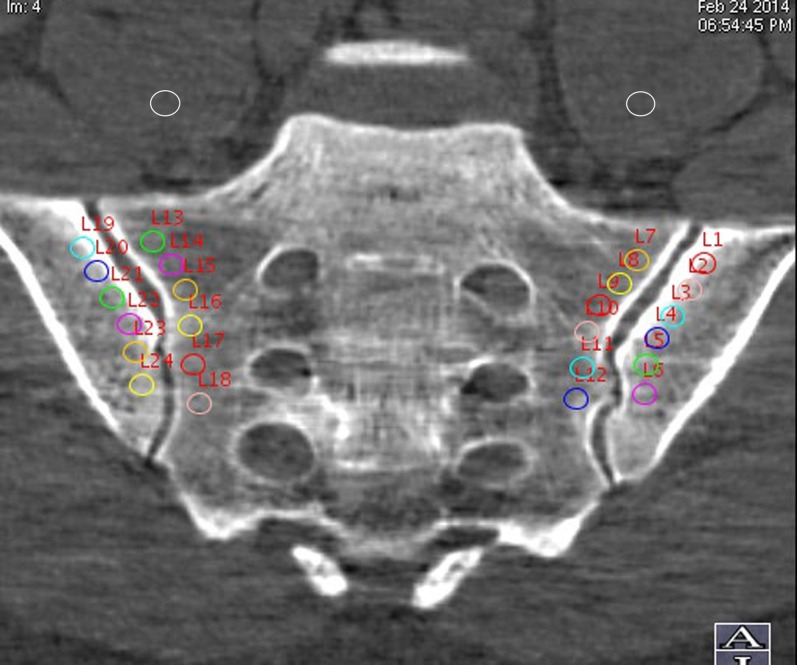
The monochromatic images were analysed on a dedicated workstation running the Gemstone spectral CT imaging viewer (AW 461; GE Healthcare). Through Gemstone spectral CT imaging reconstruction, base material-decomposition images were made by choosing calcium and water as the base materials. In the oblique coronal plane of the SIJ, six circular regions of interest (ROI) (19–21 mm2) were semi-automatically placed separately in the subcortical bones of the SIJs bilaterally. The distance between the centre of the ROI and the bone cortex ranged from 4 to 6 mm, to prevent the cortical bone from interfering with the measurements. Within the same image slice, one ROI (about 30 mm2) was placed in each psoas major muscle (Figure 1). The marrow-to-muscle ratios of water and calcium concentration were calculated. The polychromatic images were transmitted to the same work station used to reconstruct the oblique coronal images. The ROI were drawn analogously to measure the CT values (Hounsfield unit, HU) of both subcortical sacrum and ilium.
Figure 1.
Image demonstrating region of interest placement for analysis of the spectral CT.
The STIR images were analysed on a separate dedicated work station (AW 4.5; GE Healthcare). The signal intensity measurements on STIR images in the sacra, ilia and psoas major muscles were performed analogously to those on the CT images. The marrow-to-muscle ratio of signal intensity was calculated.
Quantitative parameters included: (1) the ratio of water concentrations; (2) the ratio of calcium concentration; (3) the slope of the HU curves (λHU) (the plot of material attenuation against X-ray photon energy) corresponding to subcortical sacrum and ilium calculated as the CT attenuation difference at two energy levels (40 and 100 keV) divided by the energy difference (60 keV) from the HU curve: λHU = (HU40 keV–HU100 keV)/60; (4) CT values (HU) of bilateral subcortical sacrum and ilium in polychromatic images; and (5) ratio of signal intensity on STIR image.
Data analysis
The data were analysed using SPSS® v. 17.0 for Windows (IBM Corp., Armonk, NY; formerly SPSS Inc., Chicago, IL). Continuous variables were described as mean ± standard deviations (SD). An independent sample t-test was used to determine differences in parameters between nLBP and axial SpA groups. Pearson's correlation coefficient (r) was used to assess correlations between the ratio of water concentration and the ratio of STIR signal intensity. Receiver-operating characteristic curves were constructed to evaluate the sensitivity and specificity of parameters to identify patients with axial SpA from patients with nLBP. The cut-off value was chosen as the point maximizing Youden's index. P values of <0.05 were considered statistically significant.
RESULTS
The comparison of spectral CT and MRI for the detection of sacroiliitis findings is shown in Table 1. In 76 patients with axial SpA, spectral CT detected 3 (3.9%) patients with bone marrow oedema, 13 (17.1%) patients with bone sclerosis and 18 (23.7%) patients with cortical bone erosions in the absence of similar MR findings. MRI detected 35 (46.1%) patients with enthesitis and 47 (61.8%) patients with synovitis, while spectral CT revealed no such abnormality (Figure 2).
Table 1.
Imaging findings of spectral CT and MRI
| Imaging findings | Marrow oedema | Sclerosis | Bone erosion | Joint space narrowing | Enthesitis | Synovitis |
|---|---|---|---|---|---|---|
| Spectral CT | 56/76 | 60/76 | 65/76 | 8/76 | 0/76 | 0/76 |
| MRI | 53/76 | 47/76 | 47/76 | 8/76 | 35/76 | 47/76 |
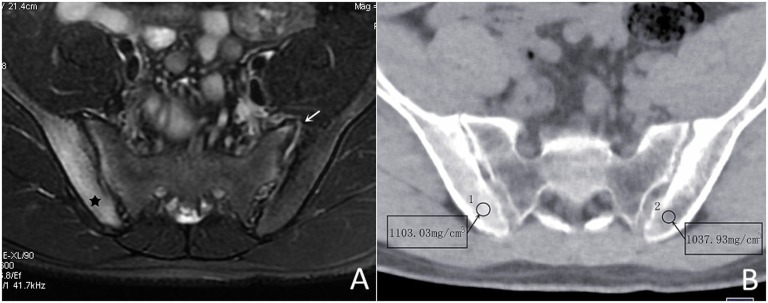
Figure 2.
Patient with axial spondyloarthritis (male, 20 years old, HLA-B27 positive, low back pain for 3 months). (a) Axial T2 weighted shows the abnormal high signal intensity involving subcortical bone marrow of the right ilium (black star) and left sacroiliac joint synovitis (arrow). (b) The water-based image of spectral CT image demonstrates the water concentration of the right ilium (1103.03 mg cm−3) to be higher than that of the left (1037.93 mg cm−3). The synovitis remains CT occult.
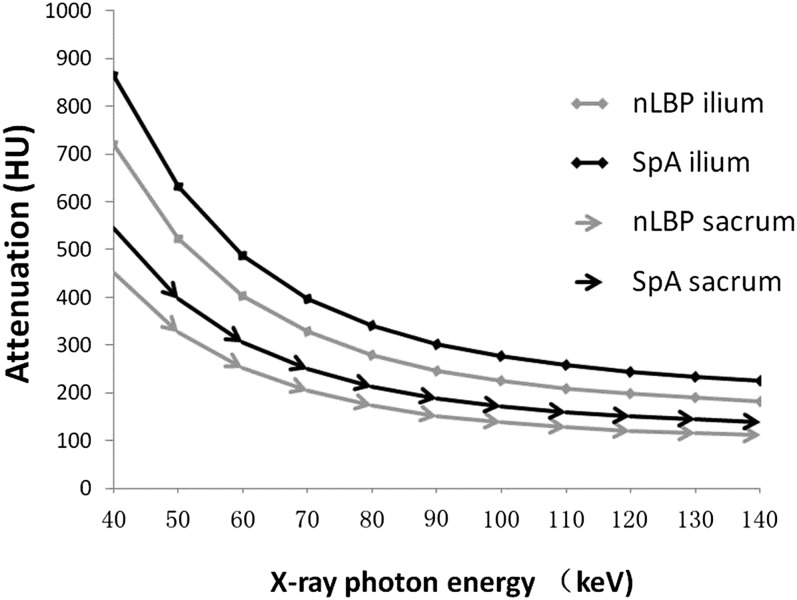
Quantitative analysis of HU curves (Figure 3) showed positive λHU for nLBP group (5.24 ± 3.11 and 8.26 ± 3.91) and axial SpA group (6.23 ± 4.23 and 9.81 ± 4.92), respectively, in the sacrum and ilium. There were statistically significant differences of λHU between nLBP and axial SpA groups in the sacrum (t = −4.83, p < 0.001) and ilium (t = −6.36, p < 0.001).
Figure 3.
Attenuation to X-ray photon energies curves [Hounsfield unit (HU) curves] within the subcortical bones of the sacroiliac joints in patients with non-specific low back pain (nLBP) and axial spondyloarthritis (SpA). The slope of HU curves was calculated as λHU = (HU measured at 40 keV; HU measured at 100 keV)/60.
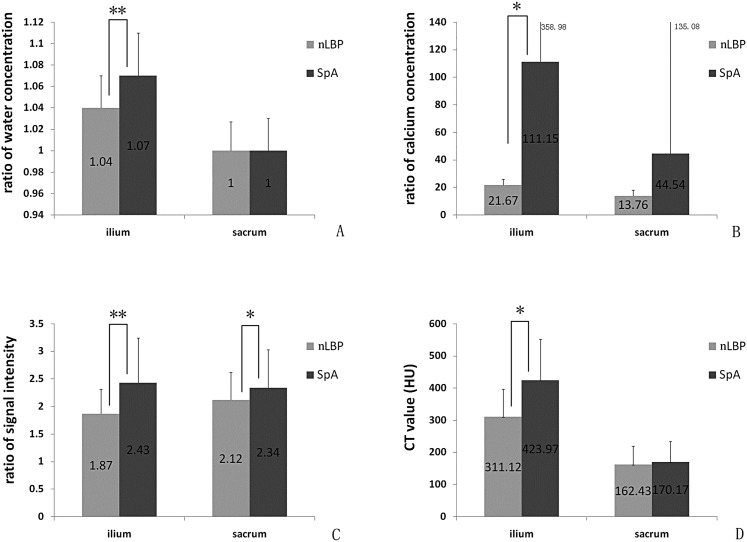
The means and SD of the iliac STIR signal intensity, water concentration and calcium concentration ratios, as well as CT values are shown in Table 2. There were statistically significant differences (Figure 4) in water concentration ratios (t = −5.10, p < 0.05), calcium concentration ratios (t = −2.17, p < 0.05), CT values (t = −5.89, p < 0.05) and STIR signal intensity ratios (t = −4.90, p < 0.05) in the ilia between patients with nLBP and patients with axial SpA.
Table 2.
The statistical results of iliac parameters
| Parameters | Group | Mean | SD | t | p-value |
|---|---|---|---|---|---|
| Iliac ratio of signal intensity | nLBP | 1.87 | 0.45 | −4.90 | 0.000 |
| SpA | 2.43 | 0.81 | |||
| Iliac ratio of water concentration | nLBP | 1.04 | 0.03 | −5.10 | 0.000 |
| SpA | 1.07 | 0.04 | |||
| Iliac ratio of calcium concentration | nLBP | 21.67 | 4.40 | −2.17 | 0.033 |
| SpA | 111.15 | 358.98 | |||
| Iliac CT value (HU) | nLBP | 311.12 | 86.52 | −5.89 | 0.000 |
| SpA | 423.97 | 127.51 |
HU, Hounsfield unit; nLBP, non-specific low back pain; SD, standard deviation; SpA, spondyloarthritis.
Figure 4.
Graphs demonstrating statistically significant differences in water concentration ratios (a), calcium concentration ratios (b), short tau inversion recovery signal intensity ratios (c) and CT values (d) in the ilium. Statistically significant differences are denoted with an asterisk (**p < 0.01, *p < 0.05). HU, Hounsfield unit; SpA, spondyloarthritis.
The means and SD of the sacral STIR signal intensity, water concentration, calcium concentration ratios and CT values are shown in Table 3. There were no statistically significant differences in water concentration ratios (t = 0.06, p > 0.05), calcium concentration ratios (t = −1.99, p > 0.05) or CT values (t = −0.69, p > 0.05) in the sacrum between patients with nLBP and patients with axial SpA. There were statistically significant differences in the STIR signal intensity ratios (t = −1.99, p < 0.05) in the sacrum between patients with nLBP and patients with axial SpA.
Table 3.
The statistical results of sacral parameters
| Parameters | Group | Mean | SD | t | p-value |
|---|---|---|---|---|---|
| Sacral ratio of signal intensity | nLBP | 2.12 | 0.50 | −1.99 | 0.049 |
| SpA | 2.34 | 0.69 | |||
| Sacral ratio of water concentration | nLBP | 1.00 | 0.03 | 0.062 | 0.951 |
| SpA | 1.00 | 0.03 | |||
| Sacral ratio of calcium concentration | nLBP | 13.76 | 4.09 | −1.99 | 0.051 |
| SpA | 44.54 | 135.08 | |||
| Sacral CT value (HU) | nLBP | 162.43 | 57.01 | −0.69 | 0.494 |
| SpA | 170.17 | 64.40 |
HU, Hounsfield unit; nLBP, non-specific low back pain; SD, standard deviation; SpA, spondyloarthritis.
The water concentration ratios demonstrated statistically significant, although weak, correlations with the STIR signal intensity ratios in both the ilium and sacrum (r = 0.336, p < 0.05 and r = 0.240, p < 0.05, respectively).
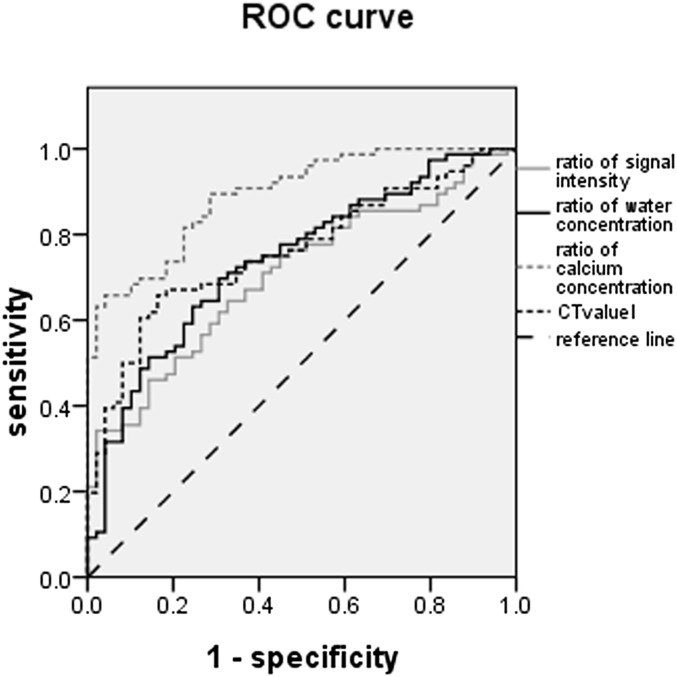
To assess the capability of iliac water and calcium concentration ratios and CT values vs STIR signal intensity ratios in detecting axial SpA, receiver-operating characteristic curves were constructed and areas under the curve were computed (Figure 5). The statistical performance of iliac parameters for the diagnosis of SpA is shown in Table 4. The diagnostic sensitivity of the water concentration ratio (69.7%) was the highest. The positive likelihood ratio of STIR signal intensity ratio (17.1) was the highest, but its negative likelihood ratio (0.67) was also highest and its diagnostic sensitivity (34.2%) was the lowest. Although the positive likelihood ratio of the calcium concentration ratio was slightly lower than the STIR signal intensity ratio (16.05), its diagnostic sensitivity (65.8%) and diagnostic odds ratio (44.58) were higher than those of the STIR signal intensity ratio. The negative likelihood ratio (0.36) of the calcium concentration ratio was smaller than that of the STIR signal intensity ratio.
Figure 5.
The areas under the curve for calcium concentration ratios in the ilium were greater than that of other parameters for the detection of patients with axial spondyloarthritis. ROC, receiver-operating characteristic.
Table 4.
The diagnosis performance indices of iliac spectral CT parameters
| Iliac parameters | Ratio of signal intensity | Ratio of water concentration | Ratio of calcium concentration | CT value |
|---|---|---|---|---|
| AUC | 0.705 | 0.740 | 0.892 | 0.760 |
| Cut-off value | 2.72 | 1.05 | 27.73 | 378.81 |
| Sensitivity, % | 34.2 | 69.7 | 65.8 | 65.8 |
| Specificity, % | 98 | 69.4 | 95.9 | 83.7 |
| Positive likelihood ratio | 17.1 | 2.28 | 16.05 | 4.04 |
| Negative likelihood ratio | 0.67 | 0.44 | 0.36 | 0.41 |
| Diagnostic odds ratio | 25.52 | 5.18 | 44.58 | 9.85 |
AUC, areas under the curve.
DISCUSSION
Subcortical bone marrow oedema is an important feature of active SpA. Normal peripheral bone marrow is filled with adipocytes, whereas oedematous cancellous bone is characterized by an accumulation of immune cells and microvasculature in the bone marrow replacing the marrow adipocytes. This leads to an increase in water content and decrease in fat content.11 MRI demonstrating periarticular SIJ bone marrow oedema is considered to be the imaging hallmark of axial SpA. MRI is also able to detect inflammatory changes in soft tissues, and allows visualization of sacroiliitis in patients with negative radiographs.12 In the present study, the mean iliac ratio of signal intensity on STIR image in patients with axial SpA was higher than that of patients with nLBP. Similarly, on spectral CT, the mean iliac ratio of water or calcium concentration in patients with axial SpA was higher than that of patients with nLBP. The correlation between the STIR signal intensity ratio and the water concentration ratio was statistically significant, although weak. Furthermore, in three patients, spectral CT demonstrated bone marrow oedema without associated findings on MRI. The mean STIR signal intensity ratios in the sacrum were also higher in patients with SpA patients than in patients with nLBP; however, there was no statistically significant difference in water concentration identified by the spectral CT. This disparity may be related to the imaging principles underlying the two methods. The calculation for material decomposition in spectral CT is as follows: CTvalue = Dwater × μwater + Dcalcium × μcalcium. The two different CTvalues are collected based on the rapid tube voltage switching between 80 and 140 kVp. The μwater and μcalcium are known mass-absorption coefficients of water and calcium. From these, Dwater and Dcalcium are derived representing the relative concentrations of water and calcium, respectively. The water concentration of the bone marrow is a relative value and may vary based on calcium concentration. Low signal-to-noise ratios of the STIR image13 may also account for this observation. Also, STIR images are sensitive to the presence of free water; however, both free and bound water protons exist in vivo, and STIR images may suppress the signal from water protons bound to proteins with a T1 similar to that of fat.13,14 This may further account for the decreased sensitivity of STIR signal intensity ratios relative to water concentration ratios.
Although spectral CT could demonstrate bone marrow oedema, early soft tissue inflammatory findings could not be identified. In distinction, MRI was able to detect findings of sacroiliitis like capsulitis, enthesitis and synovitis.
When the ratios of water and calcium concentrations and CT values were utilized to detect the sacroiliitis of patients with axial SpA, the sensitivity of ratio of water concentration (69.7%) was higher than other parameters, but the diagnostic odds ratio was low. In all of the parameters, the diagnostic odds ratio of the calcium concentration ratio was the highest, and the positive likelihood ratio of the STIR signal intensity ratio was the highest. Thus, spectral CT combined with MRI could improve the diagnostic efficiency.
The ratios of water and calcium concentrations in the ilia of patients with SpA were both higher than that of patients with nLBP patients. This may be related to the presence of chronic inflammatory infiltration in the sacroiliac joint. Pro-inflammatory cytokines stimulate the osteoclast differentiation and function.15 This mechanism may account for the statistically significant correlation between water and calcium concentrations that were observed. Spectral CT could thus demonstrate bone marrow oedema in the sclerotic part of the bone, while the STIR images remain insensitive in this regard.
In patients with axial SpA, iliac ratios of calcium and water concentrations, as well as STIR signal intensity ratios increased more dramatically than the analogous values on the sacral side of the SIJ. This finding confirms the previous studies in early ankylosing spondylitis patients that found the ilium to be involved earlier in the disease process than the sacrum.16,17 There are several proposed mechanisms for this finding. For one, the cartilage on the ilial side (0.8 mm) is thinner than that on the sacral side (1.8 mm).18 Also, iliac cartilage is a mixture of hyaline and fibrocartilage, while the sacral cartilage is purely hyaline.19 Preferential targeting of the bone fibrocartilage interface may play a role in SpA,20 similar to the hypothesized mechanism for enthesitis. Finally, force distribution during weight bearing may differ between the sacral and iliac side of the SIJs,21 contributing to the differential onset of inflammation.
MRI remains relatively advantageous for the evaluation of sacroiliitis owing to a lack of ionizing radiation. Spectral CT dose require ionizing radiation, although the dose is less than that with conventional CT. This is because the initial velocity (the velocity of X-ray converting to visible light) of the spectral CT is faster than conventional CT by about 100 times, and the emptying rate (afterglow effect) is faster than conventional CT by about 4-fold. The cost of spectral CT is lower than MRI, and the scan time is shorter. Thus, spectral CT may be preferred in patients with claustrophobia or in those patients who cannot tolerate a long scan time. In patients requiring serial follow-up, MRI is still preferable given the relatively young population affected. For initial diagnosis, however, spectral CT may aid in the differentiation of SpA from nLBP. This is particularly true for cases without enthesopathy, wherein sacroiliac bone marrow oedema is the predominant finding.
The differential diagnosis of early SpA and nLBP is difficult. One of the clinical features of SpA is an age onset of less than 40 years. To account for this in the present study, only patients 18–45 years of age were included. The number of false positive identified by the parameter ratios may have been increased if older patients with nLBP had been included in the study.
This study does have several limitations. For example, nine patients with sacroiliac joint degeneration and three patients with osteitis condensans ilii were excluded owing to an insufficient number of cases for analysis. In the future studies, it may be useful to assess differences calcium concentration ratios in these groups as well. In addition, the gold standard for diagnosis utilized, the final clinical diagnosis, is imperfect. Unfortunately, there is no infallible standard for the diagnosis of SpA. The possibility that spectral CT will aid in the diagnosis of SpA remains promising.
CONCLUSION
Spectral CT not only demonstrates findings of chronic sacroiliitis (i.e. bone erosion and sclerosis), but also enables qualitative and quantitative assessments of bone marrow oedema in SpA patients with active sacroilitis. CT sensitivity for the diagnosis of early synovitis and enthesitis remains limited relative to MRI. Spectral CT combined with MRI may improve the accuracy for the imaging diagnosis of axial SpA.
FUNDING
Supported by the projects from National Scientific foundation of China (number: 81320108013, 31170899, 81571643).
Contributor Information
Ping Zhang, Email: tj2012zp@163.com.
Kai Hu Yu, Email: heroine-zp321@163.com.
Rui Min Guo, Email: 277390335@qq.com.
Jun Ran, Email: 944403682@qq.com.
Yao Liu, Email: 419388836@qq.com.
John Morelli, Email: 978097414@qq.com.
Val A Runge, Email: 978097414@qq.com.
Xiao Ming Li, Email: lilyboston2002@163.com.
REFERENCES
- 1.Brandt J, Bollow M, Haberle J, Rudwaleit M, Eggens U, Distler A, et al. Studying patients with inflammatory back pain and arthritis of the lower limbs clinically and by magnetic resonance imaging: many, but not all patients with sacroiliitis have spondyloarthropathy. Rheumatology (Oxford) 1999; 38: 831–6. doi: 10.1093/rheumatology/38.9.831 [DOI] [PubMed] [Google Scholar]
- 2.Prakash D, Prabhu SM, Irodi A. Seronegative spondyloarthropathy-related sacroiliitis: CT, MRI features and differentials. Indian J Radiol Imaging 2014; 24: 271–8. doi: 10.4103/0971-3026.137046 [DOI] [PMC free article] [PubMed] [Google Scholar]
- 3.Braun J, Sieper J, Bollow M. Imaging of sacroiliitis. Clin Rheumatol 2000; 19: 51–7. [DOI] [PubMed] [Google Scholar]
- 4.Braun J, Golder W, Bollow M, Sieper J, van der Heijde D. Imaging and scoring in ankylosing spondylitis. Clin Exp Rheumatol 2002; 20(6 Suppl. 28): S178–84. [PubMed] [Google Scholar]
- 5.Rudwaleit M, van der Heijde D, Landewe R, Listing J, Akkoc N, Brandt J, et al. The development of Assessment of SpondyloArthritis international Society classification criteria for axial spondyloarthritis (part II): validation and final selection. Ann Rheum Dis 2009; 68: 777–83. doi: 10.1136/ard.2009.108233 [DOI] [PubMed] [Google Scholar]
- 6.Rudwaleit M, Landewe R, van der Heijde D, Listing J, Brandt J, Braun J, et al. The development of Assessment of SpondyloArthritis international Society classification criteria for axial spondyloarthritis (part I): classification of paper patients by expert opinion including uncertainty appraisal. Ann Rheum Dis 2009; 68: 770–6. doi: 10.1136/ard.2009.108217 [DOI] [PubMed] [Google Scholar]
- 7.Rudwaleit M, Jurik AG, Hermann KG, Landewe R, van der Heijde D, Baraliakos X, et al. Defining active sacroiliitis on magnetic resonance imaging (MRI) for classification of axial spondyloarthritis: a consensual approach by the ASAS/OMERACT MRI group. Ann Rheum Dis 2009; 68: 1520–7. doi: 10.1136/ard.2009.110767 [DOI] [PubMed] [Google Scholar]
- 8.Wang L, Liu B, Wu XW, Wang J, Zhou Y, Wang WQ, et al. Correlation between CT attenuation value and iodine concentration in vitro: discrepancy between gemstone spectral imaging on single-source dual-energy CT and traditional polychromatic X-ray imaging. J Med Imaging Radiat Oncol 2012; 56: 379–83. doi: 10.1111/j.1754-9485.2012.02379.x [DOI] [PubMed] [Google Scholar]
- 9.Lv P, Lin XZ, Li J, Li W, Chen K. Differentiation of small hepatic hemangioma from small hepatocellular carcinoma: recently introduced spectral CT method. Radiology 2011; 259: 720–9. doi: 10.1148/radiol.11101425 [DOI] [PubMed] [Google Scholar]
- 10.Zhang P, Yu KH, Guo RM, Ran J, Liu Y, Morelli J, et al. A novel diagnostic method (spectral computed tomography of sacroiliac joints) for axial spondyloarthritis. J Formos Med Assoc Sep 2015. Epub ahead of print. doi: 10.1016/j.jfma.2015.07.003 [DOI] [PubMed] [Google Scholar]
- 11.Schett G. Bone marrow edema. Ann N Y Acad Sci 2009; 1154: 35–40. doi: 10.1111/j.1749-6632.2009.04383.x [DOI] [PubMed] [Google Scholar]
- 12.Slobodin G, Rosner I. Indemonstrable axial spondyloarthritis: does it exist? Isr Med Assoc J 2013; 15: 780–1. [PubMed] [Google Scholar]
- 13.Del Grande F, Santini F, Herzka DA, Aro MR, Dean CW, Gold GE, et al. Fat-suppression techniques for 3-T MR imaging of the musculoskeletal system. Radiographics 2014; 34: 217–33. doi: 10.1148/rg.341135130 [DOI] [PMC free article] [PubMed] [Google Scholar]
- 14.Krinsky G, Rofsky NM, Weinreb JC. Nonspecificity of short inversion time inversion recovery (STIR) as a technique of fat suppression: pitfalls in image interpretation. AJR Am J Roentgenol 1996; 166: 523–6. doi: 10.2214/ajr.166.3.8623620 [DOI] [PubMed] [Google Scholar]
- 15.Baum R, Gravallese EM. Impact of inflammation on the osteoblast in rheumatic diseases. Curr Osteoporos Rep 2014; 12: 9–16. doi: 10.1007/s11914-013-0183-y [DOI] [PMC free article] [PubMed] [Google Scholar]
- 16.Carlson GC, Shipley MT, Keller A. Long-lasting depolarizations in mitral cells of the rat olfactory bulb. J Neurosci 2000; 20: 2011–21. [DOI] [PMC free article] [PubMed] [Google Scholar]
- 17.Muche B, Bollow M, Francois RJ, Sieper J, Hamm B, Braun J. Anatomic structures involved in early- and late-stage sacroiliitis in spondylarthritis: a detailed analysis by contrast-enhanced magnetic resonance imaging. Arthritis Rheum 2003; 48: 1374–84. doi: 10.1002/art.10934 [DOI] [PubMed] [Google Scholar]
- 18.McLauchlan GJ, Gardner DL. Sacral and iliac articular cartilage thickness and cellularity: relationship to subchondral bone end-plate thickness and cancellous bone density. Rheumatology 2002; 41: 375–80. doi: 10.1093/rheumatology/41.4.375 [DOI] [PubMed] [Google Scholar]
- 19.Benjamin M, McGonagle D. The anatomical basis for disease localisation in seronegative spondyloarthropathy at entheses and related sites. J Anat 2001; 199(Pt 5): 503–26. [DOI] [PMC free article] [PubMed] [Google Scholar]
- 20.Maksymowych WP. Ankylosing spondylitis—at the interface of bone and cartilage. J Rheumatol 2000; 27: 2295–301. [PubMed] [Google Scholar]
- 21.de Bosset P, Gordon DA, Smythe HA, Urowitz MB, Koehler BE, Singal DP. Comparison of osteitis condensans ilii and ankylosing spondylitis in female patients: clinical, radiological and HLA typing characteristics. J Chronic Dis 1978; 31: 171–81. doi: 10.1016/0021-9681(78)90032-2 [DOI] [PubMed] [Google Scholar]


