Abstract
We sought to determine the impact that duration of hyperglycemia and control has on corneal nerve fiber density in relation to standard diabetic neuropathy endpoints. Control and streptozotocin-diabetic C57Bl/6J mice were analyzed after 4, 8, 12 and 20 weeks. For the 20 week time point five groups of mice were compared: control, untreated diabetic, and diabetic treated with insulin designated as having either poor glycemic control, good glycemic control or poor glycemic control switched to good glycemic control. Hyperglycemia was regulated by use of insulin releasing pellets. Loss of corneal nerves in the sub-epithelial nerve plexus or corneal epithelium progressed slowly in diabetic mice requiring 20 weeks to reach statistical significance. In comparison, slowing of motor and sensory nerve conduction velocity developed rapidly with significant difference compared to control mice observed after 4 and 8 weeks of hyperglycemia, respectively. In diabetic mice with good glycemic control average blood glucose levels over the 20 week experimental period were lowered from 589 ± 2 to 251 ± 9 mg/dl. All diabetic neuropathy endpoints examined were improved in diabetic mice with good glycemic control compared to untreated diabetic mice. However, good control of blood glucose was not totally sufficient in preventing diabetic neuropathy.
Keywords: diabetic peripheral neuropathy, corneal nerves, nitrotyrosine, corneal confocal microscopy
Introduction
Diabetic peripheral neuropathy has a complex etiology and the only recognized treatment is glycemic control (Horowitz, 2006; Obrosova, 2009). However, even with good glycemic control the consequences of diabetic peripheral neuropathy can be severe, thus there is a need for discovery of an effective treatment (Horowitz, 2006). A wide range of treatments for diabetic peripheral neuropathy have had promising outcomes in rodent models but translation of these treatments to humans has failed in clinical trials (Yorek, 2008). There are many possible reasons for these failures including use of endpoints in animal studies that were non-predictive of outcome for human studies (Yorek, 2008). The most common endpoint for diabetic peripheral neuropathy in clinical trials has been nerve conduction velocity (Dunnigan, et al., 2013). Slowing of nerve conduction velocity takes many years to develop in diabetic patients but only weeks in diabetic animal models and for that reason nerve conduction velocity may not be a good translational endpoint. Early detection and treatment is the most effective approach for curing or slowing progression of human disease. Therefore, there is a need to develop a method for earlier detection of diabetic peripheral neuropathy.
To address this issue corneal confocal microscopy has emerged as a tool to measure small nerve fiber damage in diabetic neuropathy (Malik, et al., 2003; Quattrini, et al., 2007; Tavakoli, et al., 2008; 2010). Corneal confocal microscopy can image corneal nerves residing in the sub-epithelial nerve plexus or stromal layer in vivo and non-invasively. Loss of corneal nerves in diabetic patients has been shown to correlate with the severity of peripheral neuropathy and has been proposed to be a surrogate marker for diabetic peripheral neuropathy (Malik, et al., 2003; Petropoulos, et al., 2013). We have previously demonstrated loss of corneal nerve fibers in rats with diet induced obesity as well as in type 1 and type 2 diabetic rats (Davidson, et al., 2012a; 2012b; 2014). In the sub-epithelial nerve plexus initial loss of corneal nerves occurred in the region of the whorl and the earliest detectable loss of corneal nerves were nerves that penetrated the corneal epithelium (Davidson, et al., 2012b; 2014). We also found a correlation exists for intraepidermal nerve fiber density of the skin of the footpad and corneal nerve fiber length as determined by corneal confocal microscopy and corneal nerve fiber density of the corneal epithelium (Davidson, et al., 2014). Little is known about how glycemic control or duration of diabetes impacts corneal nerve fiber density in the sub-epithelial basal layer or at their more distal ends in the corneal epithelium or its relation to retinal nerve loss. In this study we examined the effect of duration of hyperglycemia and glycemic control on changes in nerve fiber density in the cornea and retinal ganglion layer thickness in the retinal ganglion cell (RGC) complex in relation to non-ocular standard diabetic neuropathy endpoints including nerve conduction velocity, intraepidermal nerve fiber density and behavioral response to mechanical and thermal stimuli.
Materials and Methods
Materials
Unless stated otherwise all chemicals used in these studies were obtained from Sigma Chemical Co. (St. Louis, MO).
Animals
C57Bl/6J mice were purchased from Jackson Laboratories. Mice were housed in a certified animal care facility and food (Harlan Teklad, #7001, Madison, WI) and water were provided ad libitum. Adequate measures were taken to minimize pain or discomfort and all experiments were conducted in accordance with international standards on animal welfare and were compliant with all institutional and National Institutes of Health guidelines for use of animals (ACURF protocol 1212258).
C57Bl/6J mice at 12 weeks of age were divided into five groups. Four of the five groups were treated with streptozotocin (150 mg/kg i.p in saline) to induce diabetes (Coppey, et al., 2011). Mice having blood glucose levels of 300 mg/dl (16.7 mM) or greater were considered to be diabetic. The other group served as the control and was treated with vehicle. Two weeks after induction of diabetes and before initiation of treatment blood glucose levels were rechecked to verify no mice had reverted back to normal glycemia. Diabetic group 1 was untreated for the duration of the experiment (no control of glycemia). Diabetic group 2 (poor glycemic control) was treated with one-half of a Linβit insulin implant as instructed by the manufacture (Linshin Canada, Ontario, Canada). Diabetic group 3 (good glycemic control) was treated with a one whole insulin implant. Diabetic group 4 (poor switched to good glycemic control) was initially treated with one-half of an insulin implant for 6 weeks and then received a whole insulin implant for the remainder of the study period. Implants were replaced at 6 week intervals because according to the manufactures guidelines the implants are designed to release insulin at a rate of 0.1 U/day/implant and will last for > 40 days. Thus, each group of mice received 3 implants over the course of the study period. Non-treated diabetic mice received a sham procedure. Blood glucose was measured weekly on a Monday morning and average blood glucose levels over the course of the study period are shown in Table 1. This approach allowed us to confirm that insulin release from the implant was maintained as expected and that the mice maintained the desired blood glucose level throughout the study. The experimental treatment period lasted for 18 weeks. In addition to this protocol separate groups of control and untreated diabetic mice were examined after 4, 8 and 12 weeks to establish a disease time course.
Table 1.
Effect of Diabetes and Glycemic Control on Change in Body Weight, Blood Glucose and Serum Triglycerides, Free Fatty Acids, Cholesterol and Nitrotyrosine and Dorsal Root Ganglion Nitrotyrosine and 4-Hydroxynonenal (4-HNE)
| Determination | Control | Diabetic | Diabetic Poor Glycemic Control |
Diabetic Good Glycemic Control |
Diabetic Poor Switched to Good Glycemic Control |
|---|---|---|---|---|---|
| (11) | (10) | (11) | (11) | (12) | |
| Start weight (g) | 23.7 ± 0.6 | 24.5 ± 0.4 | 23.5 ± 0.5 | 23.3 ± 0.5 | 23.7 ± 0.5 |
| End weight (g) | 31.9 ± 0.9 | 27.3 ± 0.8a | 27.1 ± 0.6a | 28.1 ± 0.8a | 27.8 ± 0.6a |
| Blood glucose (mg/dl) | 131 ± 3 | 589 ± 2a | 363 ± 9a,b | 251 ± 9a,b,c | 304 ± 9a,b,c,d |
| Serum Triglycerides (mg/dl) |
41.3 ± 7.1 | 76.3 ± 6.8a | 53.1 ± 6.4 | 46.7 ± 4.6b | 47.8 ± 6.2b |
| Serum Free fatty acids (mmol/l) |
0.26 ± 0.03 | 0.68 ± 0.09a | 0.43 ± 0.05b | 0.36 ± 0.06b | 0.37 ± 0.05b |
| Serum Cholesterol (mg/ml) |
0.29 ± 0.03 | 0.58 ± 0.04a | 0.41± 0.03b | 0.39 ± 0.03b | 0.40 ± 0.03b |
| Serum Nitrotyrosine (pmol/mg protein) |
3.8 ± 0.4 | 5.7 ± 0.8 | 5.1 ± 0.7 | 4.3 ± 0.5 | 4.9 ± 0.7 |
| DRG Nitrotyrosine (RFU/cell area (mm2)) |
291 ± 13 | 383± 32a | 311 ± 14 | 261 ± 18b | 300 ± 17 |
| DRG 4-HNE (RFU/cell area (mm2)) |
264 ± 22 | 363 ± 21a | 346 ± 22a | 324 ± 16 | 336 ± 22 |
Total duration of diabetes was 20 weeks. Data are presented as the mean ± S.E.M.
p < 0.05 compared to control;
p < 0.05 compared to untreated diabetic;
p < 0.05 compared to diabetic poor glycemic control;
p < 0.05 compared to diabetic good glycemic control.
Parentheses indicate the number of experimental animals.
Behavioral tests
Thermal nociceptive response in the hindpaw was measured using the Hargreaves method with instrumentation provided by IITC Life Science; Woodland Hills, CA (model 390G) or UARD (San Diego). Thermal nociceptive responses were measured by placing the mouse in the observation chamber on top of the thermal testing apparatus and allowing it to acclimate to the warmed glass surface (30°C) and surroundings for a period of 15 min. The mobile heat source was maneuvered so that it was under the heal of the hindpaw and then activated, a process that starts a timer and locally warms the glass surface, when the mouse withdrew its paw, the timer, and the heat source was turned off (Coppey, et al., 2011). Following an initial recording, which was discarded, four measurements were made for each hindpaw, with a rest period of 5 min between each set of measurements. The mean, reported in seconds, was used as a measure of the thermal nociceptive response latency. Tactile responses were evaluated by quantifying the withdrawal threshold of the hindpaw in response to stimulation with flexible von Frey filaments as previously described (Obrosova, et al., 2007). The data were reported in grams. Each of these tests was repeated at least three times with a rest period of 15 minutes between tests. These tests were completed before the terminal procedures and on different days.
Motor and sensory nerve conduction velocity
Mice were anesthetized with Nembutal (75 mg/kg, i.p., Abbott Laboratories, North Chicago, IL) and motor and sensory nerve conduction velocities were determined as previously described (Coppey, et al., 2011). Briefly, motor nerve conduction velocity was determined using a noninvasive procedure in the sciatic-posterior tibial conducting system in a temperature controlled environment. The left sciatic nerve was stimulated first at the sciatic notch and then at the Achilles tendon. Stimulation consisted of single 0.2-ms supramaximal (8 V) pulses through a bipolar electrode (Grass S44 Stimulator; Grass Medical Instruments, Quincy, MA). The evoked potentials were recorded from the interosseous muscle with a unipolar platinum electrode and displayed on a digital storage oscilloscope (model 54600A; Hewlett-Packard, Rolling Meadows, IL). Motor nerve conduction velocity was calculated by subtracting the distal from the proximal latency (measured in milliseconds) from the stimulus artifact of the take-off of the evoked potential, and the difference was divided into the distance between the two stimulating electrodes (measured in millimeters using a Vernier caliper). Sensory nerve conduction velocity was recorded in the digital nerve to the second toe by stimulating with a square-wave pulse of 0.05-ms duration using the smallest intensity current that resulted in a maximal amplitude response (Grass S44 Stimulator; Grass Medical Instruments, Quincy, MA). The sensory nerve action potential was recorded behind the medial malleolus. The maximal sensory nerve conduction velocity was calculated by measuring the latency to the onset/peak of the initial negative deflection and the distance between stimulating and recording electrodes. Core temperature was monitored using a rectal probe and temperature regulated between 36° C and 37° C using a heating pad and radiant heat. Motor and sensory nerve conduction velocity was reported in meters per second.
Corneal innervation
Sub-epithelial corneal nerves were imaged in vivo using the Rostock cornea module of the Heidelberg Retina Tomograph (Heidelberg Engineering, Vista, CA) confocal microscope as previously described (Davidson, et al., 2012a). Briefly, the anesthetized mouse was secured to a platform that allowed adjustment and positioning of the mouse in three dimensions. A drop of GenTeal (lubricant eye gel) (Alcon; Fort Worth, TX) was applied onto the tip of the lens and advanced slowly forward until the gel contacted the cornea allowing optical but not physical contact between the objective lens and corneal epithelium. Two high-quality images without overlap of the sub-epithelial basal nerve plexus of the central cornea were acquired by finely focusing the objective lens to maximally resolve the nerve layer just under the corneal epithelium. For these studies a single parameter of corneal innervation was quantified (Davidson, et al., 2012a). Corneal nerve fiber length defined as the total length of all nerve fibers and branches (in millimeters) present in the acquired images standardized for area of the image (in square millimeters) was determined for each image by tracing the length of each nerve in the image, summing the total length and dividing by the image area (Davidson, et al., 2012a). The corneal fiber length for each mouse was the mean value obtained from the acquired images and expressed as mm/mm2. Based on receiver operating characteristic (ROC) curve analysis corneal nerve fiber length is the optimal morphological parameter of corneal nerves for diagnosing patients with diabetic neuropathy and has the lowest coefficient of variation (Malik, et al., 2003; Tavakoli, et al., 2011).
After completion of all in vivo analysis, including corneal confocal microscopy, corneas were dissected from the eyes and trimmed around the scleral-limbal region. The cornea was fixed for 1h in Zamboni’s fixative, blocked using phosphate-buffered saline with 0.2% Triton X-100, 2% goat serum and 1% bovine serum albumin for 2h, and then incubated in the same buffer with neuronal class III β-tubulin mouse monoclonal antibody at a concentration of 1:1000 overnight at 4°C (Covance, Dedham, MA). After washing with incubation buffer, the tissue was incubated with Alexa Fluor 546 goat anti-mouse IgG2a at 1:500 in incubation buffer for 2 hours at room temperature (Invitrogen, Eugene, OR). After washing, the cornea was placed epithelium side up on a microscope slide. Four radial cuts were made and the tissue was carefully covered with a cover slip, mounted with ProLong Gold (Life Technologies, Carlsbad, CA) antifade reagent and sealed with clear nail polish. Images were collected using a Zeiss LSM710 confocal microscope with ZEN Black software and comprised 3×3 tile scan confocal z-stacks of the epithelial nerves in the central whorl region (Carl Zeiss, Oberkochen, Germany). An analysis of corneal epithelial nerves was completed with Imaris software version 7.6.4 ×64 (Bitplane, Zurich, Switzerland). Three-dimensional representations of confocal stacks were reconstructed by volume rendering, where a volume of tissue was defined over the fluorescent staining and used for quantitation of corneal epithelial nerve volume.
Spectral domain optical coherence tomography of the retina
Spectral domain optical coherence tomography (SD-OCT) analysis was performed 20 weeks following induction of diabetes using a Spectralis SD-OCT (Heidelberg Engineering, Vista, CA) imaging system coupled with a 25D lens for mouse ocular imaging (Heidelberg Engineering, Vista, CA), as we have previously described (Mohan, et al., 2012; 2013). Mice were anesthetized with a combination of ketamine (0.03 mg/g; i.p.) and xylazine (0.005 mg/g; i.p.) and placed on a heating pad to maintain body temperature. Pupils were dilated using a 1% tropicamide solution. The cornea was moisturized with a saline solution, which was applied every 20–30 s. Volume scans (49 line dense array) were placed on the retina included the location of the optic nerve head and the retina superior temporal to it. Scans were analyzed by an individual masked to the treatment of the mouse. The thickness of the RGC complex containing the retinal ganglion cells, their dendrites and axons was analyzed in that portion of the scan including the superior retina, approximately 200 µm from the border of the peripapillary region. This is a region in the mouse retina where the retinal ganglion cell density is greatest. All scans were analyzed by excluding blood vessels from retinal thickness calculation, since blood vessels in rodents can add to the measured thickness (Connolly, et al., 1988).
Skin intraepidermal nerve fiber density
Footpads were fixed in ice-cold Zamboni’s fixative for 3h, washed in 100 mM phosphate-buffered saline (PBS) overnight, and then in PBS containing increasing amounts of sucrose i.e., 10%, 15%, and 20%, 3h in each solution (Stavniichuk, et al., 2014). After washing, the samples were snap frozen in O.C.T. (Sakura Finetek USA, Torrance, CA) and stored at −80°C. Three longitudinal 30 µm-thick footpad sections were cut using a Reichert-Jung cryocut 1800 (Leica Microsystems, Nussloch, Germany). Non-specific binding was blocked by 3% goat serum containing 0.5% porcine gelatin and 0.5% Triton X-100 in SuperBlock blocking buffer (Thermo Scientific, Rockford, IL) at room temperature for 2h. The sections were then incubated overnight with PGP 9.5 antiserum (UltraClone, Isle of Wight, UK) in 1:400 dilution at 4°C, after which secondary Alexa Fluor 488 conjugated goat anti-rabbit antibody (Invitrogen, Eugene, OR) in 1:1000 dilution was applied at room temperature for 1h. Sections were then coverslipped with VectaShield mounting medium (Vector Laboratories, Burlingame, CA). Profiles were imaged using a Zeiss LSM710 confocal microscope with a 40× objective and were counted by two individual investigators that were masked to the sample identity. All immunoreactive profiles within the epidermis were counted and normalized to epidermal length. Length of the epidermis was determined by drawing a polyline along the contour of the epidermis and recording its length in mm. The number of intraepidermal nerve fiber profiles was reported per mm length.
Fluorescent immunohistochemistry in dorsal root ganglia
Dorsal root ganglia (DRG) were dissected and fixed in normal buffered 4% formaldehyde for 24 h at 4°C, dehydrated and embedded in paraffin (Lupachyk, et al., 2013). Sections were cut at 3 µm thickness, dewaxed in xylene, hydrated in decreasing concentrations of ethanol, washed in distilled water and subjected to heat induced epitope retrieval in 10 mM citrate buffer (pH 6.0) with 0.05% Tween 20. To create positive control for anti-nitrotyrosine antibody, several deparaffinized sections from random mice were incubated with 1 mM peroxynitrite in 100 mM sodium acetate buffer, pH 5.0 for 30 min preceding the antigen retrieval step. Then the sections were subsequently incubated with Image-iT FX signal enhancer for 30 min and blocking solution containing 2% BSA, 5% normal goat serum and 0.3% Triton X100 in 50 mM Tris-buffered saline (pH 8.4) for 1 hour with thorough washes between the steps. The incubation with anti-nitrotyrosine (1:100) (Invitrogen, Eugene, OR) and anti-4-hydroxynonenal adduct (1:500) (EMD Millipore Corporation, Billerica, MA) primary antibodies were performed overnight at 4°C. The secondary Alexa Fluor 488 or Alexa Fluor 594 (Invitrogen, Eugene, OR) conjugated goat anti-rabbit antibodies were applied for 1 h at room temperature at a working dilution 1:400. Sections were mounted in VectaShield (Vector Laboratories, Burlingame, CA) mounting medium. All sections were processed and evaluated by a single investigator who was masked to the identity. Color images were captured at 400× magnification with a Zeiss LSM710 confocal microscope (Carl Zeiss, Oberkochen, Germany). Nitrotyrosine and 4-hydroxynonenal fluorescence intensity of individual DRG neurons was quantified using the ImageJ software (National Institutes of Health), and normalized per neuronal area. For nitrotyrosine immunofluorescence analysis, nuclei of individual cells were excluded from the regions of interest. Neurons (70–100 per mouse) were counted, and the average values for each animal were used to calculate group means.
Protein bound 3-nitrotyrosine concentration was measured in serum samples by indirect enzyme-linked immunosorbent assay as described (Weber, et al., 2012). To prevent errors which could result from 3-nitrotyrosine potentially present in commercial bovine serum albumin (BSA), the ultra-fatty acid free BSA (Roche Diagnostics, Mannheim, Germany) solution was reduced with sodium hydrosulfite prior to its use in the assay as a blocking agent and a diluent for 3-nitrotyrosine standards. Nitrated BSA was prepared by addition of an alkaline stock solution of peroxynitrite to a final concentration of 0.5 mM. The concentration of 3-nitrotyrosine in BSA standard was calculated from the calibration curve generated by reading the absorbance of 0–100 µM 3-nitrotyrosine at 438 nm (pH 9.0). Maxisorp 96-well immuno plates (Thermo Fisher Scientific, Waltham, MA) were coated with 100 µg/well of nitrated BSA standard or sample protein in 20 mM phosphate buffered saline (PBS, pH 7.4) overnight at 4°C. The next day, the solution was removed and plates were washed with 0.05% Tween 20 in PBS. The plates were incubated with 5% reduced BSA and 0.5% milk (Bio-Rad Laboratories, Inc, Hercules, CA) in PBS for 2 h at room temperature to block non-specific binding. Then 0.05 µg/well of rabbit polyclonal anti-nitrotyrosine antibody (EMD Millipore Corporation, Billerica, MA) was applied for 2 h at 37°C followed by incubation with 0.01 µg/well of HRP-conjugated goat anti-rabbit antibody (EMD Millipore Corporation, Billerica, MA) for 1 h at room temperature. The color reaction was developed using 1 mg/mL o-phenylenediamine dihydrochloride as a substrate and was stopped after 30 min by addition of 2.5 M sulfuric acid. Absorbance was measured at 492 nm and at 750 nm (reference wavelength), and the corrected absorbance was used to plot a standard curve and interpolate the concentration of unknown samples by linear regression. Each of the standard and serum samples was analyzed in triplicate. The protein concentration in BSA standard and serum was measured with the bicinchoninic acid protein assay (Thermo Fisher Scientific, Waltham, MA). Serum was also used for determining levels of free fatty acid, triglyceride and free cholesterol using commercial kits from Roche Diagnostics, Mannheim, Germany; Sigma Chemical Co., St. Louis, MO; and Bio Vision, Mountain View, CA; respectively.
Data Analysis
The results are presented as mean ± SE. Comparison between control and diabetic only were conducted using Student t-test (Prism software; GraphPad, San Diego, CA). Comparisons between the groups for body weight, blood glucose, MNCV, SNCV, thermal nociception and intraepidermal nerve fiber profiles were conducted using a one-way ANOVA and Bonferroni’s pairwise test for multiple comparisons (Prism software; GraphPad, San Diego, CA). Correlation coefficients for corneal nerves and intraepidermal nerve fibers were also determined using Prism software (GraphPad, San Diego, CA). A p value of less 0.05 was considered significant.
Results
Effect of diabetes and glycemic control on physiological parameters
Data in Table 1 demonstrate that after 20 weeks diabetic mice without treatment gained less weight than control mice. Treating mice with insulin by implanting one-half or a full size insulin releasing pellets for the latter 18 weeks of diabetes did not improve weight gain. After implantation of insulin releasing pellets, diabetic mice without insulin treatment had a significantly higher blood glucose value compared to either control mice or mice in poor, good or poor switched to good glycemic control. Blood glucose levels in well controlled mice were significantly improved compared to mice in poor glycemic control. Likewise, mice described as being in poor switched to good glycemic control had a significantly lower blood glucose value than mice in poor glycemic control but were significantly higher compared to mice in good glycemic control. Serum triglyceride, free fatty acid and cholesterol levels were significantly increased in untreated diabetic mice. In contrast to the effect of differing insulin treatment had on blood glucose levels, the levels of serum triglyceride, free fatty acid and cholesterol were improved to a similar degree in all mice receiving insulin. There was a trend for higher serum nitrotyrosine levels in diabetic mice without insulin treatment that was lower in mice receiving insulin, but these differences did not reach significance. Examining two markers of oxidative stress in dorsal root ganglion neurons, nitrotyrosine and 4-hydroxynonenal levels were significantly increased in diabetic mice without treatment. Mice in good glycemic control had significantly reduced levels of nitrotyrosine and 4-hydroxynonenal in dorsal root ganglion neurons compared to diabetic mice without treatment. Levels of nitrotyrosine and 4-hydroxynonenal in dorsal root ganglion neurons were higher in mice with poor glycemic control compared to mice in good glycemic control but these differences were not significant. In mice with poor switched to good glycemic control, levels of nitrotyrosine and 4-hydroxynonenal in dorsal root ganglion neurons were in-between levels found in poor and good glycemic control mice.
Effect of diabetes and glycemic control on corneal nerves and neural retina
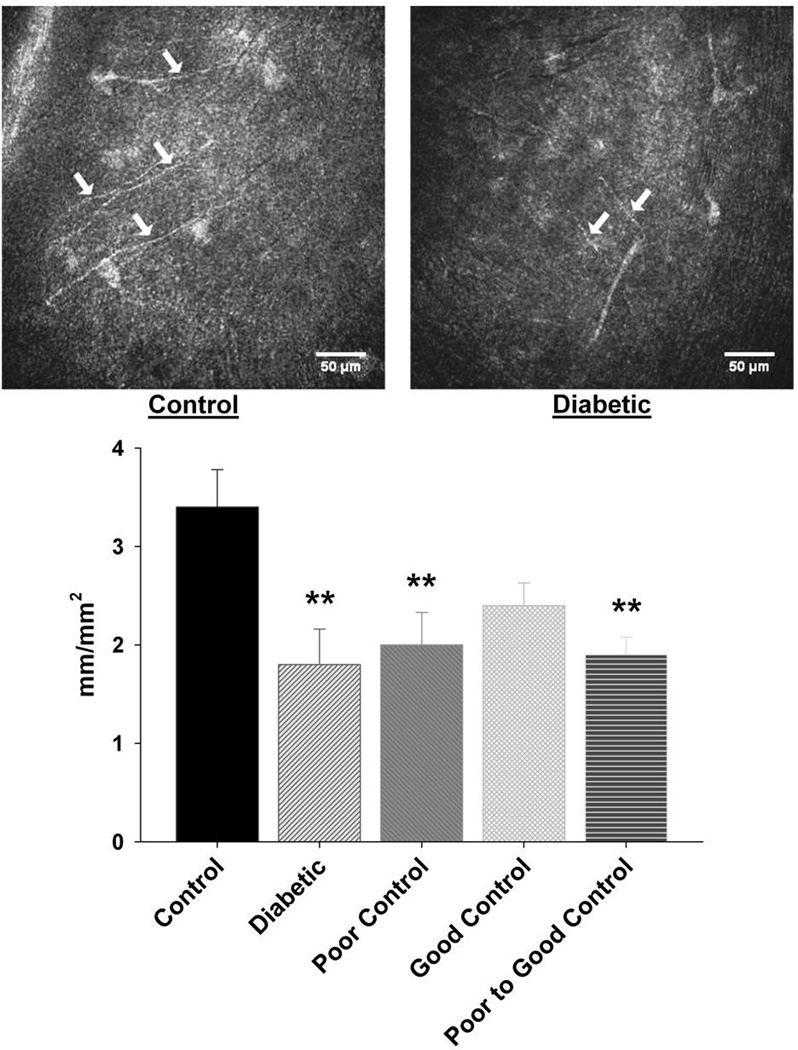
Corneal nerves in the sub-epithelial nerve plexus were imaged using corneal confocal microscopy. Data in Fig. 1 demonstrate that corneal nerve density was significantly decreased to a similar degree in diabetic mice without insulin treatment as well as in diabetic mice with poor glycemic control or poor switched to good glycemic control. In diabetic mice with good glycemic control loss of corneal nerves was not significantly different than control. When this analysis was performed in mice after 4, 8 and 12 weeks of untreated diabetes there was a trend for an increase in total corneal nerve length after 4 and 8 weeks of untreated diabetes and a non-significant decrease after 12 weeks of untreated diabetes compared to age-matched control mice (data not shown).
Figure 1. Effect of diabetes and glycemic control on innervation of sub-basal layer of the cornea.
Innervation of the sub-basal layer of the cornea was determined by using corneal confocal microscopy as described in the Materials and Methods section. The groups examined and the number of mice in each group was the same as described in Table 1. Total duration of diabetes was 20 weeks. The photographs show examples of sub-epithelial basal layer of corneal nerves of a control mouse (left) and a 20 week untreated diabetic mouse (right). Data are presented as the mean ± S.E.M. for innervation of the cornea in mm/mm2. ** p < 0.01 compared to control mice; one-way analysis of variance with Bonferroni’s pairwise test for multiple comparisons. Scale bar = 50 µm.
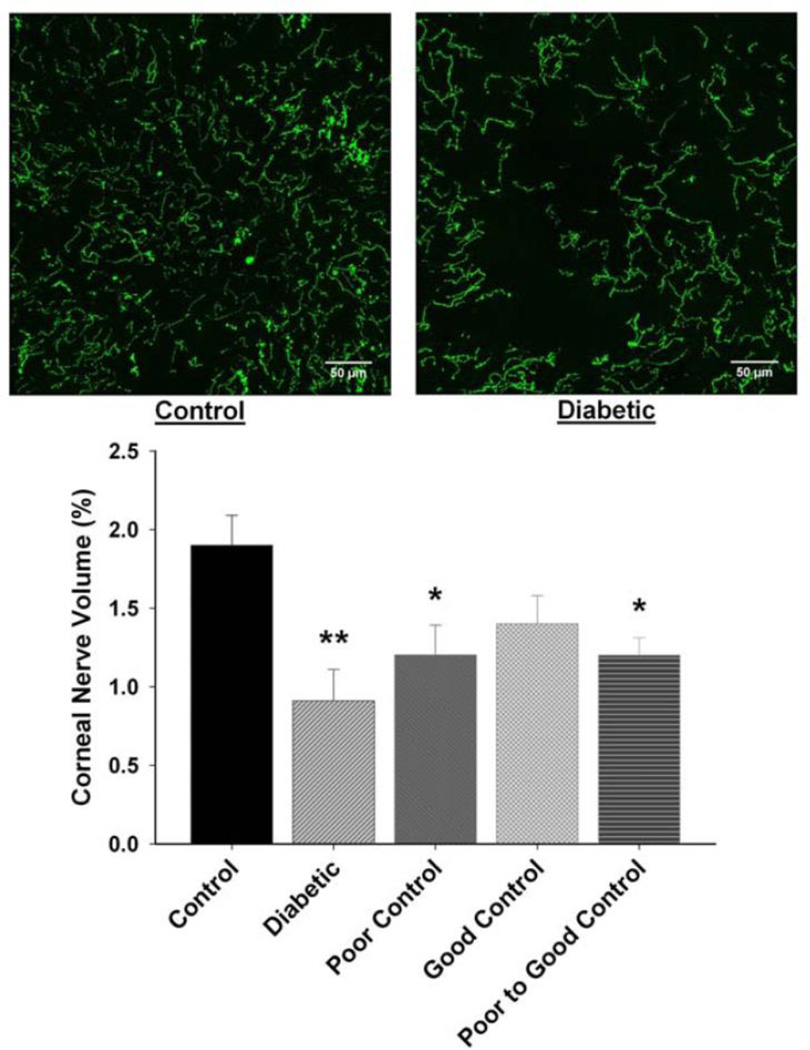
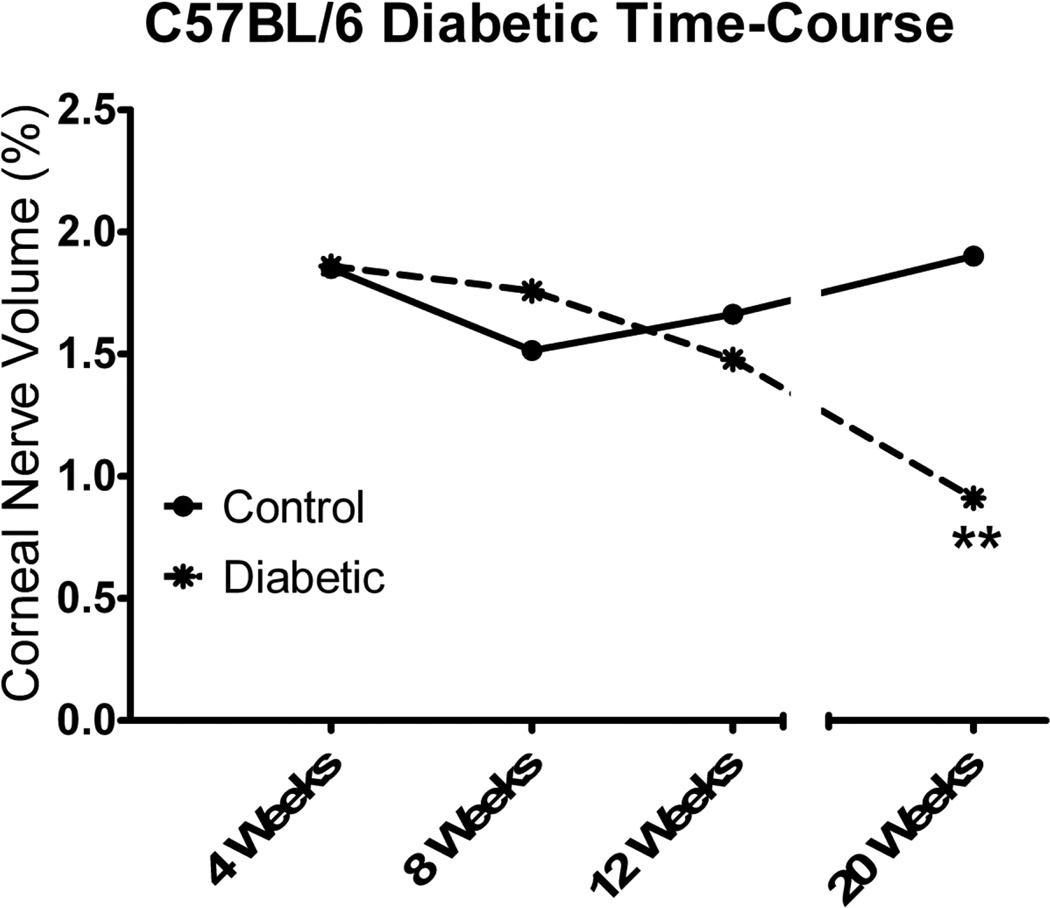
Following corneal confocal microscopy, the cornea from each mouse was harvested and immunostained with neuronal class III β-tubulin and examined using Zeiss confocal microscopy to isolate the corneal nerves penetrating the corneal epithelium. Data in Fig. 2 demonstrate that there is a significant loss of corneal nerves penetrating the corneal epithelium after 20 weeks of diabetes without insulin treatment (no control of glycemia). There was also a significant loss of these nerves in mice with poor glycemic control or poor switched to good glycemic control. In diabetic mice with good glycemic control, loss of corneal nerves penetrating the epithelium was not significantly different than control. Data in Fig. 3 demonstrate that diabetes-induced loss of corneal nerves penetrating the corneal epithelium did not reach significance until after 20 weeks of untreated diabetes.
Figure 2. Effect of diabetes and glycemic control on innervation of the corneal epithelium.
Innervation of the corneal epithelium was determined by using standard confocal microscopy as described in the Materials and Methods section. The groups examined and the number of mice in each group was the same as described in Table 1. Total duration of diabetes was 20 weeks. The photographs show examples of the en face view of the intra-epithelial corneal nerves of a control mouse (left) and a 20 week untreated diabetic mouse without treatment (right). Data are presented as the mean ± S.E.M. for innervation of the corneal epithelium as a percentage of corneal volume. ** p < 0.01 compared to control mice; * p < 0.05 compared to control mice; one-way analysis of variance with Bonferroni’s pairwise test for multiple comparisons. Scale bar = 50 µm.
Figure 3. Effect of duration of untreated diabetes on innervation of the corneal epithelium.
Innervation of the corneal epithelium was determined by using standard confocal microscopy as described in the Materials and Methods section. The duration of diabetes in this study was 4, 8, 12 and 20 weeks. A minimum of 6 control and diabetic mice were examined for each time period. Data are presented as the mean ± S.E.M. for innervation of the corneal epithelium as a percentage of corneal volume. ** p < 0.01 compared to control mice; Student t-test.
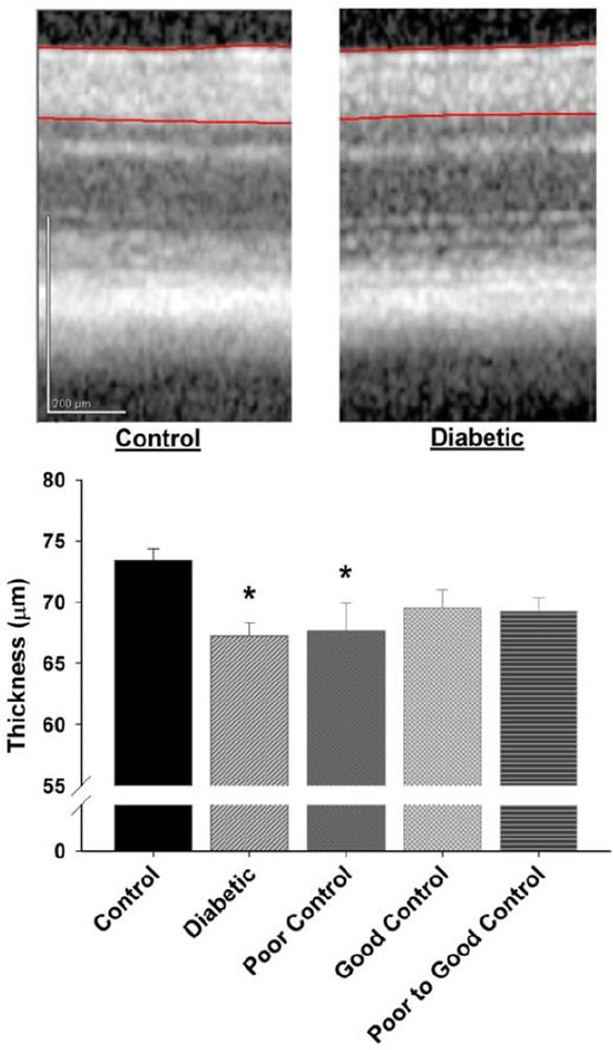
Data in Fig. 4 demonstrate that after 20 weeks of uncontrolled or poorly controlled diabetes there is a significant thinning of the RGC complex compared to control mice. The thickness of the retinal ganglion complex in diabetic mice with good glycemic control or poor switched to good glycemic control was not significantly different from control mice.
Figure 4. Effect of diabetes and glycemic control on retinal ganglion cell complex thickness.
Thickness of the retinal ganglion cell (RGC) complex (RGC soma + dendrites + axons; demarcated by red lines) was determined as described in Materials and Methods. An example of an OCT section is shown from a control mouse retina (left) and from a untreated diabetic mouse retina (right). The groups examined and the number of mice in each group was the same as described in Table 1. Total duration of diabetes was 20 weeks. Data are presented as the mean ± S.E.M. for thickness of the retinal ganglion cell complex in µm. * p < 0.05 compared to control mice; one-way analysis of variance with Bonferroni’s pairwise test for multiple comparisons. Vertical scale bar = 200 µm.
Effect of diabetes and glycemic control on standard diabetic neuropathy and behavioral endpoints
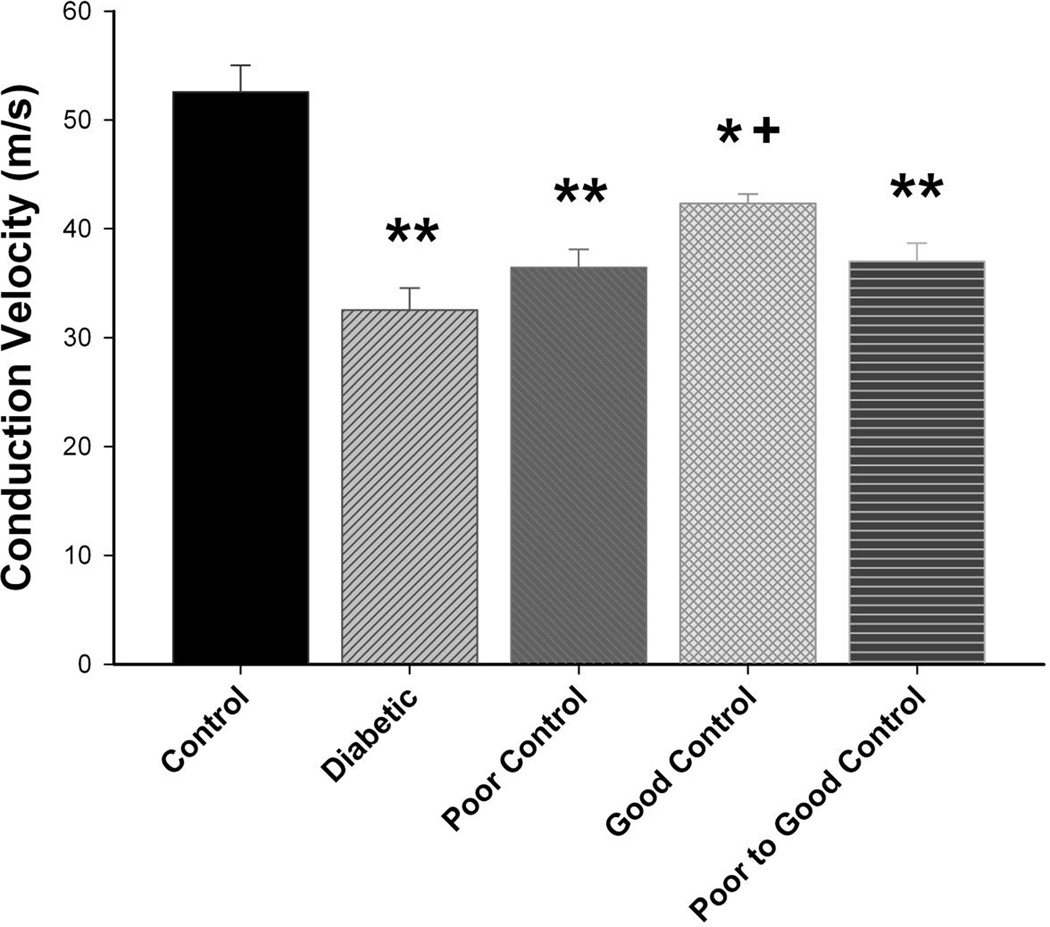
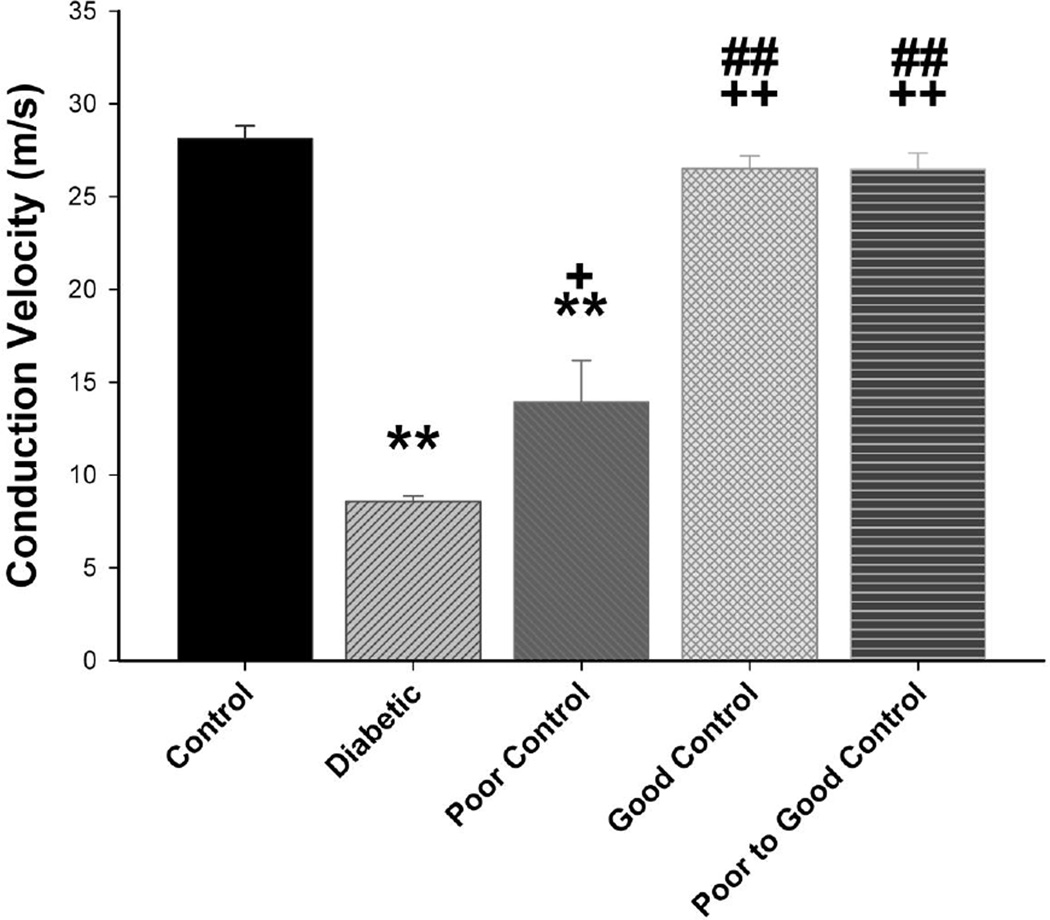
Data in Fig. 5 demonstrate that motor nerve conduction velocity is significantly reduced in diabetic mice without insulin treatment as well as in diabetic mice with poor glycemic control or poor switched to good glycemic control compared to control mice. Motor nerve conduction velocity is also significantly decreased in diabetic mice with good glycemic control compared to control mice but also in these mice motor nerve conduction velocity was significantly improved compared to diabetic mice without treatment. Slowing of motor nerve conduction velocity occurs quickly in diabetic mice without insulin treatment. We observed a significant decrease after 4 weeks of hyperglycemia (data not shown). Sensory nerve conduction velocity is significantly decreased in diabetic mice without insulin treatment compared to control mice (Fig. 6). In diabetic mice with poor glycemic control sensory nerve conduction velocity was significantly decreased compared to control but also significantly improved compared to diabetic mice without insulin treatment (no glycemic control). In diabetic mice with good glycemic control or poor switched to good glycemic control sensory nerve conduction velocity was similar to control mice and significantly improved compared to diabetic mice without glycemic control and diabetic mice in poor glycemic control. Slowing of sensory nerve conduction was observed after 8 weeks in diabetic mice without insulin treatment (data not shown).
Figure 5. Effect of diabetes and glycemic control on motor nerve conduction velocity.
Motor nerve conduction velocity was examined as described in the Materials and Methods section. The groups examined and the number of mice in each group was the same as described in Table 1. Total duration of diabetes was 20 weeks. Data are presented as the mean ± S.E.M for motor nerve conduction velocity in m/sec. ** p < 0.01 compared to control mice; * p < 0.05 compared to control mice; + p < 0.05 compared to untreated diabetic mice; one-way analysis of variance with Bonferroni’s pairwise test for multiple comparisons.
Figure 6. Effect of diabetes and glycemic control on sensory nerve conduction velocity.
Sensory nerve conduction velocity was examined as described in the Materials and Methods section. The groups examined and the number of mice in each group was the same as described in Table 1. Total duration of diabetes was 20 weeks. Data are presented as the mean ± S.E.M. for sensory nerve conduction velocity in m/sec. ** p < 0.01 compared to control mice; * p < 0.05 compared to control mice; ++ p < 0.01 compared to untreated diabetic mice; + p < 0.05 compared to untreated diabetic mice ## p < 0.01 compared to diabetic poor glycemic control mice; one-way analysis of variance with Bonferroni’s pairwise test for multiple comparisons.
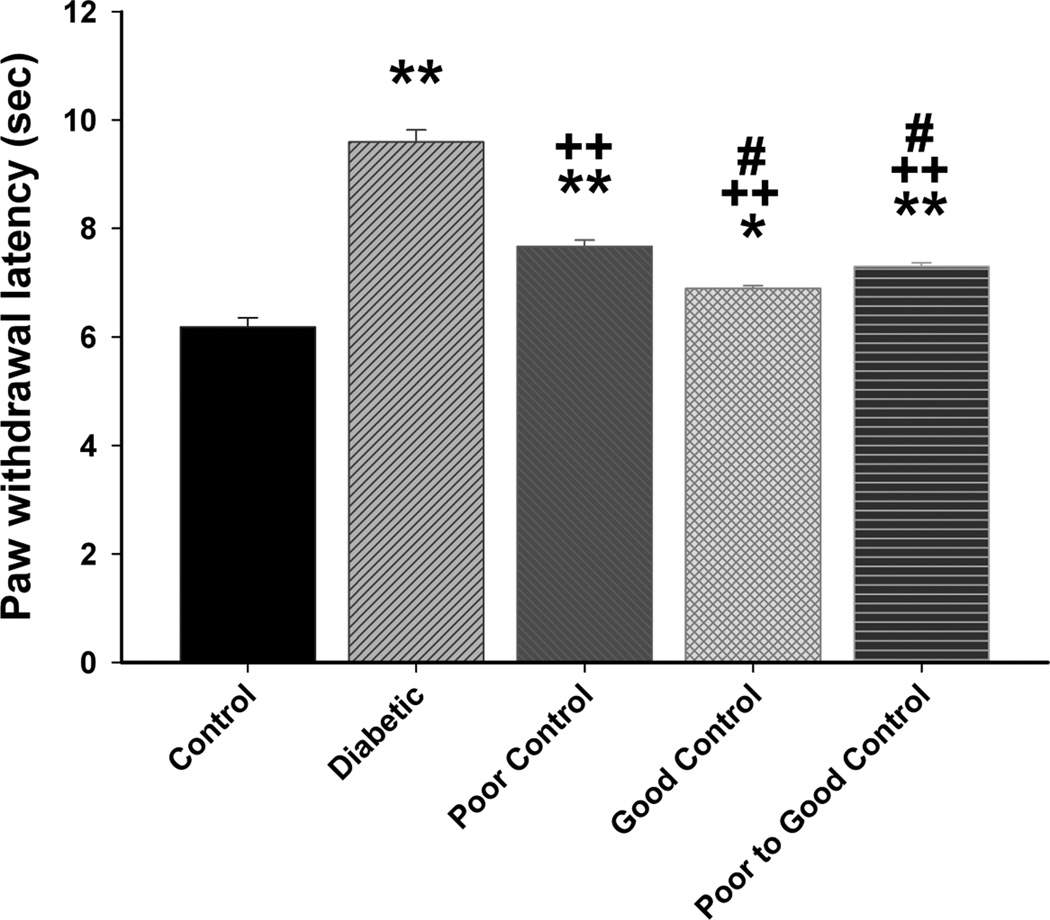
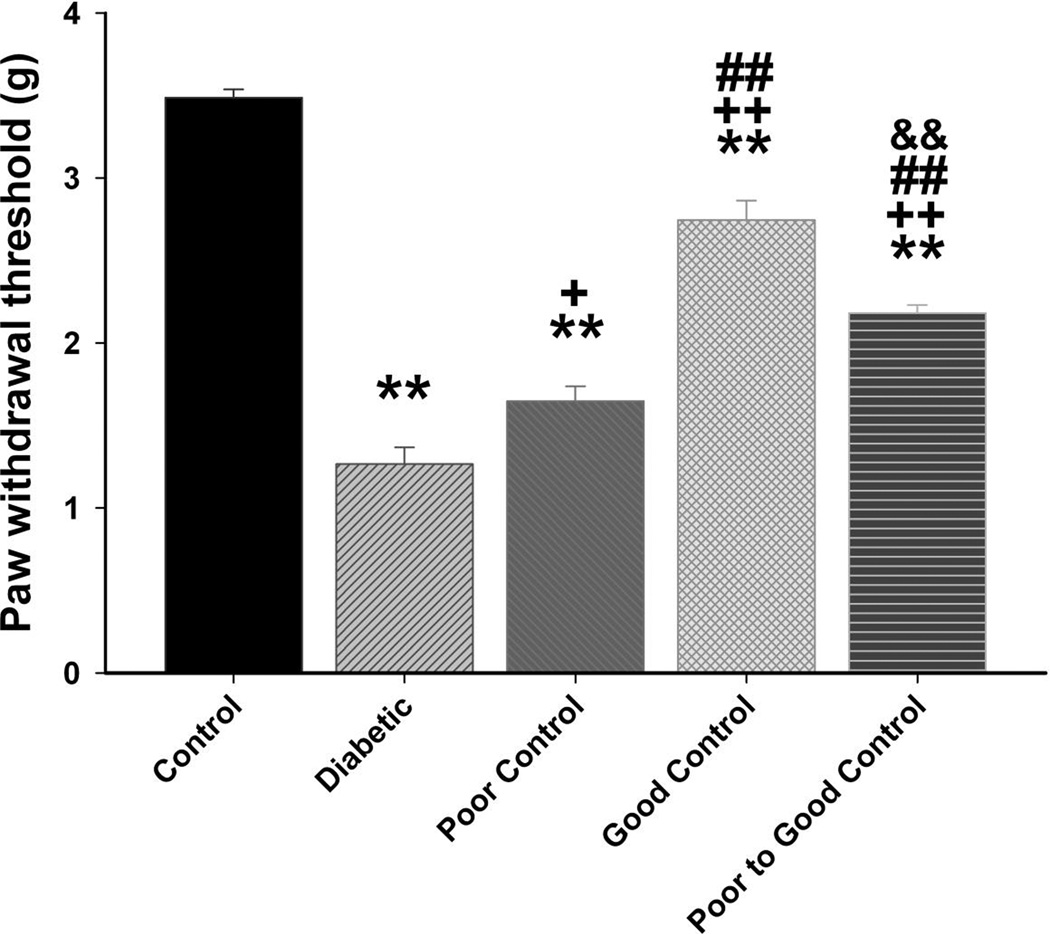
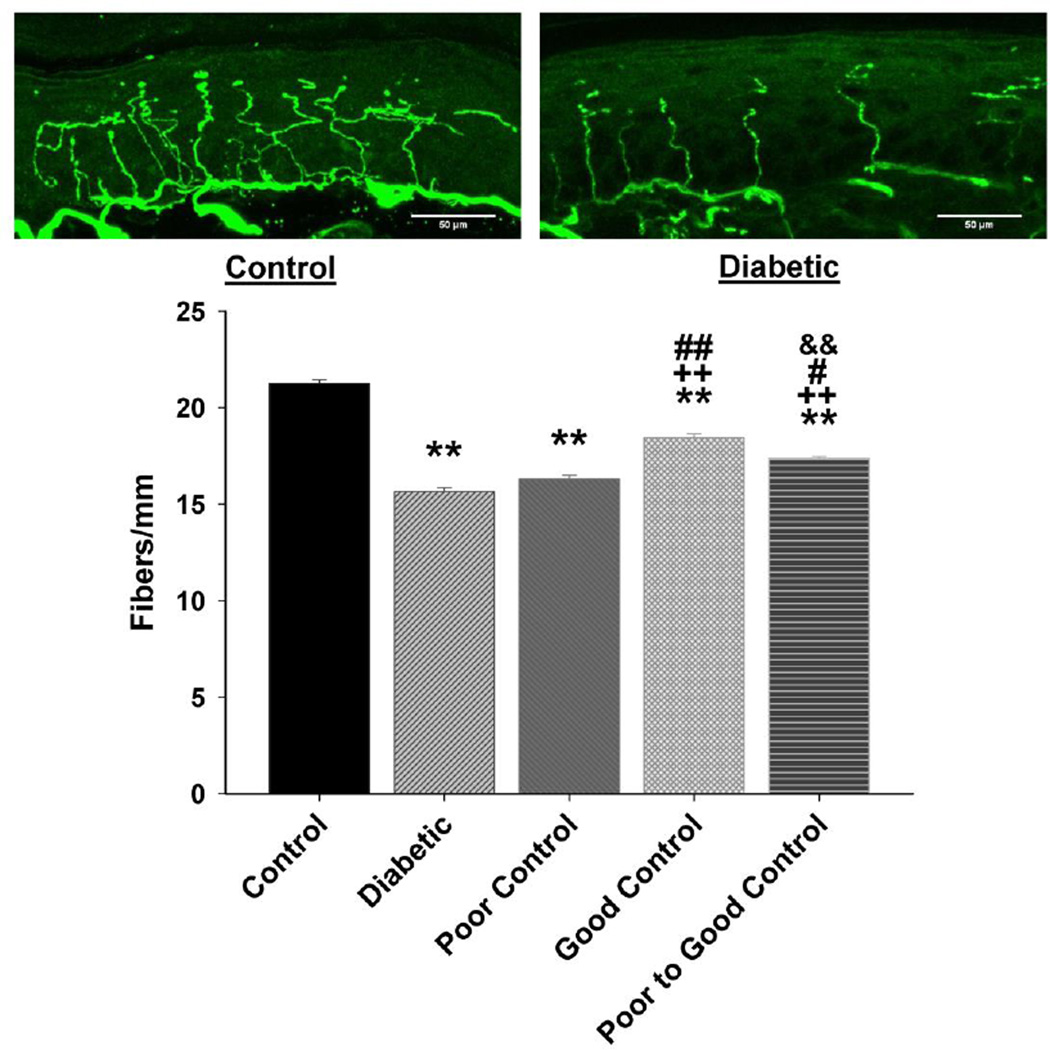
Data in Fig. 7 show that diabetic mice without insulin treatment are hypoalgesic after 20 weeks of hyperglycemia. Impairment of thermal sensitivity was also observed in diabetic mice without treatment after only 8 weeks of hyperglycemia (data not shown). Thermal latency was significantly improved in diabetic mice in poor glycemic control, poor switched to good glycemic control and to the greatest extent in diabetic mice in good glycemic control. Diabetic mice were more sensitive to mechanical stimulation (Fig. 8). Paw withdrawal threshold was significantly improved in diabetic mice with poor glycemic control compared to diabetic mice without insulin treatment. Diabetic mice with poor switched to good glycemic control were significantly improved compared to diabetic without treatment but not as responsive as diabetic mice in good glycemic control. All diabetic mice were more sensitive than control mice to mechanical stimulation. After 20 weeks of hyperglycemia there was a significant decrease in intraepidermal nerve fibers in the skin of the hindpaw in diabetic mice without insulin treatment and diabetic mice in poor glycemic control compared to control mice (Fig. 9). There was a significant improvement in nerve fiber density in diabetic mice with poor switched to good glycemic control compared to diabetic mice and to the greatest extent in diabetic mice with good glycemic control. Correlations coefficients were also determined for intraepidermal nerve fiber density and corneal sub-epithelial nerve fiber length or corneal epithelial nerve fiber density. This analysis demonstrated a significant correlation exists for intraepidermal nerve fiber density of the skin of the footpad and corneal nerve fiber length as determined by corneal confocal microscopy (r = 0.47; p < 0.01) and corneal nerve fiber density of the corneal epithelium (r = 0.44; p < 0.01).
Figure 7. Effect of diabetes and glycemic control on thermal nociception.
Thermal nociception was examined as described in the Materials and Methods section. The groups examined and the number of mice in each group was the same as described in Table 1. Total duration of diabetes was 20 weeks. Data are presented as the mean ± S.E.M. for thermal nociception in sec. ** p < 0.01 compared to control mice; * p < 0.05 compared to control mice; ++ p < 0.01 compared to untreated diabetic mice; # p < 0.05 compared to diabetic poor glycemic control mice; one-way analysis of variance with Bonferroni’s pairwise test for multiple comparisons.
Figure 8. Effect of diabetes and glycemic control on tactile sensitivity.
Tactile sensitivity was examined as described in the Materials and Methods section. The groups examined and the number of mice in each group was the same as described in Table 1. Total duration of diabetes was 20 weeks. Data are presented as the mean ± S.E.M. for paw withdrawal threshold in g. ** p < 0.01 compared to control mice; ++ p < 0.05 compared to untreated diabetic mice; + p < 0.05 compared to untreated diabetic mice; ## p < 0.01 compared to diabetic poor glycemic control mice; && p < 0.01 compared to diabetic good glycemic control mice; one-way analysis of variance with Bonferroni’s pairwise test for multiple comparisons.
Figure 9. Effect of diabetes and glycemic control on intraepidermal nerve fiber density.
Intraepidermal nerve fiber density was examined as described in the Materials and Methods section. The groups examined and the number of mice in each group was the same as described in Table 1. Total duration of diabetes was 20 weeks. Data are presented as the mean ± S.E.M. for intraepidermal nerve fiber as fibers per mm. ** p < 0.01 compared to control mice; ++ p < 0.01 compared to untreated diabetic mice; ## p < 0.01 compared to diabetic poor glycemic control mice; # p < 0.05 compared to diabetic poor glycemic control mice; && p < 0.01 compared to diabetic good glycemic control mice; one-way analysis of variance with Bonferroni’s pairwise test for multiple comparisons. Scale bar = 50 µm.
Discussion
Diabetic peripheral neuropathy is the most common complication of diabetes and is associated with significant morbidity and mortality. It is characterized by progressive, distal-to-proximal degeneration of peripheral nerves and leads to pain, weakness, and eventual loss of sensation (O’Brien, et al., 2014). The mechanisms contributing to diabetic peripheral neuropathy are uncertain although studies in animal models have implicated oxidative and nitrosative stress as likely contributors (Yorek, 2003; Obrosova, 2009). However, treatments for oxidative stress found to be successful in animal models for diabetic peripheral neuropathy have not been as successful in patients and currently the only recognized treatment for diabetic peripheral neuropathy in type 1 diabetic patients is good glycemic control (Sullivan and Feldman, 2005; Boulton, et al., 2013). This lack of success has led investigators to seek new and early biomarkers for diabetic neuropathy. Determination of nerve conduction velocity has long been the gold standard used for staging diabetic peripheral neuropathy in patients (Dunnigan, et al., 2013). However, in contrast to rodent models of diabetes, slowing of nerve conduction velocity takes years to develop in patients and may not be the best endpoint for discovery of new treatments. Investigators have been focusing on loss of small nerve fibers as visualized in skin biopsies using immunohistochemistry or non-invasively in the cornea using corneal confocal microscopy as a surrogate marker for diabetic neuropathy (Sullivan and Feldman, 2005; Malik, et al., 2003).
Loss of corneal nerves in diabetic patients has been shown to correlate with the severity of peripheral neuropathy (Petropoulos, et al., 2013). We have previously demonstrated that changes in corneal nerve innervation and sensitivity occur in both pre-diabetic as well as type 1 and type 2 diabetic rats (Davidson, et al., 2012a; 2012b; 2014). However, little is known about the effect of duration of diabetes and glycemic control on the progression of nerve damage in the cornea in relation to the standard markers of diabetic neuropathy such as motor and sensory nerve conduction velocity.
One of the primary findings from this study was that slowing of motor nerve conduction velocity was detected after 4 weeks of hyperglycemia and was the earliest defect related to diabetic neuropathy to occur in streptozotocin-diabetic C57Bl/6J mice. This was followed by slowing of sensory nerve conduction velocity and decreased thermal sensitivity which occurred after 8 weeks of hyperglycemia. Loss of nerve fibers in the cornea was not detected until 20 weeks of hyperglycemia. Compared to human diabetes impairment in nerve conduction velocity in diabetic rodents appears very quickly. In streptozotocin treated type 1 diabetic rats motor nerve conduction velocity was found to be decreased after only 2 weeks of hyperglycemia (Coppey, et al., 2000). In Zucker diabetic fatty rats we found motor nerve conduction velocity to be decreased 4–6 weeks after onset of hyperglycemia (Oltman, et al., 2005). This rapid onset of impairment in nerve conduction velocity brings into question the value of this measurement in rodents as a translational endpoint for drug discovery for treatment of diabetic neuropathy, since it does not appear to be affected until late in the course of diabetic neuropathy in humans.
Another important finding from this study was that treating streptozotocin-diabetic C57Bl/6J mice with insulin two weeks after the onset of hyperglycemia demonstrated that the degree of glycemic control impacted the development/progression of diabetic neuropathy. For all endpoints examined diabetic mice designated as having good glycemic control with blood glucoses lowered from near 600 mg/dl to 250 mg/dl had improved neurological deficits compared to untreated diabetic mice. For some endpoints there was also significant improvement in diabetic mice with good glycemic control compared to diabetic mice with poor glycemic control. In diabetic mice designated as having poor control and switched to good glycemic control blood glucose levels over the course of the study were significantly higher than for diabetic mice with good glycemic control. This was true even after eliminating the data from the first 6 weeks of the study which was the time these mice were receiving only one-half an insulin secreting pellet. Average blood glucose level for the final 12 weeks of the study, during the time the mice were receiving a full insulin secreting pellet, was 286 ± 11 mg/dl. This suggests that maximizing blood glucose control as early as possible impacts long term glycemic control. It also impacts development/progression of diabetic neuropathy. Improvement in diabetic neuropathy endpoints was not as successful in mice with poor switched to good glycemic control compared to mice with good glycemic control. When diabetic mice with poor control switched to good control were compared to diabetic mice with good glycemic control, only sensory nerve conduction velocity, RGC complex thickness in the retina, thermal and mechanical sensitivity and intraepidermal nerve fibers in the skin were improved. There was no improvement in the loss of corneal nerves or motor nerve conduction velocity in diabetic mice with poor switched to good glycemic control. This could be due to the slow development of corneal nerve deficits (and possibly slow development of improvement with treatment) in diabetic mice. Twenty weeks of diabetes without insulin treatment (no glycemic control) was needed to observe a loss of nerves in the corneal epithelium. In diabetic mice with poor glycemic control we found little improvement in diabetic neuropathy endpoints even though average blood glucose levels were significantly improved compared to the non-treated diabetic mice.
The improvement in diabetic neuropathy endpoints in response to better glycemic control was not likely due to improvement in lipid levels. Most diabetic neuropathy endpoints were improved in diabetic mice with good glycemic control compared to diabetic mice with poor glycemic control but improvement in serum triglycerides, free fatty acids and cholesterol was similar for diabetic mice with poor glycemic control compared to diabetic mice with good glycemic control. It has been shown that hyperlipidemia contributes to oxidative stress and may be a new therapeutic target for diabetic neuropathy (Vincent, et al., 2009). However, these studies suggest that improvement of hyperlipidemia alone may not be sufficient to correct diabetic neuropathy. In contrast, improvement in markers of oxidative stress 4-hydroxynonenal in dorsal root ganglion and nitrotyrosine in serum and dorsal root ganglion was associated with improvement of glycemic control and diabetic neuropathy endpoints that occurred with insulin support. The development of diabetic neuropathy has long been linked to increased oxidative stress (Vincent, et al., 2011; Tahrani, et al., 2010; Figueroa-Romero, et al., 2008; Pop-Busui, et al., 2006; Pacher, et al., 2005; Obrosova, 2003). We have recently demonstrated that peroxynitrite injury and its component, protein nitration, are implicated in the development of diabetic peripheral neuropathy (Stavniichuk, et al., 2014). Thus, targeting oxidative stress will likely be required for treatment of diabetic neuropathy.
Chen et al. (2013) reported that topical insulin delivery (0.1 – 1.0 IU/day) to the eye of streptozotocin-treated diabetic Swiss Webster mice for 4-weeks prevented a decrease in nerve occupancy in the corneal sub-epithelial basal plexus without improving hyperglycemia. Whether release of insulin in vivo could have the same result is unknown. However, it is unlikely that the dosage of insulin available to the corneal nerves from insulin releasing pellets would be in the range of the amount of insulin received through topical treatment. Therefore, the effect of insulin on corneal nerve density in our study was likely due to improvement in hyperglycemia mediated pathogenesis such as increased oxidative stress. It is important to highlight that Chen et al. (2013) did observe about 25% decreases in nerve occupancy after 4 weeks of diabetes in Swiss Webster mice. In our studies with C57Bl/6J mice it took a much longer duration of diabetes to cause a decrease in corneal nerves in the sub-epithelial basal layer. This is most likely due to differences in mouse strains.
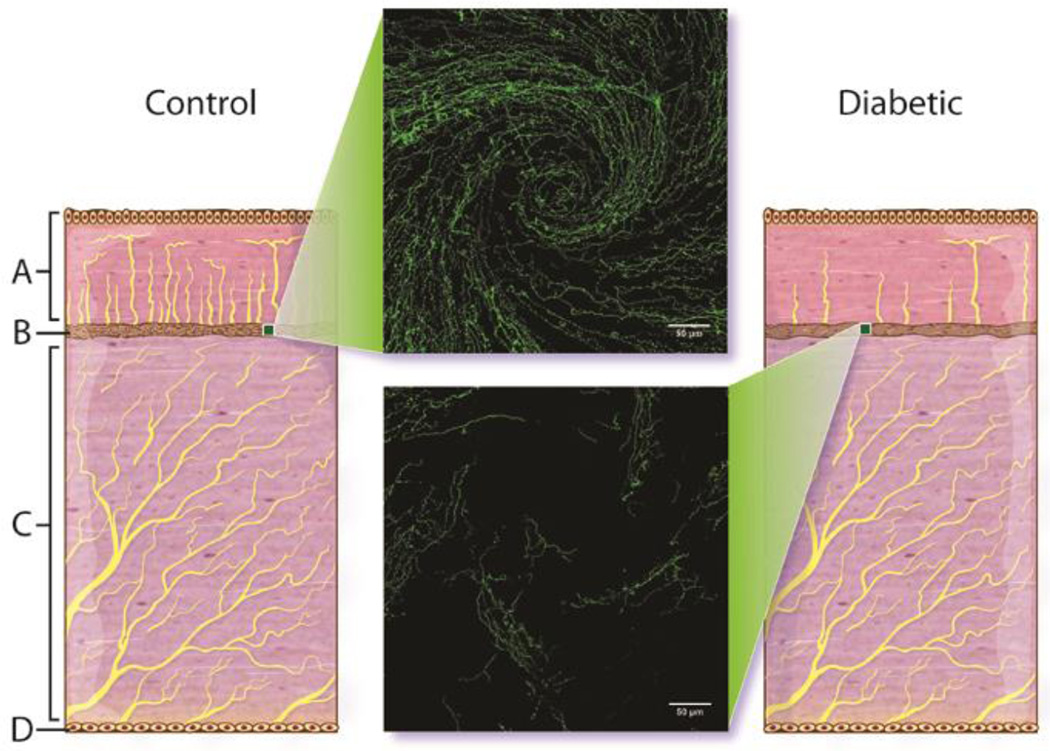
Fig. 10 provides an illustration of the effects we have observed of diabetes on the corneal nerves (Davidson, et al., 2012a; 2012b; 2014). The center inserts illustrates the disruption of corneal nerves in the region of the whorl after 20 weeks of diabetes in mice. The whorl in humans is described as a radiating pattern of nerve fiber bundles located in the sub-epithelial nerve plexus converging toward an area approximately 1 to 2 mm inferior to the corneal apex (Patel and McGhee, 2008). The illustration also depicts the loss of nerves in the epithelium with diabetes. We have not observed any loss of nerves in the stroma with diabetes but we have not studied this extensively.
Figure 10.
Illustration of the effect of diabetes on innervation of the corneal epithelium and sub-epithelial basal layer. A = cornea epithelial layer, B = cornea sub-epithelial layer, C = stroma, and D = endothelial layer of the cornea. Center images are representative of innervation of the sub-epithelial basal layer of cornea determined by examining expression of corneal nerves following isolation of the intact cornea (whole mount) and staining with β-III anti-tubulin as described in the Methods section. A representative image of the inferior whorl region of the cornea from a control mouse (top) and a 20 week untreated diabetic mouse (bottom) are shown.
In summary, diabetic neuropathy, including corneal nerve and neural retinal damage can be partially mitigated with insulin treatment in type 1 diabetic C57Bl/6J mice. A similar conclusion was made by Kan et al. (2012). They treated type 1 diabetic mice with a high-dose of insulin for 1 month after 2 months of untreated hyperglycemia. High-dose insulin reversed hyperglycemia, partly reversed thermal sensory loss, improved epidermal innervation but failed to reverse electrophysiological abnormalities. Our outcomes with good glycemic control were somewhat better. However, our type 1 diabetic mice were only hyperglycemic for two weeks prior to beginning insulin treatment and our duration of treatment was for eighteen weeks compared to two months of hyperglycemia followed by one month of high-dose insulin treatment in the study by Kan et al. (2012). Nonetheless, our conclusions were similar reducing blood glucose levels significantly does not prevent the development/progression of diabetic neuropathy. In patients good glycemic control decreases the incidence of diabetic neuropathy, but more than half of all patients with diabetes still develop this complication (Vincent, et al., 2011;). Therefore, therapies targeting the underlying mechanisms of diabetic neuropathy are essential to slow the progression of the disease (Kles and Vinik, 2006).
Acknowledgments
This material is based upon work supported in part by the Department of Veterans Affairs, Veterans Health Administration, Office of Research and Development, Biomedical Laboratory Research and Development (BX001680-01, MAY), Rehabilitation Research and Development (Merit award: RX000889-01 (MAY) and Iowa City VA Center of Excellence for the Prevention and Treatment of Visual Loss: C9251-C(RHK)) and by National Institute of Diabetes and Digestive and Kidney Diseases Grant DK081147 (MAY) from NIH. The content of this manuscript are new and solely the responsibility of the authors and do not necessarily represent the official views of the granting agencies.
References
- Boulton AJ, Kempler P, Ametov A, Ziegler D. Whither pathogenetic treatments for diabetic polyneuropathy? Diabetes Metab Res Rev. 2013;29:327–333. doi: 10.1002/dmrr.2397. [DOI] [PubMed] [Google Scholar]
- Chen DK, Frizzi KE, Guernsey LS, Ladt K, Mizisin AP, Calcutt NA. Repeated monitoring of corneal nerves by confocal microscopy as an index of peripheral neuropathy in type-1 diabetic rodents and the effects of topical insulin. J Peripher Nerv Syst. 2013;18:306–315. doi: 10.1111/jns5.12044. [DOI] [PMC free article] [PubMed] [Google Scholar]
- Connolly SE, Hores TA, Smith LE, D’Amore PA. Characterization of vascular development in the mouse retina. Microvasc Res. 1988;36:275–290. doi: 10.1016/0026-2862(88)90028-3. [DOI] [PubMed] [Google Scholar]
- Coppey LJ, Davidson EP, Dunlap JA, Lund DD, Yorek MA. Slowing of motor nerve conduction velocity in streptozotocin-induced diabetic rats is preceded by impaired vasodilation in arterioles that overlie the sciatic nerve. Int J Exp Diabetes Res. 2000;1:131–143. doi: 10.1155/EDR.2000.131. [DOI] [PMC free article] [PubMed] [Google Scholar]
- Coppey L, Davidson E, Lu B, Gerard C, Yorek M. Vasopeptidase inhibitor ilepatril (AVE7688) prevents obesity- and diabetes-induced neuropathy in C57Bl/6J mice. Neuropharmacology. 2011;60:259–266. doi: 10.1016/j.neuropharm.2010.09.008. [DOI] [PMC free article] [PubMed] [Google Scholar]
- Davidson EP, Coppey LJ, Holmes A, Yorek MA. Changes in corneal innervation and sensitivity and acetylcholine-mediated vascular relaxation of the posterior ciliary artery in a type 2 diabetic rat. Invest Ophthalmol Vis Sci. 2012a;53:1182–1187. doi: 10.1167/iovs.11-8806. [DOI] [PMC free article] [PubMed] [Google Scholar]
- Davidson EP, Coppey LJ, Yorek MA. Early loss of innervation of cornea epithelium in streptozotocin-induced type 1 diabetic rats: improvement with ilepatril treatment. Invest Ophthalmol Vis Sci. 2012b;53:8067–8074. doi: 10.1167/iovs.12-10826. [DOI] [PMC free article] [PubMed] [Google Scholar]
- Davidson EP, Coppey LJ, Kardon RH, Yorek MA. Differences and similarities in development of corneal nerve damage and peripheral neuropathy and in diet-induced obesity and type 2 diabetic rats. Invest Ophthalmol Vis Sci. 2014;55:1222–1230. doi: 10.1167/iovs.13-13794. [DOI] [PMC free article] [PubMed] [Google Scholar]
- Dunnigan SK, Ebadi H, Breiner A, Katzberg HD, Lovblom LE, Perkins BA, Bril V. Conduction slowing in diabetic sensorimotor polyneuropathy. Diabetes Care. 2013;36:3684–3690. doi: 10.2337/dc13-0746. [DOI] [PMC free article] [PubMed] [Google Scholar]
- Figueroa-Romero C, Sadidi M, Feldman EL. Mechanisms of disease: the oxidative stress theory of diabetic neuropathy. Rev Endocr Metab Disord. 2008;9:301–314. doi: 10.1007/s11154-008-9104-2. [DOI] [PMC free article] [PubMed] [Google Scholar]
- Horowitz SH. Recent clinical advances in diabetic polyneuropathy. Curr Opin Anaesthesiol. 2006;19:573–578. doi: 10.1097/01.aco.0000245287.37905.c5. [DOI] [PubMed] [Google Scholar]
- Kan M, Guo G, Singh B, Singh V, Zochodne DW. Glucagon-like peptide 1, insulin, sensory neurons, and diabetic neuropathy. J Neuropathol Exp Neurol. 2012;71:494–510. doi: 10.1097/NEN.0b013e3182580673. [DOI] [PubMed] [Google Scholar]
- Kles KA, Vinik AI. Pathophysiology and treatment of diabetic peripheral neuropathy: the case for diabetic neurovascular function as an essential component. Curr Diabetes Rev. 2006;2:131–145. doi: 10.2174/157339906776818569. [DOI] [PubMed] [Google Scholar]
- Lupachyk S, Watcho P, Shevalye H, Vareniuk I, Obrosov A, Obrosova IG, Yorek MA. Na+/H+-exchanger-1 inhibition reverses manifestation of peripheral diabetic neuropathy in type 1 diabetic rats. Am J Physiol Endocrinol Metab. 2013;305:E396–E404. doi: 10.1152/ajpendo.00186.2013. [DOI] [PMC free article] [PubMed] [Google Scholar]
- Malik RA, Kallinikos P, Abbott CA, van Schie CHM, Morgan P, Efron N, Boulton AJM. Corneal confocal microscopy: a non-invasive surrogate of nerve fibre damage and repair in diabetic patients. Diabetologia. 2003;46:683–688. doi: 10.1007/s00125-003-1086-8. [DOI] [PubMed] [Google Scholar]
- Mohan K, Harper MM, Kecova H, Ye EA, Lazic T, Sakaguchi DS, Kardon RH, Grozdanic SD. Characterization of structure and function of the mouse retina using pattern electroretinography, pupil light reflex, and optical coherence tomography. Vet Ophthalmol. 2012;15(Suppl 2):94–104. doi: 10.1111/j.1463-5224.2012.01034.x. [DOI] [PubMed] [Google Scholar]
- Mohan K, Kecova H, Hernandez-Merino E, Kardon RH, Harper MM. Retinal ganglion cell damage in an experimental rodent model of blast-mediated traumatic brain injury. Invest Ophthalmol Vis Sci. 2013;54:3440–3450. doi: 10.1167/iovs.12-11522. [DOI] [PMC free article] [PubMed] [Google Scholar]
- O’Brien PD, Sakowski SA, Feldman EL. Mouse models of diabetic neuropathy. ILAR J. 2014;54:259–272. doi: 10.1093/ilar/ilt052. [DOI] [PMC free article] [PubMed] [Google Scholar]
- Obrosova IG. Update on the pathogenesis of diabetic neuropathy. Curr Diab Rep. 2003;3:439–445. doi: 10.1007/s11892-003-0005-1. [DOI] [PubMed] [Google Scholar]
- Obrosova IG. Diabetes and the peripheral nerve. Biochim Biophys Acta. 2009;1792:931–940. doi: 10.1016/j.bbadis.2008.11.005. [DOI] [PubMed] [Google Scholar]
- Obrosova IG, Drel VR, Oltman CL, Mashtalir N, Tibrewala J, Groves JT, Yorek MA. Role of nitrosative stress in early neuropathy and vascular dysfunction in streptozotocin-diabetic rats. Am J Physiol Endocrinol Metab. 2007;293:E1645–E1655. doi: 10.1152/ajpendo.00479.2007. [DOI] [PubMed] [Google Scholar]
- Oltman CL, Coppey LJ, Gellett JS, Davidson EP, Lund DD, Yorek MA. Progression of vascular and neural dysfunction in sciatic nerves of Zucker diabetic fatty and Zucker rats. Am J Physiol Endocrinol Metab. 2005;289:E113–E122. doi: 10.1152/ajpendo.00594.2004. [DOI] [PubMed] [Google Scholar]
- Pacher P, Obrosova IG, Mabley JG, Szabo C. Role of nitrosative stress and peroxynitrite in the pathogenesis of diabetic complications. Emerging new therapeutical strategies. Curr Med Chem. 2005;12:267–275. doi: 10.2174/0929867053363207. [DOI] [PMC free article] [PubMed] [Google Scholar]
- Patel DV, McGhee CNJ. In vivo laser scanning confocal microscopy confirms that the human corneal sub-basal nerve plexus is a highly dynamic structure. Invest Ophthalmol Vis Sci. 2008;49:3409–3412. doi: 10.1167/iovs.08-1951. [DOI] [PubMed] [Google Scholar]
- Petropoulos IN, Alam U, Fadavi H, Asghar O, Green P, Ponirakis G, Marshall A, Boulton AJ, Tavakoli M, Malik RA. Corneal nerve loss detected with corneal confocal microscopy is symmetrical and related to the severity of diabetic polyneuropathy. Diabetes Care. 2013;36:3646–3651. doi: 10.2337/dc13-0193. [DOI] [PMC free article] [PubMed] [Google Scholar]
- Pop-Busui R, Sima A, Stevens M. Diabetic neuropathy and oxidative stress. Diabetes Metab Res Rev. 2006;22:257–273. doi: 10.1002/dmrr.625. [DOI] [PubMed] [Google Scholar]
- Quattrini C, Tavakoli M, Jeziorska M, Kallinikos P, Tesfaye S, Finnigan J, Marshall A, Boulton AJ, Efron N, Malik RA. Surrogate markers of small fiber damage in human diabetic neuropathy. Diabetes. 2007;56:2148–2154. doi: 10.2337/db07-0285. [DOI] [PubMed] [Google Scholar]
- Stavniichuk R, Shevalye H, Lupachyk S, Obrosov A, Groves JT, Obrosova IG, Yorek MA. Peroxynitrite and protein nitration in the pathogenesis of diabetic peripheral neuropathy. Diabetes Metab Res Rev. 2014 doi: 10.1002/dmrr.2549. in press. [DOI] [PMC free article] [PubMed] [Google Scholar]
- Sullivan KA, Feldman EL. New developments in diabetic neuropathy. Curr Opin Neurol. 2005;18:586–590. doi: 10.1097/01.wco.0000178825.56414.52. [DOI] [PubMed] [Google Scholar]
- Tahrani AA, Askwith T, Stevens MJ. Emerging drugs for diabetic neuropathy. Expert Opin Emerg Drugs. 2010;15:661–683. doi: 10.1517/14728214.2010.512610. [DOI] [PubMed] [Google Scholar]
- Tavakoli M, Hossain P, Malik RA. Clinical applications of corneal confocal microscopy. Clin Ophthalmol. 2008;2:435–445. doi: 10.2147/opth.s1490. [DOI] [PMC free article] [PubMed] [Google Scholar]
- Tavakoli M, Quattrini C, Abbott C, Kallinikos P, Marshall A, Finnigan J, Morgan P, Efron N, Boulton AJM, Malik RA. Corneal confocal microscopy: a novel non-invasive test to diagnose and stratify the severity of human diabetic neuropathy. Diabetes Care. 2010;33:1792–1797. doi: 10.2337/dc10-0253. [DOI] [PMC free article] [PubMed] [Google Scholar]
- Tavakoli M, Kallinikos P, Iqbal A, Herbert A, Fadavi H, Efron N, Boulton AJM, Malik RA. Corneal confocal microscopy detects improvement in corneal nerve morphology with an improvement in risk factors for diabetic neuropathy. Diabet Med. 2011;28:1261–1267. doi: 10.1111/j.1464-5491.2011.03372.x. [DOI] [PMC free article] [PubMed] [Google Scholar]
- Vincent AM, Callaghan BC, Smith AL, Feldman EL. Diabetic neuropathy: cellular mechanisms as therapeutic targets. Nat Rev Neurol. 2011;7:573–583. doi: 10.1038/nrneurol.2011.137. [DOI] [PubMed] [Google Scholar]
- Vincent AM, Hinder LM, Pop-Busui R, Feldman EL. Hyperlipidemia: a new therapeutic target for diabetic neuropathy. J Peripher Nerv Syst. 2009;14:257–267. doi: 10.1111/j.1529-8027.2009.00237.x. [DOI] [PMC free article] [PubMed] [Google Scholar]
- Weber D, Kneschke N, Grimm S, Bergheim I, Breusing N, Grune T. Rapid and sensitive determination of protein-nitrotyrosine by ELISA: Application to human plasma. Free Rad Res. 2012;46:276–285. doi: 10.3109/10715762.2011.652627. [DOI] [PubMed] [Google Scholar]
- Yorek MA. The role of oxidative stress in diabetic vascular and neural disease. Free Radic Res. 2003;37:471–480. doi: 10.1080/1071576031000083161. [DOI] [PubMed] [Google Scholar]
- Yorek MA. The potential role of angiotensin converting enzyme and vasopeptidase inhibitors in the treatment of diabetic neuropathy. Curr Drug Targets. 2008;9:77–84. doi: 10.2174/138945008783431736. [DOI] [PubMed] [Google Scholar]


